

The DOI matches its Crossref record; 76 of the 77 references it cites were found in a registry or an index.
Global analysis of shared T cell specificities in human non-small cell lung cancer enables HLA inference and antigen discovery
Open accessAbstract
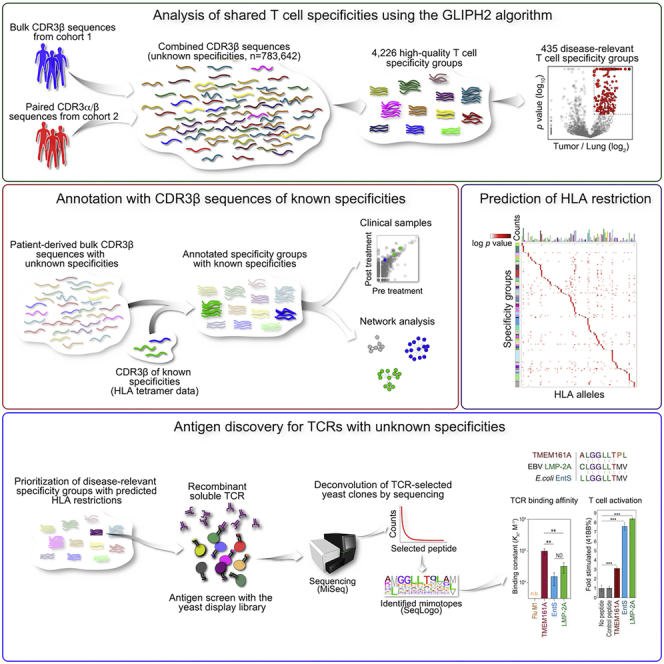
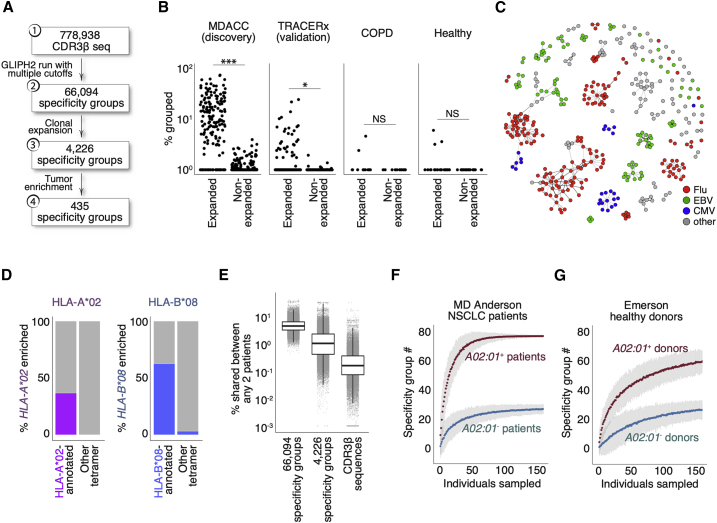
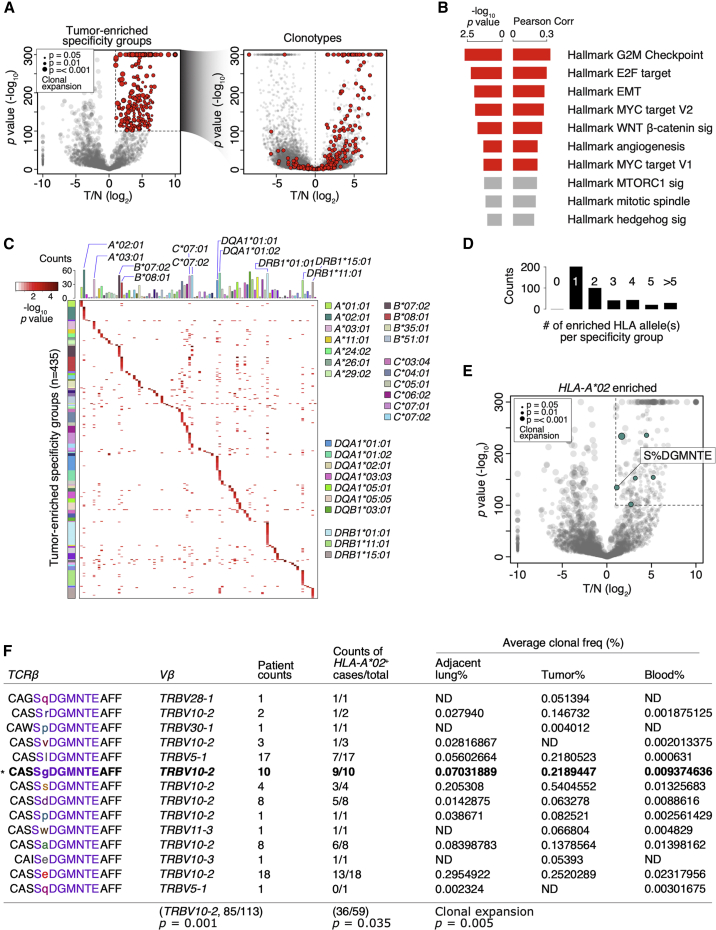
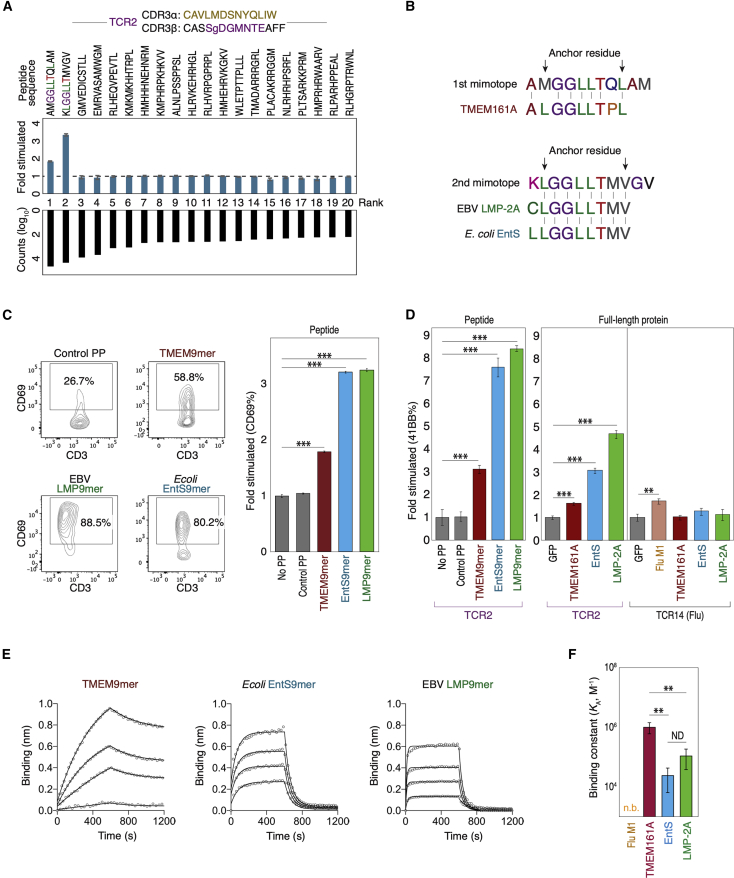
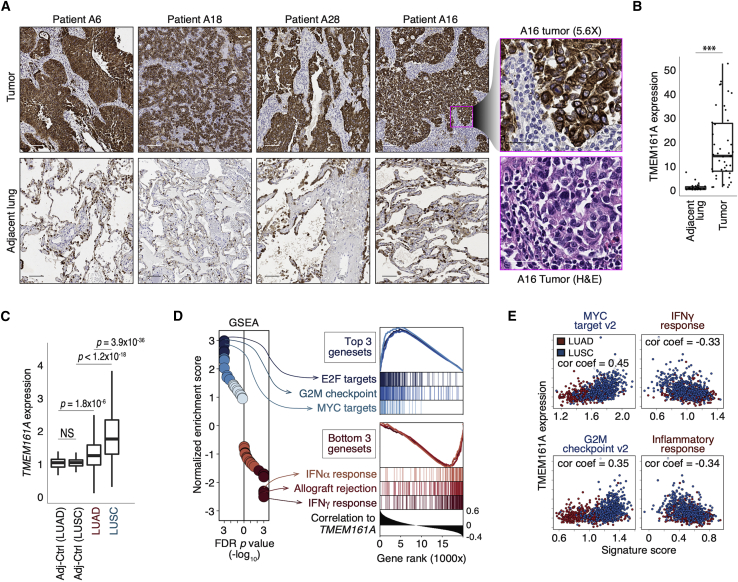
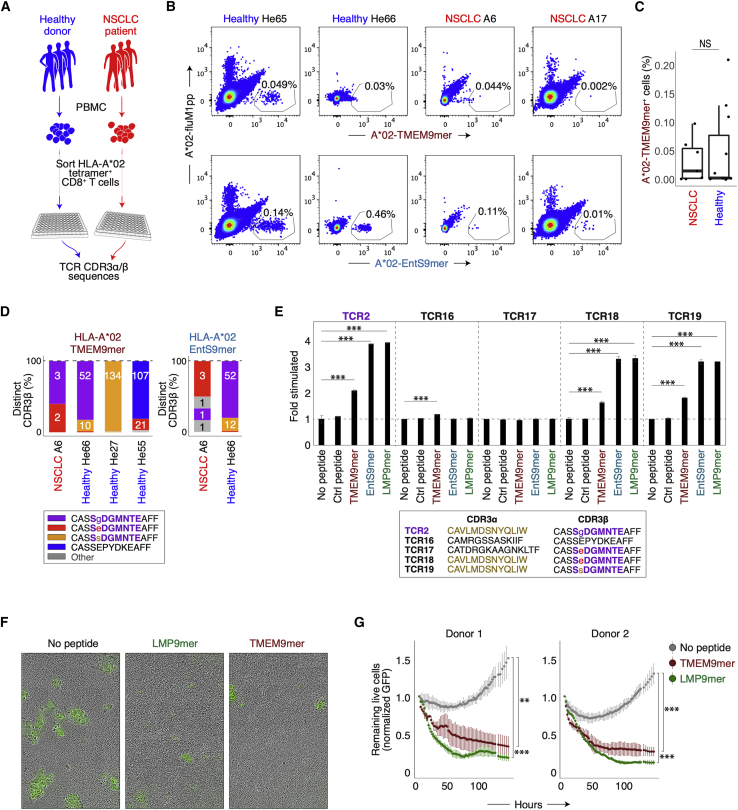
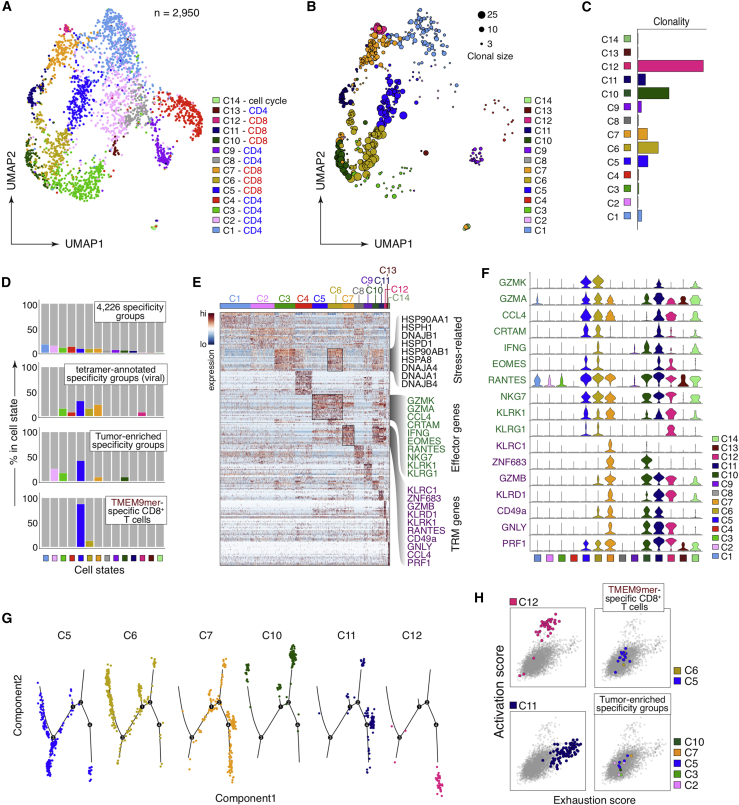
To identify disease-relevant T cell receptors (TCRs) with shared antigen specificity, we analyzed 778,938 TCRβ chain sequences from 178 non-small cell lung cancer patients using the GLIPH2 (grouping of lymphocyte interactions with paratope hotspots 2) algorithm. We identified over 66,000 shared specificity groups, of which 435 were clonally expanded and enriched in tumors compared to adjacent lung. The antigenic epitopes of one such tumor-enriched specificity group were identified using a yeast peptide-HLA A ∗ 02:01 display library. These included a peptide from the epithelial protein TMEM161A, which is overexpressed in tumors and cross-reactive epitopes from Epstein-Barr virus and E. coli . Our findings suggest that this cross-reactivity may underlie the presence of virus-specific T cells in tumor infiltrates and that pathogen cross-reactivity may be a feature of multiple cancers. The approach and analytical pipelines generated in this work, as well as the specificity groups defined here, present a resource for understanding the T cell response in cancer.
Overview
The claims and statistics of this paper haven’t been checked yet.
Run the check — free, no account needed. It reads the open-access text and checks the sources it cites.
Integrity signals
Registry
Cites
Statistics
Figures
Verification
Claims the paper makes
The claims and statistics of this paper haven’t been checked yet.
Run the check — free, no account needed. It reads the open-access text and checks the sources it cites.
Claims other papers make about this one
Each is checked against this paper’s own text: does it say what the citing paper says it does?
The cited source says what the claim attributes to it.
In the citing paper
“These findings highlight virus-specific T cells in anti-tumor responses during ICB.”
From Contrasting cytotoxic and regulatory T cell responses underlying distinct clinical outcomes to anti-PD-1 plus lenvatinib therapy in cancer (2025) · cites this paper as [80]
The cited source says what the claim attributes to it.
In the citing paper
“and suggested in a non-viral-associated cancer.80”
From Contrasting cytotoxic and regulatory T cell responses underlying distinct clinical outcomes to anti-PD-1 plus lenvatinib therapy in cancer (2025) · cites this paper as [80]
Self-check
Percentages, sums and reported differences re-computed from the paper’s own numbers.
The self-check needs the paper’s full text.
Citations
Cites
Fiji: an open-source platform for biological-image analysis
Schindelin, J., Arganda-Carreras, I., Frise, E., Kaynig, V., Longair, M., Pietzsch, T., Preibisch, S., Rueden, C., Saalfeld, S., Schmid, B., et al. (2012) · Nature Methods · doi:10.1038/nmeth.2019 · Cited by 66,890
The Sequence Alignment/Map format and SAMtools
Li, H., Handsaker, B., Wysoker, A., Fennell, T., Ruan, J., Homer, N., Marth, G., Abecasis, G., Durbin, R., & 1000 Genome Project Data Processing Subgroup (2009) · Bioinformatics · doi:10.1093/bioinformatics/btp352 · Cited by 62,041
Subramanian, A., Tamayo, P., Mootha, V. K., Mukherjee, S., Ebert, B. L., Gillette, M. A., Paulovich, A., Pomeroy, S. L., Golub, T. R., Lander, E. S., et al. (2005) · Proceedings of the National Academy of Sciences · doi:10.1073/pnas.0506580102 · Cited by 53,625
STAR: ultrafast universal RNA-seq aligner
Dobin, A., Davis, C. A., Schlesinger, F., Drenkow, J., Zaleski, C., Jha, S., Batut, P., Chaisson, M., & Gingeras, T. R. (2013) · Bioinformatics · doi:10.1093/bioinformatics/bts635 · Cited by 51,709
HTSeq—a Python framework to work with high-throughput sequencing data
Anders, S., Pyl, P. T., & Huber, W. (2015) · Bioinformatics · doi:10.1093/bioinformatics/btu638 · Cited by 21,464
GSVA: gene set variation analysis for microarray and RNA-Seq data
Hänzelmann, S., Castelo, R., & Guinney, J. (2013) · BMC Bioinformatics · doi:10.1186/1471-2105-14-7 · Cited by 15,440
Analysis of protein-coding genetic variation in 60,706 humans
Exome Aggregation Consortium, Lek, M., Karczewski, K. J., Minikel, E. V., Samocha, K. E., Banks, E., Fennell, T., O’Donnell-Luria, A. H., Ware, J. S., Hill, A. J., et al. (2016) · Nature · doi:10.1038/nature19057 · Cited by 9,587
UniProt: a worldwide hub of protein knowledge
The UniProt Consortium (2019) · Nucleic Acids Research · doi:10.1093/nar/gky1049 · Cited by 7,698
Gut microbiome influences efficacy of PD-1-based immunotherapy against epithelial tumors
Routy, B., Le Chatelier, E., Derosa, L., Duong, C. P. M., Alou, M. T., Daillère, R., Fluckiger, A., Messaoudene, M., Rauber, C., Roberti, M. P., et al. (2018) · Science · doi:10.1126/science.aan3706 · Cited by 5,671
Sensitive detection of somatic point mutations in impure and heterogeneous cancer samples
Cibulskis, K., Lawrence, M. S., Carter, S. L., Sivachenko, A., Jaffe, D. B., Sougnez, C. L., Gabriel, S., Meyerson, M. M., Lander, E. S., & Getz, G. A. (2013) · Nature Biotechnology · doi:10.1038/nbt.2514 · Cited by 4,965
VarScan 2: Somatic mutation and copy number alteration discovery in cancer by exome sequencingPreprint
Koboldt, D. C., Zhang, Q., Larson, D. E., Shen, D., McLellan, M. D., Lin, L., Miller, C. A., Mardis, E. R., Ding, L., & Wilson, R. K. (2012) · Genome Research · doi:10.1101/gr.129684.111 · Cited by 4,954
Gut microbiome modulates response to anti-PD-1 immunotherapy in melanoma patients
Gopalakrishnan, V., Spencer, C. N., Nezi, L., Reuben, A., Andrews, M. C., Karpinets, T. V., Prieto, P. A., Vicente, D., Hoffman, K., Wei, S. C., et al. (2018) · Science · doi:10.1126/science.aan4236 · Cited by 4,812
Self-citationNCBI BLAST: a better web interface
Johnson, M., Zaretskaya, I., Raytselis, Y., Merezhuk, Y., McGinnis, S., & Madden, T. (2008) · Nucleic Acids Research · doi:10.1093/nar/gkn201 · Cited by 4,207
Full-length RNA-seq from single cells using Smart-seq2
Picelli, S., Faridani, O. R., Björklund, Å. K., Winberg, G., Sagasser, S., & Sandberg, R. (2014) · Nature Protocols · doi:10.1038/nprot.2014.006 · Cited by 4,137
Commensal Bifidobacterium promotes antitumor immunity and facilitates anti–PD-L1 efficacy
Sivan, A., Corrales, L., Hubert, N., Williams, J. B., Aquino-Michaels, K., Earley, Z. M., Benyamin, F. W., Man Lei, Y., Jabri, B., Alegre, M.-L., et al. (2015) · Science · doi:10.1126/science.aac4255 · Cited by 3,888
A Gene Encoding an Antigen Recognized by Cytolytic T Lymphocytes on a Human Melanoma
van der Bruggen, P., Traversari, C., Chomez, P., Lurquin, C., Plaen, E. D., den Eynde, B. J. V., Knuth, A. K., & Boon, T. (1991) · Science · doi:10.1126/science.1840703 · Cited by 3,548
Anticancer immunotherapy by CTLA-4 blockade relies on the gut microbiota
Vétizou, M., Pitt, J. M., Daillère, R., Lepage, P., Waldschmitt, N., Flament, C., Rusakiewicz, S., Routy, B., Roberti, M. P., Duong, C. P. M., et al. (2015) · Science · doi:10.1126/science.aad1329 · Cited by 3,488
The commensal microbiome is associated with anti-PD-1 efficacy in metastatic melanoma patients
Matson, V., Fessler, J., Bao, R., Chongsuwat, T., Zha, Y., Alegre, M.-L., Luke, J. J., & Gajewski, T. F. (2018) · Science · doi:10.1126/science.aao3290 · Cited by 3,107
Reynisson, B., Alvarez, B., Paul, S., Peters, B., & Nielsen, M. (2020) · Nucleic Acids Research · doi:10.1093/nar/gkaa379 · Cited by 2,361
An ultrasensitive method for quantitating circulating tumor DNA with broad patient coverage
Newman, A. M., Bratman, S. V., To, J., Wynne, J. F., Eclov, N. C. W., Modlin, L. A., Liu, C. L., Neal, J. W., Wakelee, H. A., Merritt, R. E., et al. (2014) · Nature Medicine · doi:10.1038/nm.3519 · Cited by 2,220
Self-citationGlobal characterization of T cells in non-small-cell lung cancer by single-cell sequencing
Guo, X., Zhang, Y., Zheng, L., Zheng, C., Song, J., Zhang, Q., Kang, B., Liu, Z., Jin, L., Xing, R., et al. (2018) · Nature Medicine · doi:10.1038/s41591-018-0045-3 · Cited by 1,651
Strelka: accurate somatic small-variant calling from sequenced tumor–normal sample pairs
Saunders, C. T., Wong, W. S. W., Swamy, S., Becq, J., Murray, L. J., & Cheetham, R. K. (2012) · Bioinformatics · doi:10.1093/bioinformatics/bts271 · Cited by 1,589
Tumor Microbiome Diversity and Composition Influence Pancreatic Cancer Outcomes
Riquelme, E., Zhang, Y., Zhang, L., Montiel, M., Zoltan, M., Dong, W., Quesada, P., Sahin, I., Chandra, V., San Lucas, A., et al. (2019) · Cell · doi:10.1016/j.cell.2019.07.008 · Cited by 1,577
Jurtz, V. I., Paul, S., Andreatta, M., Marcatili, P., Peters, B., & Nielsen, M. (2017) · The Journal of Immunology · doi:10.4049/jimmunol.1700893 · Cited by 1,476
Bystander CD8+ T cells are abundant and phenotypically distinct in human tumour infiltrates
Simoni, Y., Becht, E., Fehlings, M., Loh, C. Y., Koo, S.-L., Teng, K. W. W., Yeong, J. P. S., Nahar, R., Zhang, T., Kared, H., et al. (2018) · Nature · doi:10.1038/s41586-018-0130-2 · Cited by 1,370
Ohashi, P. S., Oehen, S., Buerki, K., Pircher, H., Ohashi, C. T., Odermatt, B., MALISSEN, B., Zinkernagel, R. M., & Hengartner, H. (1991) · Cell · doi:10.1016/0092-8674(91)90164-t · Cited by 1,175
A p16 INK4a -Insensitive CDK4 Mutant Targeted by Cytolytic T Lymphocytes in a Human Melanoma
Wölfel, T., Hauer, M., Schneider, J., Serrano, M., Wölfel, C., Klehmann, E., Plaen, E. D., Hankeln, T., Büschenfelde, K. M. Z., & Beach, D. (1995) · Science · doi:10.1126/science.7652577 · Cited by 1,171
Kawakami, Y., Eliyahu, S., Delgado, C. H., Robbins, P. F., Rivoltini, L., Topalian, S. L., Miki, T., & Rosenberg, S. A. (1994) · Proceedings of the National Academy of Sciences · doi:10.1073/pnas.91.9.3515 · Cited by 1,093
Identifying specificity groups in the T cell receptor repertoire
Glanville, J., Huang, H., Nau, A., Hatton, O., Wagar, L. E., Rubelt, F., Ji, X., Han, A., Krams, S. M., Pettus, C., et al. (2017) · Nature · doi:10.1038/nature22976 · Cited by 1,026
Self-citationThe Microbiome and the Respiratory Tract
Dickson, R. P., Erb-Downward, J. R., Martinez, F. J., & Huffnagle, G. B. (2016) · Annual Review of Physiology · doi:10.1146/annurev-physiol-021115-105238 · Cited by 953
A Direct Estimate of the Human αβ T Cell Receptor Diversity
Arstila, T. P., Casrouge, A., Baron, V., Even, J., Kanellopoulos, J., & Kourilsky, P. (1999) · Science · doi:10.1126/science.286.5441.958 · Cited by 931
Coulie, P. G., Brichard, V. G., Pel, A. V., Wölfel, T., Schneider, J., Traversari, C., Mattei, S., Plaen, E. D., Lurquin, C., Szikora, J., et al. (1994) · The Journal of Experimental Medicine · doi:10.1084/jem.180.1.35 · Cited by 903
HLA class I supertypes: a revised and updated classification
Sidney, J., Peters, B., Frahm, N., Brander, C., & Sette, A. (2008) · BMC Immunology · doi:10.1186/1471-2172-9-1 · Cited by 775
The toxins of William B. Coley and the treatment of bone and soft-tissue sarcomas.
McCarthy, E. F. (2006) · Europe PMC (PubMed Central) · Cited by 747
Mogilenko, D. A., Shpynov, O., Andhey, P. S., Arthur, L., Swain, A., Esaulova, E., Brioschi, S., Shchukina, I., Kerndl, M., Bambouskova, M., et al. (2021) · Immunity · doi:10.1016/j.immuni.2020.11.005 · Cited by 683
VDJdb: a curated database of T-cell receptor sequences with known antigen specificity
Shugay, M., Bagaev, D. V., Zvyagin, I. V., Vroomans, R. M. A., Crawford, J. C., Dolton, G. M., Komech, E. A., Sycheva, A. L., Koneva, A. E., Egorov, E. S., et al. (2017) · Nucleic Acids Research · doi:10.1093/nar/gkx760 · Cited by 626
Low and variable tumor reactivity of the intratumoral TCR repertoire in human cancers
Scheper, W., Kelderman, S., Fanchi, L. F., Linnemann, C., Bendle, G. M., de Rooij, M. A. J., Hirt, C., Mezzadra, R., Slagter, M., Dijkstra, K. K., et al. (2018) · Nature Medicine · doi:10.1038/s41591-018-0266-5 · Cited by 583
Why must T cells be cross-reactive?
Sewell, A. K. (2012) · Nature reviews. Immunology · doi:10.1038/nri3279 · Cited by 567
Linking T-cell receptor sequence to functional phenotype at the single-cell level
Han, A. S., Glanville, J., Hansmann, L., & Davis, M. M. (2014) · Nature Biotechnology · doi:10.1038/nbt.2938 · Cited by 534
Self-citationEmerson, R. O., DeWitt, W. S., Vignali, M., Gravley, J., Hu, J. K., Osborne, E. J., Desmarais, C., Klinger, M., Carlson, C. S., Hansen, J. A., et al. (2017) · Nature Genetics · doi:10.1038/ng.3822 · Cited by 532
Murray, R. J., Kurilla, M. G., Brooks, J. M., Thomas, W. A., Rowe, M., Kieff, E., & Rickinson, A. B. (1992) · The Journal of Experimental Medicine · doi:10.1084/jem.176.1.157 · Cited by 498
Rehermann, B., Fowler, P., Sidney, J., Person, J. L., Redeker, A. G., Brown, M. E., Moss, B., Sette, A., & Chisari, F. V. (1995) · The Journal of Experimental Medicine · doi:10.1084/jem.181.3.1047 · Cited by 492
Huang, H., Wang, C., Rubelt, F., Scriba, T. J., & Davis, M. M. (2020) · Nature Biotechnology · doi:10.1038/s41587-020-0505-4 · Cited by 484
Self-citationDissecting the mechanisms of immune checkpoint therapy
Sharma, P., & Allison, J. P. (2020) · Nature reviews. Immunology · doi:10.1038/s41577-020-0275-8 · Cited by 436
T cell fate and clonality inference from single-cell transcriptomes
(2016) · doi:10.1038/nmeth.3800 · Cited by 434
Virus-specific CD4(+) memory-phenotype T cells are abundant in unexposed adults
Su, L. F., Kidd, B. A., Han, A., Kotzin, J. J., & Davis, M. M. (2013) · Immunity · doi:10.1016/j.immuni.2012.10.021 · Cited by 429
Self-citationCoulie, P. G., Lehmann, F. F., Lethé, B., Herman, J., Lurquin, C., Andrawiss, M., & Boon, T. (1995) · Proceedings of the National Academy of Sciences · doi:10.1073/pnas.92.17.7976 · Cited by 423
Cross-reactivity between tumor MHC class I–restricted antigens and an enterococcal bacteriophage
Fluckiger, A., Daillère, R., Sassi, M., Sixt, B. S., Liu, P., Loos, F., Richard, C., Rabu, C., Alou, M. T., Goubet, A.-G., et al. (2020) · Science · doi:10.1126/science.aax0701 · Cited by 396
Overlap and Effective Size of the Human CD8 + T Cell Receptor Repertoire
Robins, H. S., Srivastava, S. K., Campregher, P. V., Turtle, C. J., Andriesen, J. G., Riddell, S. R., Carlson, C. S., & Warren, E. H. (2010) · Science Translational Medicine · doi:10.1126/scitranslmed.3001442 · Cited by 383
Anagnostou, V., Forde, P. M., White, J. R., Niknafs, N., Hruban, C., Naidoo, J., Marrone, K. A., Sivakumar, I. K. A., Bruhm, D. C., Rosner, S., et al. (2018) · Cancer Research · doi:10.1158/0008-5472.can-18-1127 · Cited by 322
Sibener, L. V., Fernandes, R. A., Kolawole, E. M., Carbone, C. B., Liu, F., McAffee, D. B., Birnbaum, M. E., Yang, X., Su, L. F., Yu, W., et al. (2018) · Cell · doi:10.1016/j.cell.2018.06.017 · Cited by 320
Self-citationKoziel, M. J., Dudley, D. D., Afdhal, N. H., Grakoui, A., Rice, C. M., Choo, Q. L., Houghton, M., & Walker, B. D. (1995) · Journal of Clinical Investigation · doi:10.1172/jci118287 · Cited by 315
Clonal Deletion Prunes but Does Not Eliminate Self-Specific αβ CD8+ T Lymphocytes
Yu, W., Jiang, N. J., Ebert, P. J. R., Kidd, B. A., Müller, S., Lund, P. J., Juang, J., Adachi, K., Tse, T., Birnbaum, M. E., et al. (2015) · Immunity · doi:10.1016/j.immuni.2015.05.001 · Cited by 314
Self-citationVirus-specific memory T cells populate tumors and can be repurposed for tumor immunotherapy
Rosato, P. C., Wijeyesinghe, S., Stolley, J. M., Nelson, C. E., Davis, R. L., Manlove, L. S., Pennell, C. A., Blazar, B. R., Chen, C. C., Geller, M. A., et al. (2019) · Nature Communications · doi:10.1038/s41467-019-08534-1 · Cited by 304
Antigen Identification for Orphan T Cell Receptors Expressed on Tumor-Infiltrating Lymphocytes
Gee, M. H., Han, A. S., Lofgren, S., Beausang, J. F., Mendoza, J. L., Birnbaum, M. E., Bethune, M. T., Fischer, S., Yang, X., Gomez, R., et al. (2017) · Cell · doi:10.1016/j.cell.2017.11.043 · Cited by 278
Self-citationSingle-cell atlas of colonic CD8+ T cells in ulcerative colitis
Corridoni, D., Antanaviciute, A., Gupta, T., Fawkner-Corbett, D., Aulicino, A., Jagielowicz, M., Parikh, K., Repapi, E., Taylor, S. L., Ishikawa, D., et al. (2020) · Nature Medicine · doi:10.1038/s41591-020-1003-4 · Cited by 257
T-Scan: A Genome-wide Method for the Systematic Discovery of T Cell Epitopes
Kula, T., Dezfulian, M. H., Wang, C. I., Abdelfattah, N. S., Hartman, Z. C., Wucherpfennig, K. W., Lyerly, H. K., & Elledge, S. J. (2019) · Cell · doi:10.1016/j.cell.2019.07.009 · Cited by 250
Self-citationComprehensive T cell repertoire characterization of non-small cell lung cancer
Reuben, A., Zhang, J., Chiou, S.-H., Gittelman, R. M., Li, J., Lee, W.-C., Fujimoto, J., Behrens, C., Liu, X., Wang, F., et al. (2020) · Nature Communications · doi:10.1038/s41467-019-14273-0 · Cited by 220
Self-citationJoshi, K., de Massy, M. R., Ismail, M., Reading, J. L., Uddin, I., Woolston, A., Hatipoglu, E., Oakes, T., Rosenthal, R., Peacock, T., et al. (2019) · Nature Medicine · doi:10.1038/s41591-019-0592-2 · Cited by 214
Newman, J. H., Chesson, C. B., Herzog, N. L., Bommareddy, P. K., Aspromonte, S. M., Pepe, R., Estupinian, R., Aboelatta, M., Buddhadev, S., Tarabichi, S., et al. (2019) · Proceedings of the National Academy of Sciences · doi:10.1073/pnas.1904022116 · Cited by 192
Commensal bacteria stimulate antitumor responses via T cell cross-reactivity
Bessell, C. A., Isser, A., Havel, J. J., Lee, S., Bell, D. R., Hickey, J. W., Chaisawangwong, W., Bieler, J. G., Srivastava, R. M., Kuo, F., et al. (2020) · JCI Insight · doi:10.1172/jci.insight.135597 · Cited by 190
Cameron, S. J. S., Lewis, K. E., Huws, S., Hegarty, M., Lewis, P. D., Pachebat, J. A., & Mur, L. A. J. (2017) · PLoS ONE · doi:10.1371/journal.pone.0177062 · Cited by 180
Infection breaks T-cell tolerance
Röcken, M., Urban, J. F., & Shevach, E. M. (1992) · Nature · doi:10.1038/359079a0 · Cited by 167
Dissection of T-cell Antigen Specificity in Human Melanoma
Andersen, R. S., Thrue, C. A., Junker, N., Lyngaa, R., Donia, M., Ellebæk, E., Svane, I. M., Schumacher, T. N., Straten, P. T., & Hadrup, S. R. (2012) · Cancer Research · doi:10.1158/0008-5472.can-11-2614 · Cited by 158
T cell antigen discovery via trogocytosis
Li, G., Bethune, M. T., Wong, S. K., Joglekar, A. V., Leonard, M. T., Wang, J. K., Kim, J. T., Cheng, D., Peng, S., Zaretsky, J. M., et al. (2019) · Nature Methods · doi:10.1038/s41592-018-0305-7 · Cited by 156
T cell antigen discovery via signaling and antigen-presenting bifunctional receptors
Joglekar, A. V., Leonard, M. T., Jeppson, J. D., Swift, M., Li, G., Wong, S. K., Peng, S., Zaretsky, J. M., Heath, J. R., Ribas, A., et al. (2019) · Nature Methods · doi:10.1038/s41592-018-0304-8 · Cited by 151
Hellmann, M. D., Nabet, B. Y., Rizvi, H. A., Chaudhuri, A. A., Wells, D. K., Dunphy, M. P., Chabon, J. J., Liu, C. L., Hui, A. B., Arbour, K. C., et al. (2020) · Clinical Cancer Research · doi:10.1158/1078-0432.ccr-19-3418 · Cited by 128
Self-citationOakes, T., Heather, J., Best, K., Byng-Maddick, R., Husovsky, C., Ismail, M., Joshi, K., Maxwell, G., Noursadeghi, M., Riddell, N. E., et al. (2017) · Frontiers in Immunology · doi:10.3389/fimmu.2017.01267 · Cited by 119
Song, I., Gil, A., Mishra, R., Ghersi, D., Selin, L. K., & Stern, L. J. (2017) · Nature Structural & Molecular Biology · doi:10.1038/nsmb.3383 · Cited by 101
MHC‐Peptide Tetramers to Visualize Antigen‐Specific T Cells
Altman, J. D., & Davis, M. M. (2016) · Current Protocols in Immunology · doi:10.1002/cpim.14 · Cited by 99
Self-citationRecognition of a Ubiquitous Self Antigen by Prostate Cancer-Infiltrating CD8 + T Lymphocytes
Savage, P. A., Vosseller, K., Kang, C., Larimore, K., Riedel, E., Wojnoonski, K., Jungbluth, A. A., & Allison, J. P. (2008) · Science · doi:10.1126/science.1148886 · Cited by 92
Witwicka, H., Hwang, S., Reyes‐Gutierrez, P., Jia, H., Odgren, P. E., Donahue, L. R., Birnbaum, M. J., & Odgren, P. R. (2015) · PLoS ONE · doi:10.1371/journal.pone.0128275 · Cited by 81
Mechanism of EBV inducing anti-tumour immunity and its therapeutic use
Choi, I., Wang, Z., Ke, Q., Hong, M., Paul, D. W. J., Fernandes, S., Hu, Z., Stevens, J. D., Guleria, I., Kim, H.-J., et al. (2020) · Nature · doi:10.1038/s41586-020-03075-w · Cited by 77
Detection of Epstein-Barr Virus Infection in Non-Small Cell Lung Cancer
Kheir, F. M., Zhao, M., Strong, M. J., Yu, Y., Nanbo, A., Flemington, E. K., Morris, G. F., Krzysztof Reiss, F., Li, L., & Lin, Z. N. (2019) · Cancers · doi:10.3390/cancers11060759 · Cited by 57
MHC‐Peptide Tetramers to Visualize Antigen‐Specific T Cells
Altman, J. D., & Davis, M. M. (2003) · Current Protocols in Immunology · doi:10.1002/0471142735.im1703s53 · Cited by 43
Self-citationClustering HLA Class I Superfamilies Using Structural Interaction Patterns
Harjanto, S., Ng, L. F. P., & Tong, J. C. (2014) · PLoS ONE · doi:10.1371/journal.pone.0086655 · Cited by 26
Cited by
Sorted by citations
Cold and hot tumors: from molecular mechanisms to targeted therapy
Wu, B., Zhang, B., Li, B., Wu, H., & Jiang, M. (2024) · Signal Transduction and Targeted Therapy · doi:10.1038/s41392-024-01979-x · Cited by 811
Turning cold tumors hot: from molecular mechanisms to clinical applications
Zhang, J., Huang, D., Saw, P. E., & Song, E. (2022) · Trends in Immunology · doi:10.1016/j.it.2022.04.010 · Cited by 534
Self-citationCD8+ T cells in the cancer-immunity cycle
Giles, J. R., Globig, A.-M., Kaech, S. M., & Wherry, E. J. (2023) · Immunity · doi:10.1016/j.immuni.2023.09.005 · Cited by 507
Lee, A., Sun, L., Mochizuki, A. Y., Reynoso, J. G., Orpilla, J. R., Chow, F. E., Kienzler, J. C., Everson, R. G., Nathanson, D. A., Bensinger, S. J., et al. (2021) · Nature Communications · doi:10.1038/s41467-021-26940-2 · Cited by 262
Mayer-Blackwell, K., Schattgen, S., Cohen-Lavi, L., Crawford, J. C., Souquette, A. H., Gaevert, J. A., Hertz, T., Thomas, P. G., Bradley, P. H., & Fiore-Gartland, A. (2021) · eLife · doi:10.7554/elife.68605 · Cited by 204
Metadata
- Authors
- Chiou, S.-H., Tseng, D., Reuben, A., Mallajosyula, V., Molina, I. S., Conley, S., Wilhelmy, J., McSween, A. M., Yang, X., Nishimiya, D., Sinha, R., Nabet, B. Y., Wang, C., Shrager, J. B., Berry, M. F., Backhus, L., Lui, N. S., Wakelee, H. A., Neal, J. W., Padda, S. K., Berry, G. J., Delaidelli, A., Sorensen, P. H., Sotillo, E., Tran, P., Benson, J. A., Richards, R., Labanieh, L., Klysz, D. D., Louis, D. M., Feldman, S. A., Diehn, M., Weissman, I. L., Zhang, J., Wistuba, I. I., Futreal, P. A., Heymach, J. V., Garcia, K. C., Mackall, C. L., & Davis, M. M.
- Affiliations
- Stanford University (US)
- Stanford Medicine (US)
- The University of Texas MD Anderson Cancer Center (US)
- Rutgers, The State University of New Jersey (US)
- Institute for Stem Cell Biology and Regenerative Medicine (US)
- BC Cancer Agency (CA)
- Stanford Cancer Institute (US)
- Howard Hughes Medical Institute (US)
- Corresponding author
- Davis, Mark M.
- ORCID
- Chiou, Shin-Heng
- Tseng, Diane
- Reuben, Alexandre
- Mallajosyula, Vamsee
- Molina, Irene S.
- Wilhelmy, Julie
- McSween, Alana M.
- Yang, Xinbo
- Nishimiya, Daisuke
- Sinha, Rahul
- Nabet, Barzin Y.
- Wang, Chunlin
- Shrager, Joseph B.
- Berry, Mark F.
- Backhus, Leah
- Lui, Natalie S.
- Wakelee, Heather A.
- Neal, Joel W.
- Padda, Sukhmani K.
- Berry, Gerald J.
- Delaidelli, Alberto
- Sorensen, Poul H.
- Sotillo, Elena
- Benson, Jalen A.
- Richards, Rebecca
- Labanieh, Louai
- Klysz, Dorota D.
- Louis, David M.
- Feldman, Steven A.
- Diehn, Maximilian
- Weissman, Irving L.
- Zhang, Jianjun
- Wistuba, Ignacio I.
- Futreal, P. Andrew
- Heymach, John V.
- Mackall, Crystal L.
- Davis, Mark M.
- Venue
- Immunity
- Publisher
- Elsevier BV
- Published
- 2021-03
- Volume
- 54
- Issue
- 3
- Pages
- 586-602.e8
- ISSN
- 1074-7613 (ISSN-L)
- PMC
- PMC7960510
- OpenAlex
- W3134245065
- Cited by
- 133
- References
- 77
- Citations by year
- 2026: 20 · 2025: 19 · 2024: 26 · 2023: 28 · 2022: 29 · 2021: 10
- FWCI
- 8.56
- Type
- journal article
- Language
- en
- Open access
- hybrid
- doi.org
- Licence
- Locations
- Immunity (publishedVersion, cc-by-nc-nd)
- PubMed Central (publishedVersion, cc-by-nc-nd)
- PubMed (publishedVersion)
- Rutgers University Community Repository (Rutgers University) (submittedVersion)
- Funders
- NCI Cancer Moonshot
- Stand up to Cancer
- Topics
- Health Sciences › Medicine › Oncology › Cancer Immunotherapy and Biomarkers
- Life Sciences › Immunology and Microbiology › Immunology › T-cell and B-cell Immunology
- Life Sciences › Immunology and Microbiology › Immunology › Immunotherapy and Immune Responses
- Keywords
- non-small cell lung cancer, T cell clones, cross-reactive epitopes, Epstein-Barr virus, Escherichia coli, virus-specific T cells, tumor immunology
- MeSH terms
- Algorithms, Antigens, Neoplasm, Carcinoma, Non-Small-Cell Lung, Cells, Cultured, Cross Reactions, Humans, Lung Neoplasms, Protein Binding, T-Lymphocytes, HLA-A2 Antigen, Receptors, Antigen, T-Cell, alpha-beta, Antigen Presentation, Epitope Mapping, Epitopes, T-Lymphocyte, T-Cell Antigen Receptor Specificity
About these checks
Registry, retraction, Cites and statistics results are computed, not judged, with one exception: a printed reference that no index lists is read once by a model before it counts as a citation error. Claims are extracted by a model and kept only when their quote appears verbatim in the text; each cited source is then checked, with a model’s help, for whether it says what the claim relies on. Those verdicts can be wrong — read the claim’s quote and the cited source before relying on one.
Statistics and arithmetic are recomputed, not judged.
Confidence bands are shown only for fields calibrated on our annotated test set. None is calibrated yet, so no band is shown.
What counts as a claim ›How we measure confidence ›How we check this ›
Are you an author, or do you see a problem with this page? Request a review
