

The DOI matches its Crossref record; 7 of the 7 references it cites were found in a registry or an index.
Brown adipose tissue derived ANGPTL4 controls glucose and lipid metabolism and regulates thermogenesis
Overview
The claims and statistics of this paper haven’t been checked yet.
Run the check — free, no account needed. It reads the open-access text and checks the sources it cites.
Integrity signals
Registry
Cites
Statistics
Figures
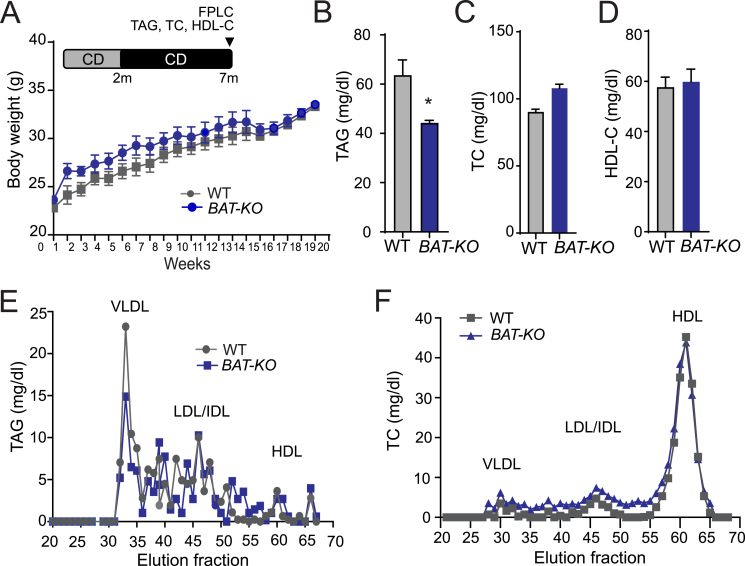
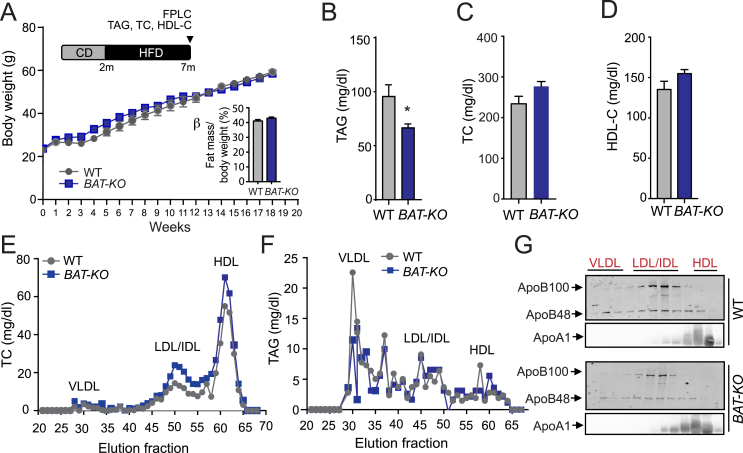
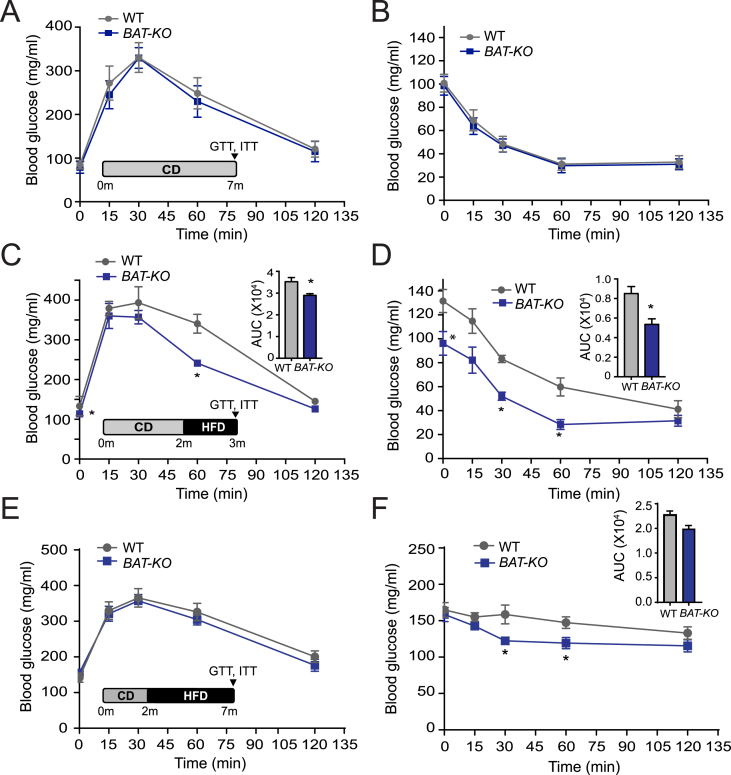
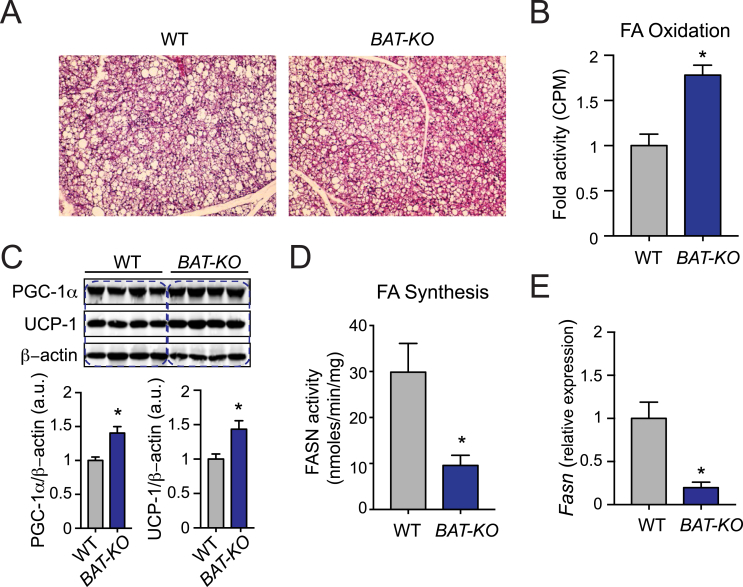
Verification
Claims the paper makes
The claims and statistics of this paper haven’t been checked yet.
Run the check — free, no account needed. It reads the open-access text and checks the sources it cites.
Claims other papers make about this one
Each is checked against this paper’s own text: does it say what the citing paper says it does?
The source backs part of the claim, not all of it — or backs it for a different population, condition or comparison.
In the citing paper
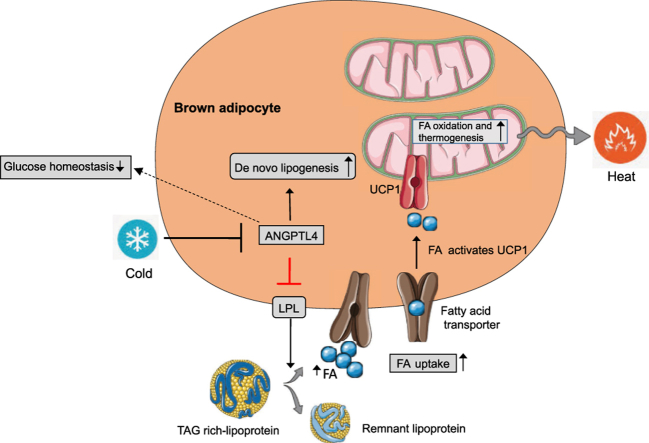
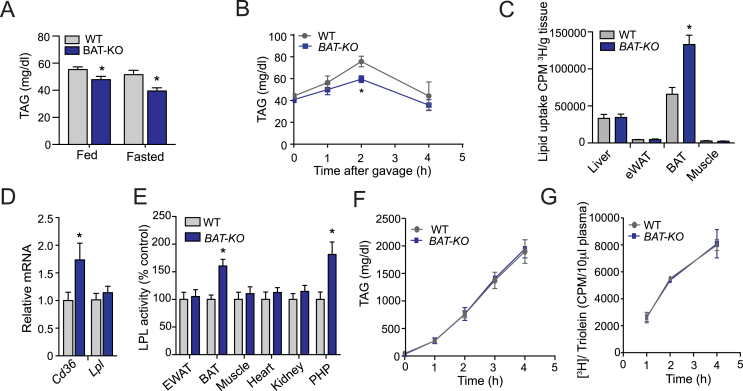
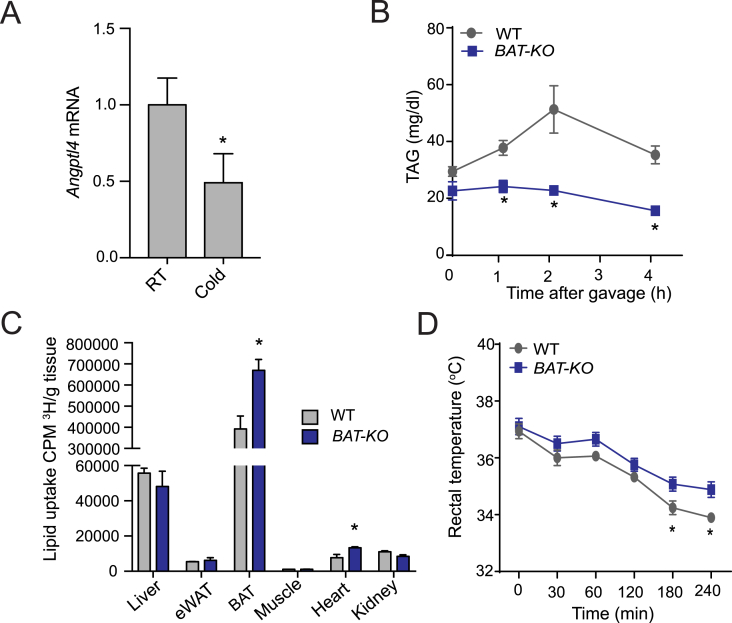
“Consistent with a role for ANGPTL4 in thermogenic triglyceride partitioning, either whole body or BAT-specific deletion of ANGPTL4 resulted in increased LPL activity and triglyceride uptake in BAT (33, 71).”
From Regulation of lipoprotein metabolism by ANGPTL3, ANGPTL4, and ANGPTL8 (2021) · cites this paper as [33]
Experimental — accuracy not yet measuredThe source backs part of the claim, not all of it — or backs it for a different population, condition or comparison.
In the citing paper
“For example, targeting ANGPTL4 could potentially increase adiposity and increase glucose tolerance, as it does in mice (31–33, 84)”
From Regulation of lipoprotein metabolism by ANGPTL3, ANGPTL4, and ANGPTL8 (2021) · cites this paper as [33]
Experimental — accuracy not yet measuredThe cited source says what the claim attributes to it.
In the citing paper
“Angptl4 gene expression decreases in brown adipose tissue in the cold (33, 70, 71).”
From Regulation of lipoprotein metabolism by ANGPTL3, ANGPTL4, and ANGPTL8 (2021) · cites this paper as [33]
In the citing paper
“With prolonged cold exposure, expression of ANGPTL4 decreases in BAT and increases in WAT (33, 70, 71).”
From Regulation of lipoprotein metabolism by ANGPTL3, ANGPTL4, and ANGPTL8 (2021) · cites this paper as [33]
In the citing paper
“Singh et al. (33) found that mice lacking ANGPTL4 specifically in BAT did have slightly higher body temperatures after acute cold exposure, but did not test the effects of prolonged exposure.”
From Regulation of lipoprotein metabolism by ANGPTL3, ANGPTL4, and ANGPTL8 (2021) · cites this paper as [33]
Self-check
Percentages, sums and reported differences re-computed from the paper’s own numbers.
The self-check needs the paper’s full text.
Citations
Cites
Brown Adipose Tissue: Function and Physiological Significance
CANNON, B., & NEDERGAARD, J. (2004) · Physiological Reviews · doi:10.1152/physrev.00015.2003 · Cited by 6,433
Adipokines in inflammation and metabolic disease
Ouchi, N., Parker, J. L., Lugus, J. J., & Walsh, K. (2011) · Nature Reviews Immunology · doi:10.1038/nri2921 · Cited by 4,625
Brown adipose tissue activity controls triglyceride clearance
Bartelt, A., Bruns, O. T., Reimer, R., Hohenberg, H., Ittrich, H., Peldschus, K., Kaul, M. G., Tromsdorf, U. I., Weller, H., Waurisch, C., et al. (2011) · Nature Medicine · doi:10.1038/nm.2297 · Cited by 1,608
A role for brown adipose tissue in diet-induced thermogenesis
Rothwell, N. J., & Stock, M. J. (1979) · Nature · doi:10.1038/281031a0 · Cited by 1,606
Brown adipose tissue regulates glucose homeostasis and insulin sensitivity
Stanford, K. I., Middelbeek, R. J. W., Townsend, K. L., An, D., Nygaard, E. B., Hitchcox, K. M., Markan, K. R., Nakano, K., Hirshman, M. F., Tseng, Y.-H., et al. (2013) · Journal of Clinical Investigation · doi:10.1172/jci62308 · Cited by 1,180
Köster, A., Chao, Y. B., Mosior, M., Ford, A., Gonzalez-DeWhitt, P. A., Hale, J. E., Li, D., Qiu, Y., Fraser, C. C., Yang, D. D., et al. (2005) · Endocrinology · doi:10.1210/en.2005-0476 · Cited by 427
ApoC-III inhibits clearance of triglyceride-rich lipoproteins through LDL family receptors
Gordts, P. L. S. M., Nock, R., Son, N.-H., Ramms, B., Lew, I., Gonzales, J. C., Thacker, B. E., Basu, D., Lee, R. G., Mullick, A. E., et al. (2016) · Journal of Clinical Investigation · doi:10.1172/jci86610 · Cited by 274 · cited 3×
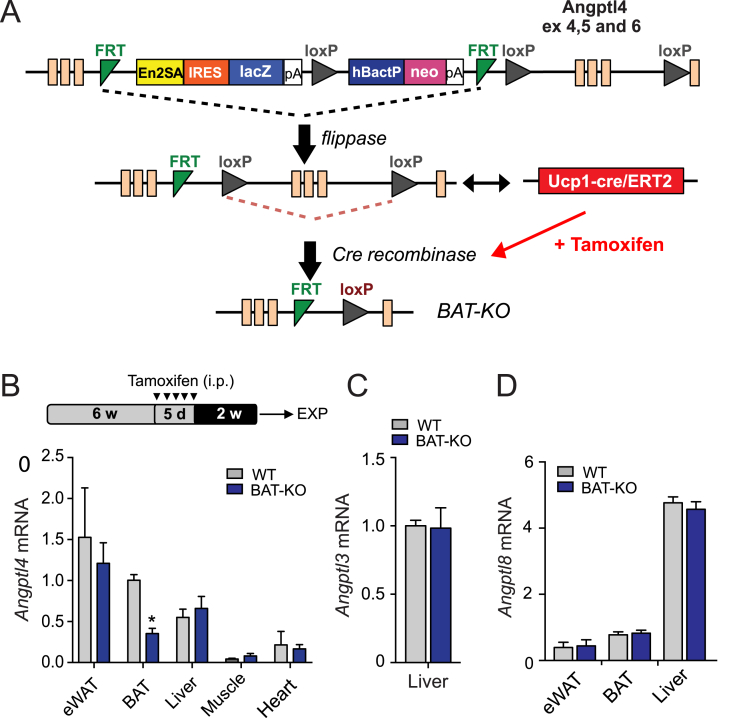
“(ETH Zurich) to yield offspring inheriting both the targeted allele and the UCP1-ER-Cre transgene (Angptl4loxP/loxPUCP1CRE/ERT2) generation of UCP1-ERCre mice is described in previous publication [28].”
BackgroundMethodInfluential
Research works printed but not linked: 41
- Waki, 2007, Endocrine functions of adipose tissue, Annual Review of Pathology Mechanisms of Disease, 2, 31, 10.1146/annurev.pathol.2.010506.091859 · DOI
- Friedman, 2016, The long road to leptin, Journal of Clinical Investigation, 126, 4727, 10.1172/JCI91578 · DOI
- Kusminski, 2016, Targeting adipose tissue in the treatment of obesity-associated diabetes, Nature Reviews Drug Discovery, 15, 639, 10.1038/nrd.2016.75 · DOI · Paper page
- Bremer, 2013, Adipose tissue dysfunction in nascent metabolic syndrome, Journal of Obestics, 2013, 393192
- Bluher, 2009, Adipose tissue dysfunction in obesity, Experimental and Clinical Endocrinology & Diabetes, 117, 241, 10.1055/s-0029-1192044 · DOI
- Cannon, 2017, What ignites UCP1?, Cell Metabolism, 26, 697, 10.1016/j.cmet.2017.10.012 · DOI
- Stern, 2015, Adipose tissue biology in 2014: advances in our understanding of adipose tissue homeostasis, Nature Reviews Endocrinology, 11, 71, 10.1038/nrendo.2014.219 · DOI
- Villarroya, 2017, Brown adipose tissue as a secretory organ, Nature Reviews Endocrinology, 13, 26, 10.1038/nrendo.2016.136 · DOI
- Fedorenko, 2012, Mechanism of fatty-acid-dependent UCP1 uncoupling in brown fat mitochondria, Cell, 151, 400, 10.1016/j.cell.2012.09.010 · DOI · Paper page
- Goldberg, 2009, Regulation of fatty acid uptake into tissues: lipoprotein lipase- and CD36-mediated pathways, The Journal of Lipid Research, 50
- Merkel, 2002, Lipoprotein lipase: genetics, lipid uptake, and regulation, The Journal of Lipid Research, 43, 1997, 10.1194/jlr.R200015-JLR200 · DOI
- Kersten, 2014, Physiological regulation of lipoprotein lipase, Biochimica et Biophysica Acta, 1841, 919, 10.1016/j.bbalip.2014.03.013 · DOI
- Unal, 2008, Translational regulation of lipoprotein lipase in adipocytes: depletion of cellular protein kinase Calpha activates binding of the C subunit of protein kinase A to the 3'-untranslated region of the lipoprotein lipase mRNA, Biochemical Journal, 413, 315, 10.1042/BJ20071559 · DOI
- Kersten, 2000, Characterization of the fasting-induced adipose factor FIAF, a novel peroxisome proliferator-activated receptor target gene, Journal of Biological Chemistry, 275, 28488, 10.1074/jbc.M004029200 · DOI · Paper page
- Zhu, 2012, Angiopoietin-like 4: a decade of research, Bioscience Reports, 32, 211, 10.1042/BSR20110102 · DOI
- Sukonina, 2006, Angiopoietin-like protein 4 converts lipoprotein lipase to inactive monomers and modulates lipase activity in adipose tissue, Proceedings of the National Academy of Sciences of the U S A, 103, 17450, 10.1073/pnas.0604026103 · DOI · Paper page
- Zhang, 2016, The ANGPTL3-4-8 model, a molecular mechanism for triglyceride trafficking, Open Biology, 6, 150272, 10.1098/rsob.150272 · DOI
- Mandard, 2006, The fasting-induced adipose factor/angiopoietin-like protein 4 is physically associated with lipoproteins and governs plasma lipid levels and adiposity, Journal of Biological Chemistry, 281, 934, 10.1074/jbc.M506519200 · DOI · Paper page
- Georgiadi, 2013, Overexpression of angiopoietin-like protein 4 protects against atherosclerosis development, Arteriosclerosis Thrombosis and Vascular Biology, 33, 1529, 10.1161/ATVBAHA.113.301698 · DOI · Paper page
- Aryal, 2016, ANGPTL4 deficiency in haematopoietic cells promotes monocyte expansion and atherosclerosis progression, Nature Communications, 7, 12313, 10.1038/ncomms12313 · DOI · Paper page
- Dijk, 2014, Regulation of lipoprotein lipase by Angptl4, Trends in Endocrinology and Metabolism, 25, 146, 10.1016/j.tem.2013.12.005 · DOI
- Desai, 2007, Lipid-lowering effects of anti-angiopoietin-like 4 antibody recapitulate the lipid phenotype found in angiopoietin-like 4 knockout mice, Proceedings of the National Academy of Sciences of the U S A, 104, 11766, 10.1073/pnas.0705041104 · DOI · Paper page
- Kotas, 2013, Role of caspase-1 in regulation of triglyceride metabolism, Proceedings of the National Academy of Sciences of the U S A, 110, 4810, 10.1073/pnas.1301996110 · DOI
- Camporez, 2015, ApoA5 knockdown improves whole-body insulin sensitivity in high-fat-fed mice by reducing ectopic lipid content, The Journal of Lipid Research, 56, 526, 10.1194/jlr.M054080 · DOI
- Iqbal, 2013, Lipid absorption defects in intestine-specific microsomal triglyceride transfer protein and ATP-binding cassette transporter A1-deficient mice, Journal of Biological Chemistry, 288, 30432, 10.1074/jbc.M113.501247 · DOI
- Huynh, 2014, Measurement of fatty acid oxidation rates in animal tissues and cell lines, Methods Enzymology, 542, 391, 10.1016/B978-0-12-416618-9.00020-0 · DOI
- Bays, 2009, A simplified scintillation proximity assay for fatty acid synthase activity: development and comparison with other FAS activity assays, Journal of Biomolecular Screening, 14, 636, 10.1177/1087057109335746 · DOI
- Haller, 2017, ANGPTL8 requires ANGPTL3 to inhibit lipoprotein lipase and plasma triglyceride clearance, The Journal of Lipid Research, 58, 1166, 10.1194/jlr.M075689 · DOI · Paper page
- Nakajima, 2011, Postprandial lipoprotein metabolism: VLDL vs chylomicrons, Clinica Chimica Acta, 412, 1306, 10.1016/j.cca.2011.04.018 · DOI
- Cedikova, 2016, Mitochondria in white, brown, and beige adipocytes, Stem Cells International, 2016, 10.1155/2016/6067349 · DOI
- Festuccia, 2011, Control of brown adipose tissue glucose and lipid metabolism by PPARgamma, Frontiers in Endocrinology, 2, 84, 10.3389/fendo.2011.00084 · DOI
- McKee, 1990, Brown adipose tissue lipid is the main source of energy during arousal of the golden hamster (Mesocricetus auratus), Comparative Biochemistry and Physiology A Comparative Physiology, 96, 485, 10.1016/0300-9629(90)90666-G · DOI
- Cannon, 2010, Metabolic consequences of the presence or absence of the thermogenic capacity of brown adipose tissue in mice (and probably in humans), International Journal of Obesity (London), 34, S7, 10.1038/ijo.2010.177 · DOI
- Thoonen, 2016, Brown adipose tissue: the heat is on the heart, American Journal of Physiology Heart and Circulatory Physiology, 310, H1592, 10.1152/ajpheart.00698.2015 · DOI
- Blondin, 2017, Dietary fatty acid metabolism of brown adipose tissue in cold-acclimated men, Nature Communications, 8, 14146, 10.1038/ncomms14146 · DOI
- Dijk, 2015, ANGPTL4 mediates shuttling of lipid fuel to brown adipose tissue during sustained cold exposure, Elife, 4, 10.7554/eLife.08428 · DOI · Paper page
- Townsend, 2014, Brown fat fuel utilization and thermogenesis, Trends in Endocrinology and Metabolism, 25, 168, 10.1016/j.tem.2013.12.004 · DOI
- Winn, 2017, Loss of UCP1 exacerbates Western diet-induced glycemic dysregulation independent of changes in body weight in female mice, American Journal of Physiology Regulatory Integrative and Comparative Physiology, 312, R74, 10.1152/ajpregu.00425.2016 · DOI
- Xu, 2005, Angiopoietin-like protein 4 decreases blood glucose and improves glucose tolerance but induces hyperlipidemia and hepatic steatosis in mice, Proceedings of the National Academy of Sciences of the U S A, 102, 6086, 10.1073/pnas.0408452102 · DOI · Paper page
- Chen, 2017, The glucocorticoid-Angptl4-ceramide axis induces insulin resistance through PP2A and PKCzeta, Science Signaling, 10, 10.1126/scisignal.aai7905 · DOI
- Lichtenstein, 2010, Angptl4 protects against severe proinflammatory effects of saturated fat by inhibiting fatty acid uptake into mesenteric lymph node macrophages, Cell Metabolism, 12, 580, 10.1016/j.cmet.2010.11.002 · DOI · Paper page
Cited by
Sorted by citations
The Liver as an Endocrine Organ—Linking NAFLD and Insulin Resistance
Watt, M. J., Miotto, P. M., De Nardo, W., & Montgomery, M. K. (2019) · Endocrine Reviews · doi:10.1210/er.2019-00034 · Cited by 615
Lipoprotein lipase and its regulators: an unfolding story
Wu, S. A., Kersten, S., & Qi, L. (2021) · Trends in Endocrinology & Metabolism · doi:10.1016/j.tem.2020.11.005 · Cited by 225
Regulation of lipoprotein metabolism by ANGPTL3, ANGPTL4, and ANGPTL8
Sylvers-Davie, K. L., & Davies, B. S. J. (2021) · American Journal of Physiology-Endocrinology and Metabolism · doi:10.1152/ajpendo.00195.2021 · Cited by 154
Singh, A. K., Chaube, B., Zhang, X., Sun, J., Citrin, K. M., Canfrán-Duque, A., Aryal, B., Rotllan, N., Varela, L., Lee, R. G., et al. (2021) · Journal of Clinical Investigation · doi:10.1172/jci140989 · Cited by 115
Self-citation
Metadata
- Authors
- Singh, A. K., Aryal, B., Chaube, B., Rotllan, N., Varela, L., Horvath, T. L., Suárez, Y., & Fernández-Hernando, C.
- ORCID
- Rotllan, Noemi
- Venue
- Molecular Metabolism
- Publisher
- Elsevier BV
- Published
- 2018-05
- Volume
- 11
- Pages
- 59-69
- ISSN
- 2212-8778
- PMC
- PMC6001401
- Cited by
- 110
- References
- 7
- Language
- en
- Licence
- Funders
- National Institutes of Health (R01HL135012, R35HL135820, R01HL105945)
- American Heart Association (16EIA27550005, 17SDG33110002, 16GRNT26420047)
About these checks
Registry, retraction, Cites and statistics results are computed, not judged, with one exception: a printed reference that no index lists is read once by a model before it counts as a citation error. Claims are extracted by a model and kept only when their quote appears verbatim in the text; each cited source is then checked, with a model’s help, for whether it says what the claim relies on. Those verdicts can be wrong — read the claim’s quote and the cited source before relying on one.
Statistics and arithmetic are recomputed, not judged.
Confidence bands are shown only for fields calibrated on our annotated test set. None is calibrated yet, so no band is shown.
What counts as a claim ›How we measure confidence ›How we check this ›
Are you an author, or do you see a problem with this page? Request a review
