

The DOI matches its Crossref record; 37 of the 37 references it cites were found in a registry or an index.
Subliminal Instrumental Conditioning Demonstrated in the Human Brain
Open accessAbstract
How the brain uses success and failure to optimize future decisions is a long-standing question in neuroscience. One computational solution involves updating the values of context-action associations in proportion to a reward prediction error. Previous evidence suggests that such computations are expressed in the striatum and, as they are cognitively impenetrable, represent an unconscious learning mechanism. Here, we formally test this by studying instrumental conditioning in a situation where we masked contextual cues, such that they were not consciously perceived. Behavioral data showed that subjects nonetheless developed a significant propensity to choose cues associated with monetary rewards relative to punishments. Functional neuroimaging revealed that during conditioning cue values and prediction errors, generated from a computational model, both correlated with activity in ventral striatum. We conclude that, even without conscious processing of contextual cues, our brain can learn their reward value and use them to provide a bias on decision making.
Overview
The claims and statistics of this paper haven’t been checked yet.
Run the check — free, no account needed. It reads the open-access text and checks the sources it cites.
Integrity signals
Registry
Cites
Statistics
Figures
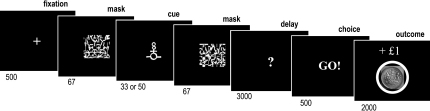
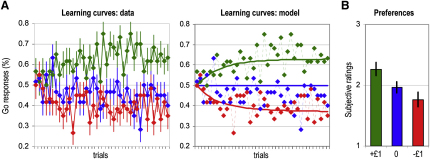
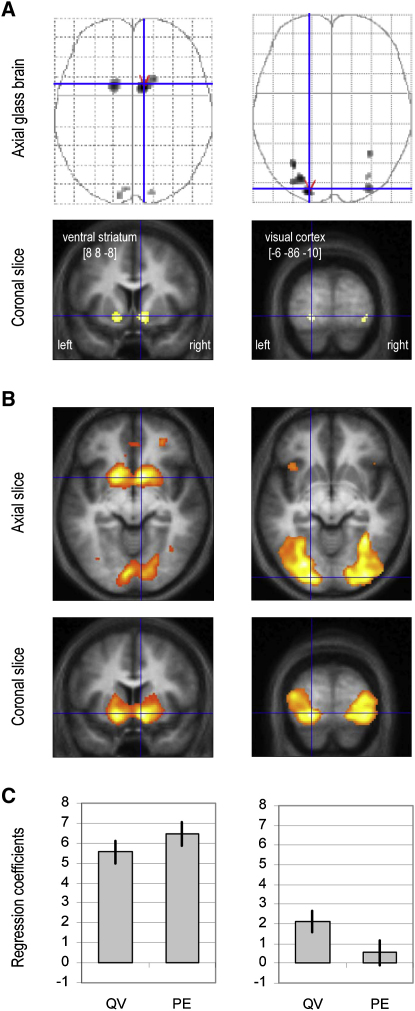
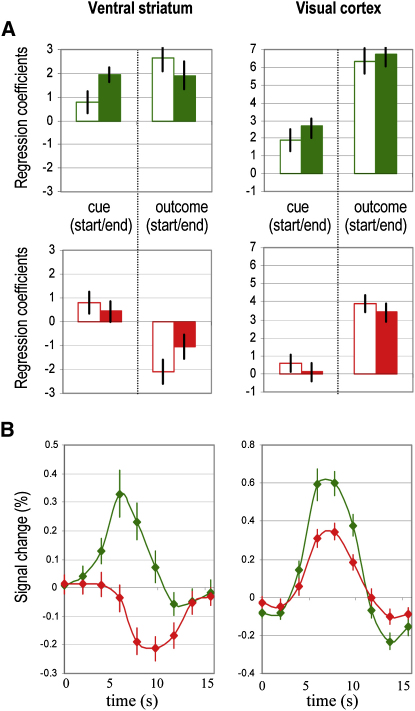
Verification
Claims the paper makes
The claims and statistics of this paper haven’t been checked yet.
Run the check — free, no account needed. It reads the open-access text and checks the sources it cites.
Claims other papers make about this one
Each is checked against this paper’s own text: does it say what the citing paper says it does?
The source backs part of the claim, not all of it — or backs it for a different population, condition or comparison.
In the citing paper
“Remarkably, in humans, such learning appears to proceed even when the cues, reward, or motivation signals are presented below the consciousness threshold ( 17 , 18 ).”
From What is consciousness, and could machines have it? (2017) · cites this paper as [17]
Experimental — accuracy not yet measured
Self-check
Percentages, sums and reported differences re-computed from the paper’s own numbers.
The self-check needs the paper’s full text.
Citations
Cites
Memory and the hippocampus: A synthesis from findings with rats, monkeys, and humans.
Squire, L. R. (1992) · Psychological Review · doi:10.1037/0033-295x.99.2.195 · Cited by 5,376
Barto, A. (1998) · IFAC Proceedings Volumes · doi:10.1016/s1474-6670(17)38315-5 · Cited by 2,172
Dissociable Roles of Ventral and Dorsal Striatum in Instrumental Conditioning
O'Doherty, J., Dayan, P., Schultz, J., Deichmann, R., Friston, K., & Dolan, R. J. (2004) · Science · doi:10.1126/science.1094285 · Cited by 2,088
Self-citationZhang, B., Li, C., & Lin, N. (2020) · De Gruyter eBooks · doi:10.1515/9783110595567-011 · Cited by 1,948
Learning and Memory Functions of the Basal Ganglia
Packard, M. G., & Knowlton, B. J. (2002) · Annual Review of Neuroscience · doi:10.1146/annurev.neuro.25.112701.142937 · Cited by 1,717
Conscious and unconscious emotional learning in the human amygdala
Morris, J. S., Öhman, A., & Dolan, R. J. (1998) · Nature · doi:10.1038/30976 · Cited by 1,665 · cited 1×
“However, subliminal conditioning studies in humans have so far been restricted to Pavlovian paradigms such as fear conditioning (Clark and Squire, 1998; Knight et al., 2003; Morris et al., 1998; Olsson and Phelps, 2004), where subliminal stimuli (like unseen faces) are paired with unpleasant events (like white noise)…”
BackgroundSelf-citationDopamine-dependent prediction errors underpin reward-seeking behaviour in humans
Pessiglione, M., Seymour, B., Flandin, G., Dolan, R. J., & Frith, C. D. (2006) · Nature · doi:10.1038/nature05051 · Cited by 1,584
Self-citationCognitive Neuroscience and the Study of Memory
Milner, B. A., Squire, L. R., & Kandel, E. R. (1998) · Neuron · doi:10.1016/s0896-6273(00)80987-3 · Cited by 1,335
Classical conditioning and brain systems: the role of awareness
Clark, R. E., & Squire, L. R. (1998) · Science · doi:10.1126/science.280.5360.77 · Cited by 1,138
Animal intelligence; experimental studies
Thorndike, E. L. (1911) · doi:10.5962/bhl.title.55072 · Cited by 1,100
Competition among multiple memory systems: converging evidence from animal and human brain studies
Poldrack, R. A., & Packard, M. G. (2003) · Neuropsychologia · doi:10.1016/s0028-3932(02)00157-4 · Cited by 880
Animal Intelligence. Experimental Studies
Thorndike, E. L., & Jelliffe (1912) · The Journal of Nervous and Mental Disease · doi:10.1097/00005053-191205000-00016 · Cited by 824
Optimized EPI for fMRI studies of the orbitofrontal cortex
Deichmann, R., Gottfried, J. A., Hutton, C., & Turner, R. (2003) · NeuroImage · doi:10.1016/s1053-8119(03)00073-9 · Cited by 821
Parallel neural networks for learning sequential procedures
Hikosaka, O., Nakahara, H., Rand, M. K., Sakai, K., Lu, X., Nakamura, K., Miyachi, S., & Doya, K. (1999) · Trends in Neurosciences · doi:10.1016/s0166-2236(99)01439-3 · Cited by 799
Reward‐Related Responses in the Human Striatum
DELGADO, M. R. (2007) · Annals of the New York Academy of Sciences · doi:10.1196/annals.1390.002 · Cited by 736
Functional magnetic resonance imaging of reward prediction
Knutson, B., & Cooper, J. C. (2005) · Current Opinion in Neurology · doi:10.1097/01.wco.0000173463.24758.f6 · Cited by 736
The role of awareness in Pavlovian conditioning: Empirical evidence and theoretical implications.
Lovibond, P. F., & Shanks, D. R. (2002) · Journal of Experimental Psychology Animal Behavior Processes · doi:10.1037/0097-7403.28.1.3 · Cited by 725
The basal ganglia: learning new tricks and loving it
Graybiel, A. M. (2005) · Current Opinion in Neurobiology · doi:10.1016/j.conb.2005.10.006 · Cited by 678
Yacubian, J., Gläscher, J., Schroeder, K., Sommer, T., Braus, D. F., & Büchel, C. (2006) · The Journal of Neuroscience · doi:10.1523/jneurosci.2915-06.2006 · Cited by 537
Can sequence learning be implicit? New evidence with the process dissociation procedure
Destrebecqz, A., & Cleeremans, A. (2001) · Psychonomic Bulletin & Review · doi:10.3758/bf03196171 · Cited by 537
Model‐Based fMRI and Its Application to Reward Learning and Decision Making
O’Doherty, J. P., Hampton, A. N., & Kim, H. (2007) · Annals of the New York Academy of Sciences · doi:10.1196/annals.1390.022 · Cited by 525
The computational neurobiology of learning and reward
Daw, N. D., & Doya, K. (2006) · Current Opinion in Neurobiology · doi:10.1016/j.conb.2006.03.006 · Cited by 492
The neural substrates of reward processing in humans: the modern role of FMRI
McClure, S. M., York, M. K., & Montague, P. R. (2004) · The Neuroscientist · doi:10.1177/1073858404263526 · Cited by 480 · cited 2×
“Computational Model We used a standard Q-learning algorithm (Sutton and Barto, 1998), which has been shown previously to offer a good account of instrumental choice in both humans and monkeys (Daw and Doya, 2006; McClure et al., 2004; O’Doherty et al., 2007).”
BackgroundMethodActivity in human ventral striatum locked to errors of reward prediction
Pagnoni, G., Zink, C. F., Montague, P. R., & Berns, G. S. (2002) · Nature Neuroscience · doi:10.1038/nn802 · Cited by 451
Hedonic Hot Spots in the Brain
Peciña, S., Smith, K. S., & Berridge, K. C. (2006) · The Neuroscientist · doi:10.1177/1073858406293154 · Cited by 441
Brain Regions Responsive to Novelty in the Absence of Awareness
Berns, G. S., Cohen, J. D., & Mintun, M. A. (1997) · Science · doi:10.1126/science.276.5316.1272 · Cited by 367
Learned Fear of “Unseen” Faces after Pavlovian, Observational, and Instructed Fear
Olsson, A., & Phelps, E. A. (2004) · Psychological Science · doi:10.1111/j.0956-7976.2004.00762.x · Cited by 348
Is subliminal learning really passive?
Seitz, A. R., & Watanabe, T. (2003) · Nature · doi:10.1038/422036a · Cited by 300
(1999) · Kybernetes · doi:10.1108/k.1999.28.5.70.1 · Cited by 291
Monetary Incentives Enhance Processing in Brain Regions Mediating Top-down Control of Attention
Small, D. M., Gitelman, D., Simmons, K., Bloise, S. M., Parrish, T., & Mesulam, M.-M. (2005) · Cerebral Cortex · doi:10.1093/cercor/bhi063 · Cited by 242
Robust habit learning in the absence of awareness and independent of the medial temporal lobe
Bayley, P. J., Frascino, J. C., & Squire, L. R. (2005) · Nature · doi:10.1038/nature03857 · Cited by 176
Intentional Control and Implicit Sequence Learning.
Wilkinson, L., & Shanks, D. R. (2004) · Journal of Experimental Psychology Learning Memory and Cognition · doi:10.1037/0278-7393.30.2.354 · Cited by 169
Krawczyk, D. C., Gazzaley, A., & D'Esposito, M. (2007) · Brain Research · doi:10.1016/j.brainres.2007.01.052 · Cited by 156
Different Memory Systems Underlying Acquisition of Procedural and Declarative Knowledgea
Cohen, N. J., Eichenbaum, H., DEACEDO, B. S., & Corkin, S. (1985) · Annals of the New York Academy of Sciences · doi:10.1111/j.1749-6632.1985.tb37579.x · Cited by 154
Insight and strategy in multiple-cue learning.
Lagnado, D. A., Newell, B. R., Kahan, S., & Shanks, D. R. (2006) · Journal of Experimental Psychology General · doi:10.1037/0096-3445.135.2.162 · Cited by 141
Expression of conditional fear with and without awareness
Knight, D. C., Nguyen, H. T., & Bandettini, P. A. (2003) · Proceedings of the National Academy of Sciences · doi:10.1073/pnas.2535780100 · Cited by 117
Instructed Delay Activity in the Human Prefrontal Cortex is Modulated by Monetary Reward Expectation
Ramnani, N. (2003) · Cerebral Cortex · doi:10.1093/cercor/13.3.318 · Cited by 92
Cited by
Sorted by citations
Closed-loop brain training: the science of neurofeedback
Sitaram, R., Ros, T., Stoeckel, L., Haller, S., Scharnowski, F., Lewis-Peacock, J., Weiskopf, N., Blefari, M. L., Rana, M., Oblak, E., et al. (2017) · Nature Reviews Neuroscience · doi:10.1038/nrn.2016.164 · Cited by 1,306
Liu, X., Hairston, J., Schrier, M., & Fan, J. (2011) · Neuroscience & Biobehavioral Reviews · doi:10.1016/j.neubiorev.2010.12.012 · Cited by 916
Empirical support for higher-order theories of conscious awareness
Lau, H., & Rosenthal, D. (2011) · Trends in Cognitive Sciences · doi:10.1016/j.tics.2011.05.009 · Cited by 869
What is consciousness, and could machines have it?
Dehaene, S., Lau, H., & Kouider, S. (2017) · Science · doi:10.1126/science.aan8871 · Cited by 855
The propositional nature of human associative learning
Mitchell, C. J., Houwer, J. D., & Lovibond, P. F. (2009) · Behavioral and Brain Sciences · doi:10.1017/s0140525x09000855 · Cited by 789
Metadata
- Authors
- Pessiglione, M., Petrovic, P., Daunizeau, J., Palminteri, S., Dolan, R. J., & Frith, C. D.
- Affiliations
- Inserm (FR)
- Wellcome Centre for Human Neuroimaging (GB)
- Corresponding author
- Pessiglione, Mathias
- Venue
- Neuron
- Publisher
- Elsevier BV
- Published
- 2008-08
- Volume
- 59
- Issue
- 4
- Pages
- 561-567
- ISSN
- 0896-6273 (ISSN-L)
- PMC
- PMC2572733
- OpenAlex
- W2123851461
- Cited by
- 308
- References
- 37
- Citations by year
- 2026: 11 · 2025: 9 · 2024: 5 · 2023: 12 · 2022: 15 · 2021: 11 · 2020: 38 · 2019: 15 · 2018: 24 · 2017: 19 · 2016: 16 · 2015: 19 · 2014: 29 · 2013: 13 · 2012: 19
- FWCI
- 8.96
- Type
- journal article
- Language
- en
- Open access
- hybrid
- doi.org
- Licence
- Locations
- Neuron (publishedVersion, cc-by)
- PubMed Central (publishedVersion, cc-by)
- PubMed (publishedVersion)
- UCL Discovery (University College London) (submittedVersion)
- Max Planck Digital Library (submittedVersion, other-oa)
- MPG.PuRe (Max Planck Society) (submittedVersion, other-oa)
- Funders
- Wellcome Trust
- Topics
- Life Sciences › Neuroscience › Cognitive Neuroscience › Neural and Behavioral Psychology Studies
- Life Sciences › Neuroscience › Cellular and Molecular Neuroscience › Neurotransmitter Receptor Influence on Behavior
- Life Sciences › Neuroscience › Cognitive Neuroscience › Memory and Neural Mechanisms
- Keywords
- subliminal learning, operant conditioning, reward prediction error, ventral striatum, unconscious learning, decision-making, punishment, computational model
- MeSH terms
- Adult, Association Learning, Attention, Awareness, Brain Mapping, Choice Behavior, Conditioning, Operant, Consciousness, Decision Making, Discrimination, Psychological, Female, Humans, Magnetic Resonance Imaging, Male, Perceptual Masking, Reference Values, Subliminal Stimulation, Visual Cortex, Neostriatum, Intuition
About these checks
Registry, retraction, Cites and statistics results are computed, not judged, with one exception: a printed reference that no index lists is read once by a model before it counts as a citation error. Claims are extracted by a model and kept only when their quote appears verbatim in the text; each cited source is then checked, with a model’s help, for whether it says what the claim relies on. Those verdicts can be wrong — read the claim’s quote and the cited source before relying on one.
Statistics and arithmetic are recomputed, not judged.
Confidence bands are shown only for fields calibrated on our annotated test set. None is calibrated yet, so no band is shown.
What counts as a claim ›How we measure confidence ›How we check this ›
Are you an author, or do you see a problem with this page? Request a review
