

The DOI matches its Crossref record; 79 of the 80 references it cites were found in a registry or an index.
Short-Term Plasticity at Hippocampal Mossy Fiber Synapses Is Induced by Natural Activity Patterns and Associated with Vesicle Pool Engram Formation
Open accessAbstract
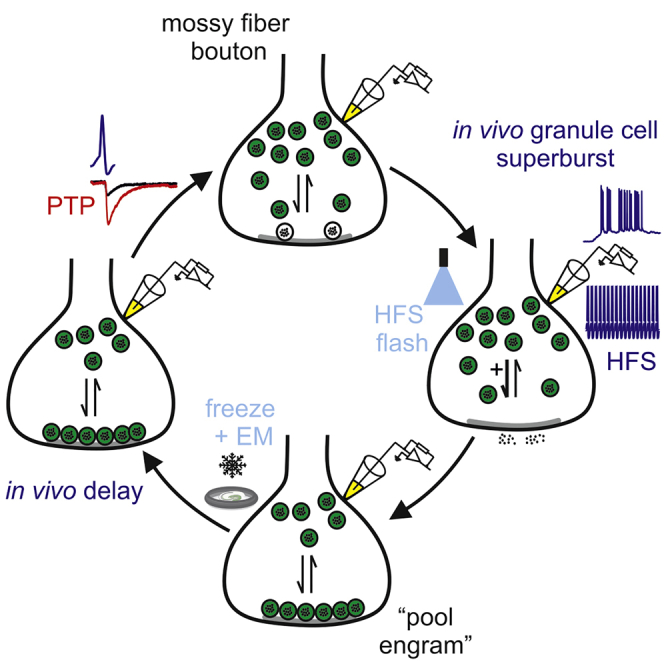
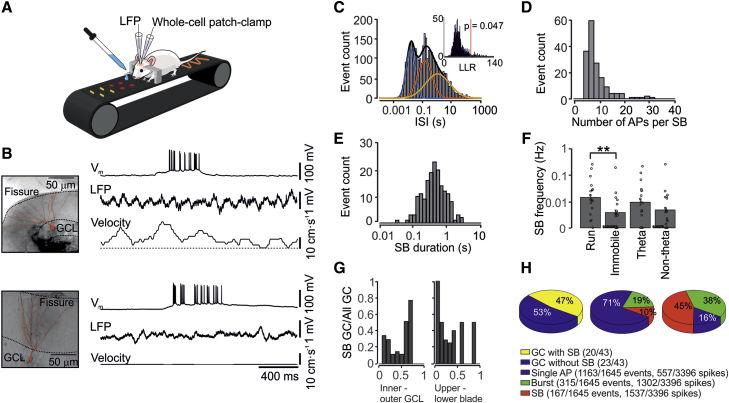
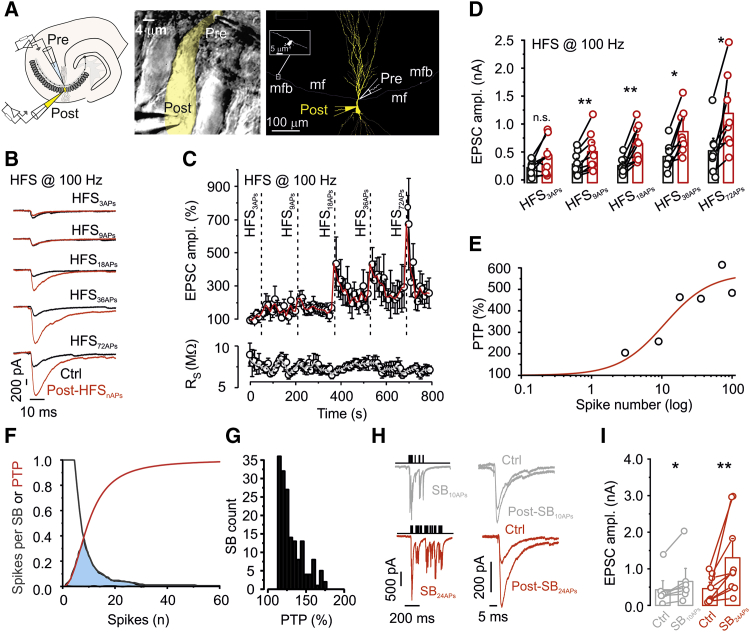
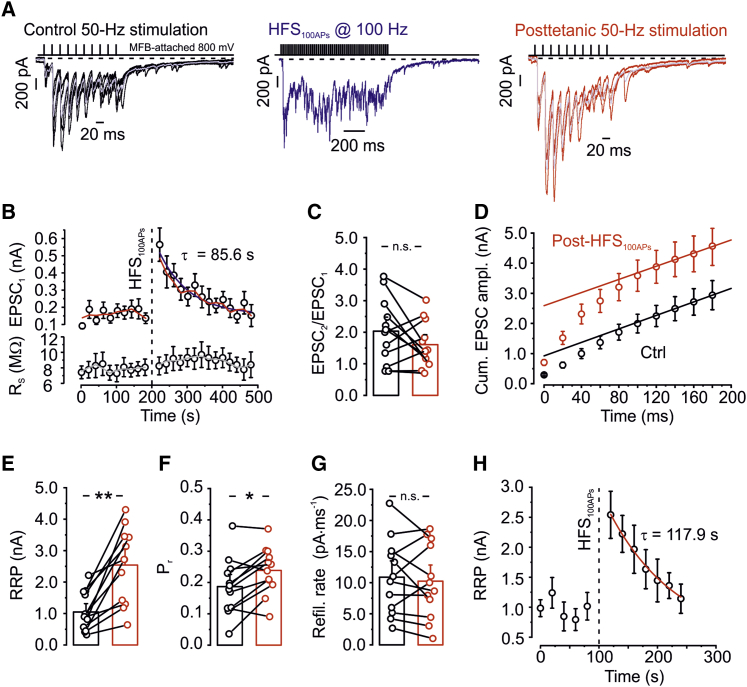
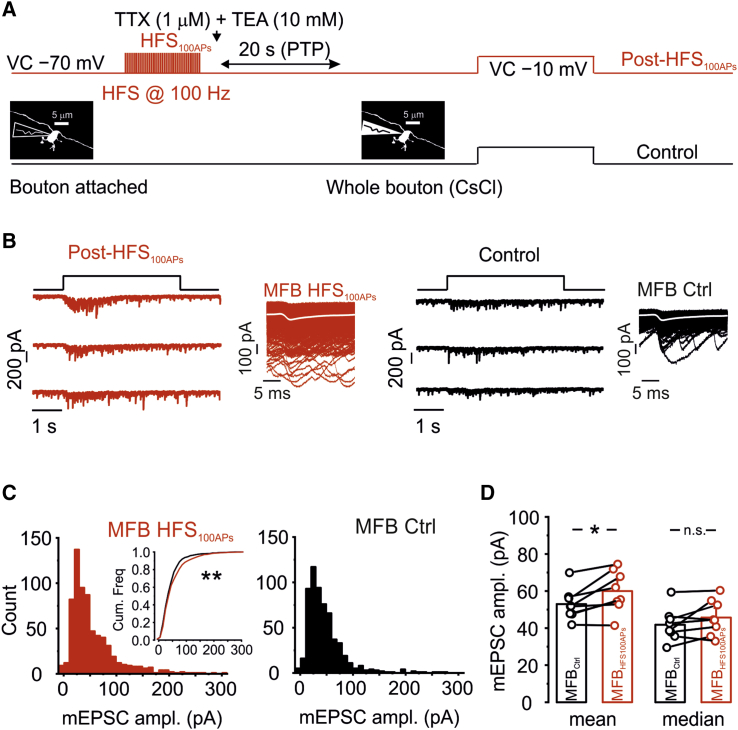
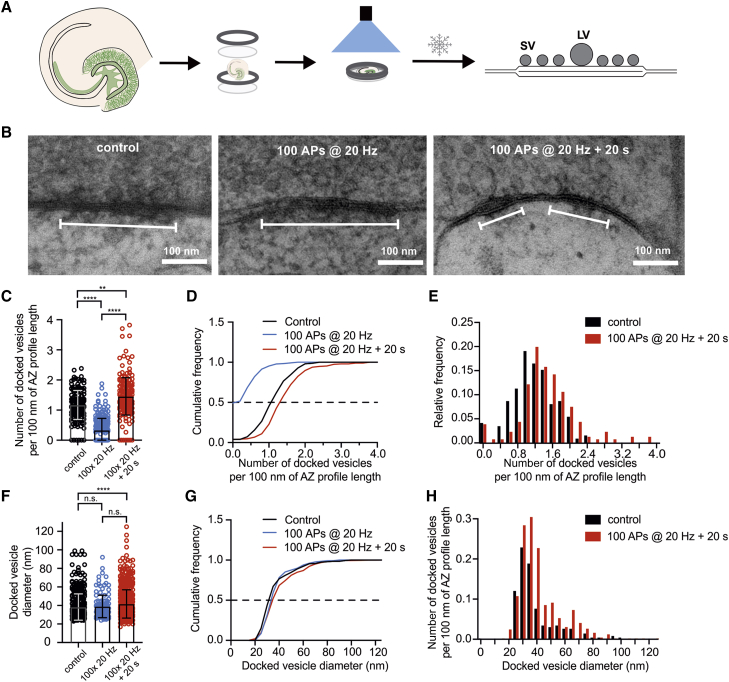
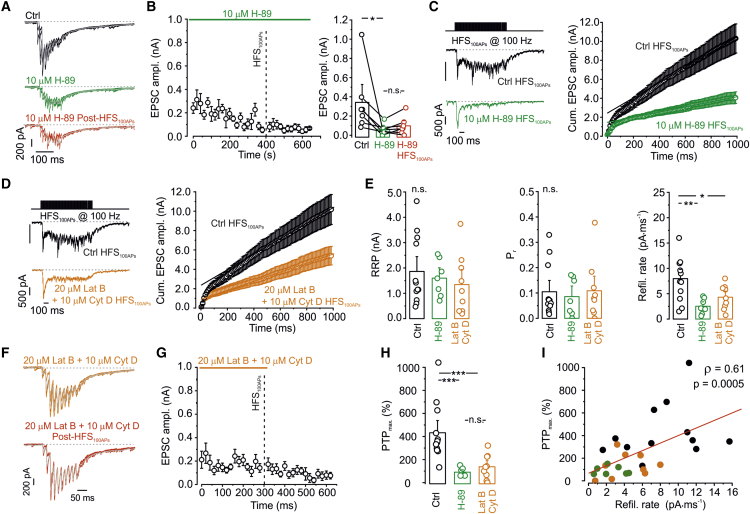
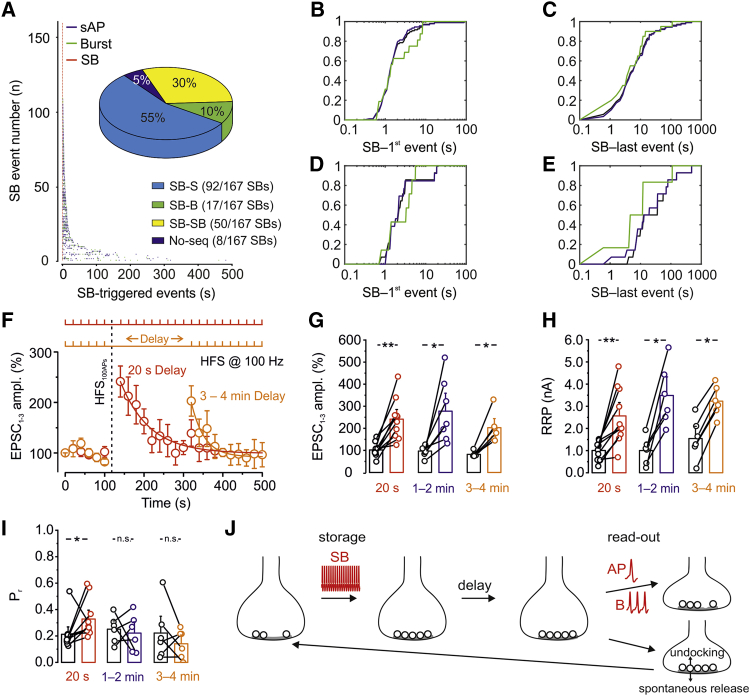
Post-tetanic potentiation (PTP) is an attractive candidate mechanism for hippocampus-dependent short-term memory. Although PTP has a uniquely large magnitude at hippocampal mossy fiber-CA3 pyramidal neuron synapses, it is unclear whether it can be induced by natural activity and whether its lifetime is sufficient to support short-term memory. We combined in vivo recordings from granule cells (GCs), in vitro paired recordings from mossy fiber terminals and postsynaptic CA3 neurons, and "flash and freeze" electron microscopy. PTP was induced at single synapses and showed a low induction threshold adapted to sparse GC activity in vivo. PTP was mainly generated by enlargement of the readily releasable pool of synaptic vesicles, allowing multiplicative interaction with other plasticity forms. PTP was associated with an increase in the docked vesicle pool, suggesting formation of structural "pool engrams." Absence of presynaptic activity extended the lifetime of the potentiation, enabling prolonged information storage in the hippocampal network.
Overview
The claims and statistics of this paper haven’t been checked yet.
Run the check — free, no account needed. It reads the open-access text and checks the sources it cites.
Integrity signals
Registry
Cites
Statistics
Figures
Verification
Claims the paper makes
The claims and statistics of this paper haven’t been checked yet.
Run the check — free, no account needed. It reads the open-access text and checks the sources it cites.
Claims other papers make about this one
Each is checked against this paper’s own text: does it say what the citing paper says it does?
The source backs part of the claim, not all of it — or backs it for a different population, condition or comparison.
In the citing paper
“For example, high-frequency stimulation (HFS) induces several cyclic adenosine monophosphate (cAMP)-dependent forms of presynaptic plasticity [21,28–33].”
From Presynaptic cAMP-PKA-mediated potentiation induces reconfiguration of synaptic vesicle pools and channel-vesicle coupling at hippocampal mossy fiber boutons (2024) · cites this paper as [21]
Experimental — accuracy not yet measuredThe source backs part of the claim, not all of it — or backs it for a different population, condition or comparison.
In the citing paper
“Thus, both short- and long-term mechanisms may involve the formation of vesicle pool engrams [21].”
From Presynaptic cAMP-PKA-mediated potentiation induces reconfiguration of synaptic vesicle pools and channel-vesicle coupling at hippocampal mossy fiber boutons (2024) · cites this paper as [21]
Experimental — accuracy not yet measuredThe source backs part of the claim, not all of it — or backs it for a different population, condition or comparison.
In the citing paper
“Previous work showed that facilitation and PTP may lead to conditional detonation or plasticity-dependent detonation at this synapse [21,51].”
From Presynaptic cAMP-PKA-mediated potentiation induces reconfiguration of synaptic vesicle pools and channel-vesicle coupling at hippocampal mossy fiber boutons (2024) · cites this paper as [21]
Experimental — accuracy not yet measuredThe cited source says what the claim attributes to it.
In the citing paper
“Thus, chemical potentiation primarily involved an increase in pool size but also an increase in Pr, reminiscent of hippocampal mossy fiber PTP [21].”
From Presynaptic cAMP-PKA-mediated potentiation induces reconfiguration of synaptic vesicle pools and channel-vesicle coupling at hippocampal mossy fiber boutons (2024) · cites this paper as [21]
The cited source says what the claim attributes to it.
In the citing paper
“Second, it has a unique extent of presynaptic plasticity, including facilitation, post-tetanic potentiation (PTP) [21], and long-term potentiation (LTP) [27].”
From Presynaptic cAMP-PKA-mediated potentiation induces reconfiguration of synaptic vesicle pools and channel-vesicle coupling at hippocampal mossy fiber boutons (2024) · cites this paper as [21]
The cited source says what the claim attributes to it.
In the citing paper
“This is consistent with a decrease in strength of synaptic transmission after H-89 application [21].”
From Presynaptic cAMP-PKA-mediated potentiation induces reconfiguration of synaptic vesicle pools and channel-vesicle coupling at hippocampal mossy fiber boutons (2024) · cites this paper as [21]
The cited source says what the claim attributes to it.
In the citing paper
“Moreover, our results revealed that baseline activity of cAMP-PKA signaling pathway is important for coupling distance, basal synaptic transmission, and the induction of presynaptic potentiation, as the application of PKA antagonists led to “uncoupling” of Munc13-1 and CaV2.1 (Figs 5 and S9) and a decrease in synaptic strength [21].”
From Presynaptic cAMP-PKA-mediated potentiation induces reconfiguration of synaptic vesicle pools and channel-vesicle coupling at hippocampal mossy fiber boutons (2024) · cites this paper as [21]
The cited source says what the claim attributes to it.
In the citing paper
“Changes in both RRP and Pr have been also reported during PTP [21].”
From Presynaptic cAMP-PKA-mediated potentiation induces reconfiguration of synaptic vesicle pools and channel-vesicle coupling at hippocampal mossy fiber boutons (2024) · cites this paper as [21]
Self-check
Percentages, sums and reported differences re-computed from the paper’s own numbers.
The self-check needs the paper’s full text.
Citations
Cites
An Introduction to the Bootstrap
Efron, B., & Tibshirani, R. (1995) · Journal of the Royal Statistical Society Series A (Statistics in Society) · doi:10.2307/2983304 · Cited by 22,453
Short-Term Synaptic Plasticity
Zucker, R. S., & Regehr, W. G. (2002) · Annual Review of Physiology · doi:10.1146/annurev.physiol.64.092501.114547 · Cited by 5,068
An Energy Budget for Signaling in the Grey Matter of the Brain
Attwell, D., & Laughlin, S. B. (2001) · Journal of Cerebral Blood Flow & Metabolism · doi:10.1097/00004647-200110000-00001 · Cited by 3,543
The Medial Temporal Lobe Memory System
Squire, L. R., & Zola-Morgan, S. (1991) · Science · doi:10.1126/science.1896849 · Cited by 3,282
Cellular basis of working memory
Goldman-Rakic, P. S. (1995) · Neuron · doi:10.1016/0896-6273(95)90304-6 · Cited by 2,663
Abbott, L. F., & Regehr, W. G. (2004) · Nature · doi:10.1038/nature03010 · Cited by 1,684
Optogenetic stimulation of a hippocampal engram activates fear memory recall
Liu, X., Ramirez, S., Pang, P. T., Puryear, C. B., Govindarajan, A., Deisseroth, K. A., & Tonegawa, S. (2012) · Nature · doi:10.1038/nature11028 · Cited by 1,669
Brain-state- and cell-type-specific firing of hippocampal interneurons in vivo
Klausberger, T., Magill, P. J., Márton, L. F., Roberts, J. D. B., Cobden, P. M., Buzsáki, G., & Somogyi, P. (2003) · Nature · doi:10.1038/nature01374 · Cited by 1,345
Geiger, J. R. P., Melcher, T., Koh, D.-S., Sakmann, B., Seeburg, P. H., Jonas, P., & Monyer, H. (1995) · Neuron · doi:10.1016/0896-6273(95)90076-4 · Cited by 1,260
Synaptic theory of working memory
Mongillo, G., Barak, O., & Tsodyks, M. (2008) · Science · doi:10.1126/science.1150769 · Cited by 1,253
Cited by
Sorted by citations
Astrocytes phagocytose adult hippocampal synapses for circuit homeostasis
Lee, J.-H., Kim, J. S., Noh, S., Lee, H., Lee, S. Y., Mun, J. Y., Park, H., & Chung, W. (2020) · Nature · doi:10.1038/s41586-020-03060-3 · Cited by 407
Calcium-dependent docking of synaptic vesicles
Silva, M., Tran, V., & Marty, A. (2021) · Trends in Neurosciences · doi:10.1016/j.tins.2021.04.003 · Cited by 87
Synapsins and the Synaptic Vesicle Reserve Pool: Floats or Anchors?
Zhang, M., & Augustine, G. J. (2021) · Cells · doi:10.3390/cells10030658 · Cited by 66
Guzman, S. J., Schlögl, A., Espinoza, C., Zhang, X., Suter, B. A., & Jónás, P. (2021) · Nature Computational Science · doi:10.1038/s43588-021-00157-1 · Cited by 58
Self-citationCalcium dependence of neurotransmitter release at a high fidelity synapse
Eshra, A., Schmidt, H., Eilers, J., & Hallermann, S. (2021) · eLife · doi:10.7554/elife.70408 · Cited by 56
Silences, spikes and bursts: Three‐part knot of the neural code
Friedenberger, Z., Harkin, E. F., Tóth, K., & Naud, R. (2023) · The Journal of Physiology · doi:10.1113/jp281510 · Cited by 63
Lituma, P. J., Kwon, H., Alviña, K., Luján, R., & Castillo, P. E. (2021) · eLife · doi:10.7554/elife.66612 · Cited by 51
Wang, W., Zhao, F., Lu, Y., Siedlak, S. L., Fujioka, H., Feng, H., Perry, G. L., & Zhu, X. (2023) · Acta Neuropathologica Communications · doi:10.1186/s40478-023-01552-7 · Cited by 52
Transient docking of synaptic vesicles: Implications and mechanisms
Kusick, G. F., Ogunmowo, T. H., & Watanabe, S. (2022) · Current Opinion in Neurobiology · doi:10.1016/j.conb.2022.102535 · Cited by 40
cAMP-Dependent Synaptic Plasticity at the Hippocampal Mossy Fiber Terminal
Shahoha, M., Cohen, R., Ben-Simon, Y., & Ashery, U. (2022) · Frontiers in Synaptic Neuroscience · doi:10.3389/fnsyn.2022.861215 · Cited by 46
Structure, biophysics, and circuit function of a “giant” cortical presynaptic terminal
Vandael, D., & Jonas, P. (2024) · Science · doi:10.1126/science.adg6757 · Cited by 45
Self-citationSelective Routing of Spatial Information Flow from Input to Output in Hippocampal Granule Cells
Zhang, X., Schlögl, A., & Jonas, P. (2020) · Neuron · doi:10.1016/j.neuron.2020.07.006 · Cited by 44
Self-citationA synaptic signal for novelty processing in the hippocampus
Gómez-Ocádiz, R., Trippa, M., Zhang, C.-L., Posani, L., Cocco, S., Monasson, R., & Schmidt‐Hieber, C. (2022) · Nature Communications · doi:10.1038/s41467-022-31775-6 · Cited by 42
Fukaya, R., Maglione, M., Sigrist, S. J., & Sakaba, T. (2021) · Proceedings of the National Academy of Sciences · doi:10.1073/pnas.2016754118 · Cited by 42
Fukaya, R., Hirai, H., Sakamoto, H., Hashimotodani, Y., Hirose, K., & Sakaba, T. (2023) · Science Advances · doi:10.1126/sciadv.add3616 · Cited by 36
The Synapse Diversity Dilemma: Molecular Heterogeneity Confounds Studies of Synapse Function
Grant, S. G. N., & Fransén, E. A. (2020) · Frontiers in Synaptic Neuroscience · doi:10.3389/fnsyn.2020.590403 · Cited by 35
Orlando, M., Dvorzhak, A., Bruentgens, F., Maglione, M., Rost, B. R., Sigrist, S. J., Breustedt, J., & Schmitz, D. (2021) · PLOS Biology · doi:10.1371/journal.pbio.3001149 · Cited by 30
Vandael, D., Okamoto, Y., Borges-Merjane, C., Vargas-Barroso, V., Suter, B. A., & Jonas, P. (2021) · Nature Protocols · doi:10.1038/s41596-021-00526-0 · Cited by 28
Self-citationJusyte, M., Blaum, N., Böhme, M. A., Berns, M. M. M., Bonard, A. E., Vámosi, Á. B., Pushpalatha, K. V., Kobbersmed, J. R., & Walter, A. M. (2023) · Cell Reports · doi:10.1016/j.celrep.2023.112541 · Cited by 26
Tran, V., Miki, T., & Marty, A. (2022) · Proceedings of the National Academy of Sciences · doi:10.1073/pnas.2114469119 · Cited by 27
Mechanisms of Synaptic Vesicle Exo- and Endocytosis
Mochida, S. (2022) · Biomedicines · doi:10.3390/biomedicines10071593 · Cited by 31
Automated Detection and Localization of Synaptic Vesicles in Electron Microscopy Images
Imbrosci, B., Schmitz, D., & Orlando, M. (2022) · eNeuro · doi:10.1523/eneuro.0400-20.2021 · Cited by 26
Imaging brain tissue architecture across millimeter to nanometer scales
Michalska, J. M., Lyudchik, J., Velicky, P., Štefaničková, H., Watson, J. F., Cenameri, A., Sommer, C., Amberg, N., Venturino, A., Rössler, K., et al. (2023) · Nature Biotechnology · doi:10.1038/s41587-023-01911-8 · Cited by 32
SynaptoPAC, an optogenetic tool for induction of presynaptic plasticity
Oldani, S., Velasquez, L. M., Faiss, L., Stumpf, A., Rosenmund, C., Schmitz, D., & Rost, B. R. (2020) · Journal of Neurochemistry · doi:10.1111/jnc.15210 · Cited by 27
Neuromorphic Optical Data Storage Enabled by Nanophotonics: A Perspective
Lamon, S., Zhang, Q., Yu, H., & Gu, M. (2024) · ACS Photonics · doi:10.1021/acsphotonics.3c01253 · Cited by 24
Fully-primed slowly-recovering vesicles mediate presynaptic LTP at neocortical neurons
Weichard, I., Taschenberger, H., Gsell, F., Bornschein, G., Ritzau‐Jost, A., Schmidt, H., Kittel, R. J., Eilers, J., Neher, E., Hallermann, S., et al. (2023) · Proceedings of the National Academy of Sciences · doi:10.1073/pnas.2305460120 · Cited by 24
Tabuchi, E., Sakaba, T., & Hashimotodani, Y. (2022) · Proceedings of the National Academy of Sciences · doi:10.1073/pnas.2119636119 · Cited by 23
Transsynaptic modulation of presynaptic short-term plasticity in hippocampal mossy fiber synapses
Vandael, D. H. F., Okamoto, Y., & Jónás, P. (2021) · Nature Communications · doi:10.1038/s41467-021-23153-5 · Cited by 20
Self-citationBeyond a Transmission Cable—New Technologies to Reveal the Richness in Axonal Electrophysiology
Mateus, J. C., Sousa, M. M., Burrone, J., & Aguiar, P. (2024) · Journal of Neuroscience · doi:10.1523/jneurosci.1446-23.2023 · Cited by 23
Prioritized docking of synaptic vesicles provided by a rapid recycling pathway
Tran, V., Silva, M., & Marty, A. (2023) · iScience · doi:10.1016/j.isci.2023.106366 · Cited by 24
The unique plasticity of hippocampal adult‐born neurons: Contributing to a heterogeneous dentate
Huckleberry, K. A., & Shansky, R. M. (2021) · Hippocampus · doi:10.1002/hipo.23318 · Cited by 22
Regulation of hippocampal mossy fiber-CA3 synapse function by a Bcl11b/C1ql2/Nrxn3(25b+) pathway
Koumoundourou, A., Rannap, M., Bruyckere, E. D., Nestel, S., Reißner, C., Egorov, A. V., Liu, P., Missler, M., Heimrich, B., Draguhn, A., et al. (2023) · eLife · doi:10.7554/elife.89854 · Cited by 19
Vyleta, N. P., & Snyder, J. S. (2021) · PLoS ONE · doi:10.1371/journal.pone.0253642 · Cited by 19
Kim, O., Okamoto, Y., Kaufmann, W. A., Brose, N., Shigemoto, R., & Jonas, P. (2024) · PLOS Biology · doi:10.1371/journal.pbio.3002879 · Cited by 15
Silva, M., Tran, V., & Marty, A. (2023) · eLife · doi:10.7554/elife.91087 · Cited by 14
Ultrastructural analysis of wild-type and RIM1α knockout active zones in a large cortical synapse
Lichter, K., Paul, M. M., Pauli, M., Schoch, S., Kollmannsberger, P., Stigloher, C., Heckmann, M., & Sirén, A.-L. (2022) · Cell Reports · doi:10.1016/j.celrep.2022.111382 · Cited by 15
FMRP activity and control of Csw/SHP2 translation regulate MAPK-dependent synaptic transmission
Leahy, S. N., Song, C., Vita, D. J., & Broadie, K. S. (2023) · PLoS Biology · doi:10.1371/journal.pbio.3001969 · Cited by 14
Mechanistic insights into cAMP-mediated presynaptic potentiation at hippocampal mossy fiber synapses
Fukaya, R., Miyano, R., Hirai, H., & Sakaba, T. (2023) · Frontiers in Cellular Neuroscience · doi:10.3389/fncel.2023.1237589 · Cited by 13
Evolutionary conservation of hippocampal mossy fiber synapse properties
Pelkey, K. A., Vargish, G. A., Pellegrini, L. V., Calvigioni, D., Chapeton, J. I., Yuan, X. Q., Hunt, S., Cummins, A. C., Eldridge, M. A. G., Pickel, J. M., et al. (2023) · Neuron · doi:10.1016/j.neuron.2023.09.005 · Cited by 16
Zhang, X., Schlögl, A., Vandael, D. H. F., & Jónás, P. (2021) · Journal of Neuroscience Methods · doi:10.1016/j.jneumeth.2021.109125 · Cited by 14
Self-citationShort term plasticity at hippocampal mossy fiber synapses
Marneffe, C., Moreira-de-Sá, A., Lecomte, S., Erhardt, A., & Mulle, C. (2024) · Neuroscience · doi:10.1016/j.neuroscience.2024.09.044 · Cited by 15
Tanaka, M., Sakaba, T., & Miki, T. (2021) · The Journal of Physiology · doi:10.1113/jp282235 · Cited by 16
Pauli, M., Paul, M. M., Proppert, S., Mrestani, A., Sharifi, M., Repp, F., Kürzinger, L., Kollmannsberger, P., Sauer, M., Heckmann, M., et al. (2021) · Communications Biology · doi:10.1038/s42003-021-01939-z · Cited by 12
Short-term plasticity as a mechanism to regulate and retain multistability
Zhou, X., Tian, C., Zhang, X., Zheng, M., & Xu, K. (2022) · Chaos Solitons & Fractals · doi:10.1016/j.chaos.2022.112891 · Cited by 12
Self-citationShen, Z., Shen, J., Sheng, H., Kang, L., Zeng, Z., Chen, W., Li, A., & Zhao, C. (2026) · Advanced Functional Materials · doi:10.1002/adfm.202531922 · Cited by 13
Synaptopodin Regulates Denervation-Induced Plasticity at Hippocampal Mossy Fiber Synapses
Kruse, P., Brandes, G., Hemeling, H., Huang, Z., Wrede, C., Hegermann, J., Vlachos, A., & Lenz, M. (2024) · Cells · doi:10.3390/cells13020114 · Cited by 12
Presynaptic short-term plasticity persists in the absence of PKC phosphorylation of Munc18-1
Wang, C.-C., Weyrer, C., Fioravante, D., Kaeser, P. S., & Regehr, W. G. (2021) · Journal of Neuroscience · doi:10.1523/jneurosci.0347-21.2021 · Cited by 11
The human cognition-enhancing CORD7 mutation increases active zone number and synaptic release
Paul, M. M., Dannhäuser, S., Morris, L., Mrestani, A., Hübsch, M., Gehring, J., Hatzopoulos, G. N., Pauli, M., Auger, G. M., Bornschein, G., et al. (2022) · Brain · doi:10.1093/brain/awac011 · Cited by 11
Structural and Functional Properties of Hippocampal Neurons
Spruston, N., Piskorowski, R. A., Chevaleyre, V., Eyre, M. D., McBain, C. J., & Bartos, M. (2025) · Oxford University Press eBooks · doi:10.1093/med/9780190065324.003.0005 · Cited by 11
A non-Hebbian code for episodic memory
Pang, R., & Recanatesi, S. (2025) · Science Advances · doi:10.1126/sciadv.ado4112 · Cited by 11
Ramesh, N., Escher, M., Turrel, O., Lützkendorf, J., Matkovic, T., Liu, F., & Sigrist, S. J. (2023) · eLife · doi:10.7554/elife.86084 · Cited by 8
Lee, H., Choi, S. H., & Lee, S. (2023) · Cerebral Cortex · doi:10.1093/cercor/bhad476 · Cited by 8
The Lack of Synapsin Alters Presynaptic Plasticity at Hippocampal Mossy Fibers in Male Mice
Bruentgens, F., Velasquez, L. M., Stumpf, A., Parthier, D., Breustedt, J., Benfenati, F., Milovanović, D., Schmitz, D., & Orlando, M. (2024) · eNeuro · doi:10.1523/eneuro.0330-23.2024 · Cited by 9
An Incremental Learning Model for Mobile Robot: From Short-Term Memory to Long-Term Memory
Wang, D., Yang, K., Liu, L., & Wang, H. (2021) · IEEE Transactions on Artificial Intelligence · doi:10.1109/tai.2021.3139264 · Cited by 8
Integration of spatial and non-spatial information by heterogeneous dentate gyrus granule cells
Zhang, X., & Jónás, P. (2020) · JoLS Journal of Life Sciences · doi:10.36069/jols/20201202 · Cited by 7
Self-citationStable and Flexible Synaptic Transmission Controlled by the Active Zone Protein Interactions
Mochida, S. (2021) · International Journal of Molecular Sciences · doi:10.3390/ijms222111775 · Cited by 7
Gómez-Ocádiz, R., Trippa, M., Posani, L., Cocco, S., Monasson, R., & Schmidt‐Hieber, C. (2021) · bioRxiv (Cold Spring Harbor Laboratory) · doi:10.1101/2021.02.24.432612 · Cited by 7
Uncovering brain tissue architecture across scales with super-resolution light microscopyPreprint
Michalska, J. M., Lyudchik, J., Velicky, P., Korinkova, H., Watson, J. F., Cenameri, A., Sommer, C., Venturino, A., Rössler, K., Czech, T., et al. (2022) · bioRxiv (Cold Spring Harbor Laboratory) · doi:10.1101/2022.08.17.504272 · Cited by 7
Retrograde Suppression of Post-Tetanic Potentiation at the Mossy Fiber-CA3 Pyramidal Cell Synapse
Makani, S., Lutzu, S., Lituma, P. J., Hunt, D. L., & Castillo, P. E. (2021) · eNeuro · doi:10.1523/eneuro.0450-20.2021 · Cited by 6
Pan, E., Puranam, R. S., & McNamara, J. O. (2021) · eNeuro · doi:10.1523/eneuro.0375-21.2021 · Cited by 6
Cav2.2 Channels Sustain Vesicle Recruitment at a Mature Glutamatergic Synapse
Wender, M., Bornschein, G., Brachtendorf, S., Hallermann, S., Eilers, J., & Schmidt, H. (2023) · Journal of Neuroscience · doi:10.1523/jneurosci.1279-22.2023 · Cited by 6
Tu, T., Cai, X.-L., Sun, Z., Yang, C. G., Jiang, J., Wan, L., Ai, J.-Q., Wang, Y., Coulibaly, S., Tang, B., et al. (2025) · Scientific Reports · doi:10.1038/s41598-025-00094-3 · Cited by 5
An enhancer-AAV approach selectively targeting dentate granule cells of the mouse hippocampus
Banks, E. R., Gutekunst, C., Vargish, G. A., Eaton, A., Pelkey, K. A., McBain, C. J., Zheng, J. Q., Oláh, V. J., & Rowan, M. J. (2024) · Cell Reports Methods · doi:10.1016/j.crmeth.2023.100684 · Cited by 5
Impact of Spike-Time Dependent Plasticity on Neuro-Spike Communication
Chen, W., Huang, Y., & Lin, L. (2024) · IEEE Wireless Communications and Networking Conference · doi:10.1109/wcnc57260.2024.10570985 · Cited by 5
Synaptic Plasticity in the Hippocampus
Bliss, T., Collingridge, G. L., Cooke, S. F., Georgiou, J., & Morris, R. (2025) · Oxford University Press eBooks · doi:10.1093/med/9780190065324.003.0010 · Cited by 4
Ranjan, M., Lin, K., Mueller, B. D., Wojcik, S. M., Lohse, M., Südhof, T. C., Jørgensen, E. M., Neher, E., Lipstein, N., Brose, N., et al. (2026) · Science Advances · doi:10.1126/sciadv.aea0449 · Cited by 3
Visualizing Presynaptic Active Zones and Synaptic Vesicles
Heckmann, M., & Pauli, M. (2022) · Frontiers in Synaptic Neuroscience · doi:10.3389/fnsyn.2022.901341 · Cited by 3
Multivesicular release favors short term synaptic depression in hippocampal autapses
Segundo, P. M. S., Terni, B., & Llobet, A. (2023) · Frontiers in Cellular Neuroscience · doi:10.3389/fncel.2023.1057242 · Cited by 3
Lin, L., Chen, W., Huang, Y., & Xu, J. (2024) · IEEE Access · doi:10.1109/access.2024.3453400 · Cited by 3
Koppensteiner, P., Bhandari, P., Önal, C., Borges-Merjane, C., Monnier, E. L., Nakamura, Y., Sadakata, T., Sanbo, M., Hirabayashi, M., Brose, N., et al. (2022) · bioRxiv (Cold Spring Harbor Laboratory) · doi:10.1101/2022.10.28.514202 · Cited by 3
Self-citationChanaday, N. L. (2026) · Advances in neurobiology · doi:10.1007/978-3-032-12594-1_3 · Cited by 2
Regulation of hippocampal mossy fiber-CA3 synapse function by a Bcl11b/C1ql2/Nrxn3(25b+) pathwayPreprint
Koumoundourou, A., Rannap, M., Bruyckere, E. D., Nestel, S., Reißner, C., Egorov, A. V., Liu, P., Missler, M., Heimrich, B., Draguhn, A., et al. (2023) · bioRxiv (Cold Spring Harbor Laboratory) · doi:10.1101/2023.05.23.541921 · Cited by 2
Kim, O., Okamoto, Y., Brose, N., Shigemoto, R., & Jónás, P. (2023) · bioRxiv (Cold Spring Harbor Laboratory) · doi:10.1101/2023.12.04.569907 · Cited by 2
Synaptic Theory of Chunking in Working MemoryPreprint
Zhong, W., Katkov, M., & Tsodyks, M. V. (2024) · bioRxiv (Cold Spring Harbor Laboratory) · doi:10.1101/2024.08.14.607952 · Cited by 3
Silva, M., Tran, V., & Marty, A. (2024) · eLife · doi:10.7554/elife.91087.3 · Cited by 1
Shu, W., & Jackson, M. B. (2025) · Hippocampus · doi:10.1002/hipo.70049 · Cited by 1
Distribution and Levels of Insulin-like Growth Factor 2 Receptor Across Mouse Brain Cell Types
Gaunt, J. R., Manoj, G., & Alberini, C. M. (2025) · Receptors · doi:10.3390/receptors5010001 · Cited by 2
The flexible synapse – How mossy fiber architecture adapts to changing needs
Bruentgens, F., Schmitz, D., & Orlando, M. (2026) · Progress in Neurobiology · doi:10.1016/j.pneurobio.2026.102882 · Cited by 1
Shin, J., Lee, S. Y., Kim, Y., & Lee, S. (2026) · eLife · doi:10.7554/elife.102923.6 · Cited by 1
López-Murcia, F. J., Krueger‐Burg, D., Wenger, S., López-Hernández, T., Lipstein, N., Taschenberger, H., & Brose, N. (2026) · Cell Reports · doi:10.1016/j.celrep.2026.117029 · Cited by 1
Functioning of Synaptic Vesicle Pools: Diversity and Organizational Principles
Gafurova, C. R., & Petrov, A. M. (2026) · Biochemistry (Moscow) · doi:10.1134/s0006297926600535 · Cited by 1
Distinguishing between Synaptic Vesicles in Different Functional States
Pauli, M., & Heckmann, M. (2021) · Neuroscience · doi:10.1016/j.neuroscience.2020.12.031 · Cited by 1
A Novel Enhancer-AAV Approach Selectively Targeting Dentate Granule CellsPreprint
Banks, E. R., Gutekunst, C., Vargish, G. A., Eaton, A., Pelkey, K. A., McBain, C. J., Zheng, J. Q., Oláh, V. J., & Rowan, M. J. (2023) · bioRxiv (Cold Spring Harbor Laboratory) · doi:10.1101/2023.02.03.527045 · Cited by 1
Marneffe, C., Grosjean, N., Nicolay-Kritter, K., Chatras, C., Harrell, E. R., Kees, A. L., & Mulle, C. (2024) · bioRxiv (Cold Spring Harbor Laboratory) · doi:10.1101/2024.09.10.612312 · Cited by 1
Shin, J., Lee, S. Y., Kim, Y., & Lee, S. (2025) · eLife · doi:10.7554/elife.102923.1 · Cited by 1
Shin, J., Lee, S. Y., Kim, Y., & Lee, S. (2025) · eLife · doi:10.7554/elife.102923 · Cited by 1
Vesicle Pools of Memory at Mossy Fiber Synapses
Vargish, G. A., & McBain, C. J. (2020) · Neuron · doi:10.1016/j.neuron.2020.07.005
A role for synapsin 2a oligomerization in maintaining a reserve pool of synaptic vesicles
Zhang, M. (2022) · DR-NTU (Nanyang Technological University) · doi:10.32657/10356/159292
Regulation of hippocampal mossy fiber-CA3 synapse function by a Bcl11b/C1ql2/Nrxn3(25b+) pathwayPreprint
Koumoundourou, A., Rannap, M., Bruyckere, E. D., Nestel, S., Reißner, C., Egorov, A. V., Liu, P., Missler, M., Heimrich, B., Draguhn, A., et al. (2023) · eLife · doi:10.7554/elife.89854.1
Silva, M., Tran, V., & Marty, A. (2023) · bioRxiv (Cold Spring Harbor Laboratory) · doi:10.1101/2023.08.20.554020
Silva, M., Tran, V., & Marty, A. (2023) · eLife · doi:10.7554/elife.91087.1
Silva, M., Tran, V., & Marty, A. (2023) · eLife · doi:10.7554/elife.91087.2
Błasiak-Tytuła, M., & Shevchuk-Kliuzheva, O. (2023) · ANNALES UNIVERSITATIS PAEDAGOGICAE CRACOVIENSIS STUDIA LINGUISTICA · doi:10.24917/20831765.18.3
Regulation of hippocampal mossy fiber-CA3 synapse function by a Bcl11b/C1ql2/Nrxn3(25b+) pathwayPreprint
Koumoundourou, A., Rannap, M., Bruyckere, E. D., Nestel, S., Reißner, C., Egorov, A. V., Liu, P., Missler, M., Heimrich, B., Draguhn, A., et al. (2024) · eLife · doi:10.7554/elife.89854.2
Hebbian induction adds AMPA-labile signaling units to CA3-CA1 synapses in the developing hippocampusPreprint
Abrahamsson, T., Gustafsson, B., & Hanse, E. (2024) · bioRxiv (Cold Spring Harbor Laboratory) · doi:10.1101/2024.09.25.614864
High frequency stimulation activates hot spots of spontaneous synaptic transmission
Astacio, H., & Bykhovskaia, M. (2025) · Frontiers in Synaptic Neuroscience · doi:10.3389/fnsyn.2025.1539868
Shin, J., Lee, S. Y., Kim, Y., & Lee, S. (2025) · eLife · doi:10.7554/elife.102923.2
Shin, J., Lee, S. Y., Kim, Y., & Lee, S. (2025) · eLife · doi:10.7554/elife.102923.3
Shin, J., Lee, S. Y., Kim, Y., & Lee, S. (2025) · eLife · doi:10.7554/elife.102923.4
Lichter, K. (2025) · Science · doi:10.1126/science.aec0091
Metadata
- Authors
- Vandael, D., Borges-Merjane, C., Zhang, X., & Jonas, P.
- Affiliations
- Institute of Science and Technology Austria (AT)
- Venue
- Neuron
- Publisher
- Elsevier BV
- Published
- 2020-08
- Volume
- 107
- Issue
- 3
- Pages
- 509-521.e7
- ISSN
- 0896-6273 (ISSN-L)
- PMC
- PMC7427323
- OpenAlex
- W3032084133
- Cited by
- 114
- References
- 80
- Citations by year
- 2026: 16 · 2025: 13 · 2024: 17 · 2023: 24 · 2022: 15 · 2021: 23 · 2020: 6
- FWCI
- 7.79
- Type
- journal article
- Language
- en
- Open access
- hybrid
- doi.org
- Licence
- Locations
- Neuron (publishedVersion, cc-by-nc-nd)
- PubMed Central (publishedVersion, cc-by-nc-nd)
- PubMed (publishedVersion)
- Funders
- Horizon 2020 (692692)
- European Research Council
- Austrian Science Fund (V 739-B27, Z 312-B27)
- Topics
- Life Sciences › Neuroscience › Cellular and Molecular Neuroscience › Neuroscience and Neuropharmacology Research
- Life Sciences › Neuroscience › Cognitive Neuroscience › Memory and Neural Mechanisms
- Life Sciences › Neuroscience › Cognitive Neuroscience › Neural dynamics and brain function
- Keywords
- post-tetanic potentiation, short-term plasticity, mossy fiber synapses, hippocampus, CA3 pyramidal cells, granule cells, synaptic vesicle pools, readily releasable pool, docked vesicles, short-term memory, synaptic plasticity, presynaptic activity
- MeSH terms
- Action Potentials, Animals, Memory, Short-Term, Microscopy, Electron, Neuronal Plasticity, Synapses, Synaptic Vesicles, Pyramidal Cells, Patch-Clamp Techniques, Dentate Gyrus, Mossy Fibers, Hippocampal, Mice, Rats, Synaptic Potentials, CA3 Region, Hippocampal
About these checks
Registry, retraction, Cites and statistics results are computed, not judged, with one exception: a printed reference that no index lists is read once by a model before it counts as a citation error. Claims are extracted by a model and kept only when their quote appears verbatim in the text; each cited source is then checked, with a model’s help, for whether it says what the claim relies on. Those verdicts can be wrong — read the claim’s quote and the cited source before relying on one.
Statistics and arithmetic are recomputed, not judged.
Confidence bands are shown only for fields calibrated on our annotated test set. None is calibrated yet, so no band is shown.
What counts as a claim ›How we measure confidence ›How we check this ›
Are you an author, or do you see a problem with this page? Request a review
