

The DOI matches its Crossref record; 100 of the 100 references it cites were found in a registry or an index.
Associations between white matter microstructure and amyloid burden in preclinical Alzheimer’s disease: a multimodal imaging investigation.
Open accessAbstract
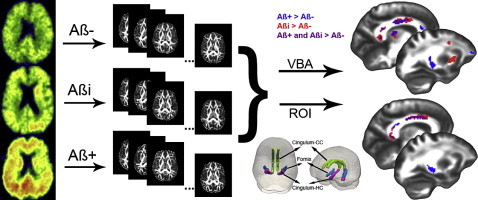
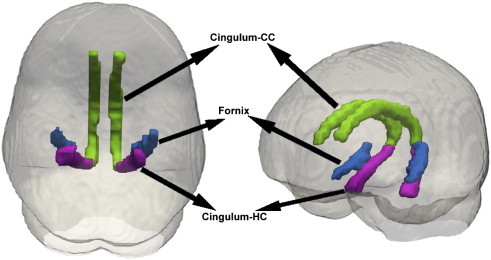
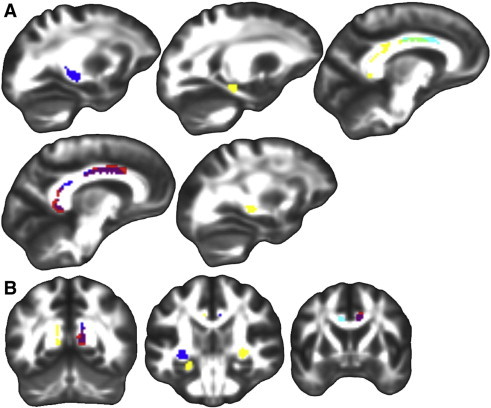
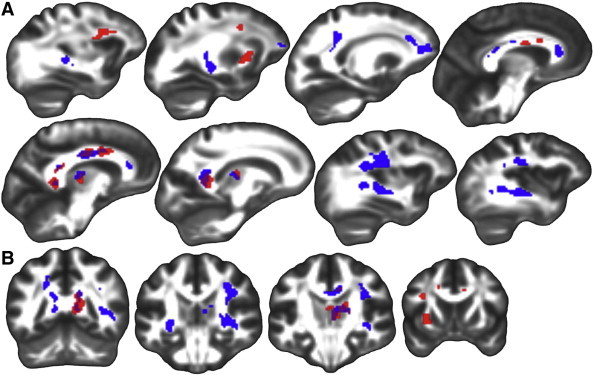
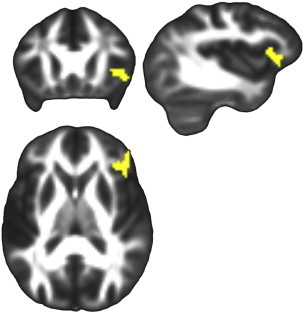
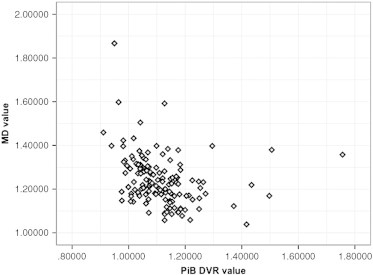
Some cognitively healthy individuals develop brain amyloid accumulation, suggestive of incipient Alzheimer's disease (AD), but the effect of amyloid on other potentially informative imaging modalities, such as Diffusion Tensor Imaging (DTI), in characterizing brain changes in preclinical AD requires further exploration. In this study, a sample (N = 139, mean age 60.6, range 46 to 71) from the Wisconsin Registry for Alzheimer's Prevention (WRAP), a cohort enriched for AD risk factors, was recruited for a multimodal imaging investigation that included DTI and [C-11]Pittsburgh Compound B (PiB) positron emission tomography (PET). Participants were grouped as amyloid positive (Aβ+), amyloid indeterminate (Aβi), or amyloid negative (Aβ-) based on the amount and pattern of amyloid deposition. Regional voxel-wise analyses of four DTI metrics, fractional anisotropy (FA), mean diffusivity (MD), axial diffusivity (Da), and radial diffusivity (Dr), were performed based on amyloid grouping. Three regions of interest (ROIs), the cingulum adjacent to the corpus callosum, hippocampal cingulum, and lateral fornix, were selected based on their involvement in the early stages of AD. Voxel-wise analysis revealed higher FA among Aβ+ compared to Aβ- in all three ROIs and in Aβi compared to Aβ- in the cingulum adjacent to the corpus callosum. Follow-up exploratory whole-brain analyses were consistent with the ROI findings, revealing multiple regions where higher FA was associated with greater amyloid. Lower fronto-lateral gray matter MD was associated with higher amyloid burden. Further investigation showed a negative correlation between MD and PiB signal, suggesting that Aβ accumulation impairs diffusion. Interestingly, these findings in a largely presymptomatic sample are in contradistinction to relationships reported in the literature in symptomatic disease stages of Mild Cognitive Impairment and AD, which usually show higher MD and lower FA. Together with analyses showing that cognitive function in these participants is not associated with any of the four DTI metrics, the present results suggest an early relationship between PiB and DTI, which may be a meaningful indicator of the initiating or compensatory mechanisms of AD prior to cognitive decline.
Overview
The claims and statistics of this paper haven’t been checked yet.
Run the check — free, no account needed. It reads the open-access text and checks the sources it cites.
Integrity signals
Registry
Cites
Statistics
Figures
Verification
Claims the paper makes
The claims and statistics of this paper haven’t been checked yet.
Run the check — free, no account needed. It reads the open-access text and checks the sources it cites.
Claims other papers make about this one
Each is checked against this paper’s own text: does it say what the citing paper says it does?
The source backs part of the claim, not all of it — or backs it for a different population, condition or comparison.
In the citing paper
“Recent evidence in patients indicates that this increase in FA could be related to soluble Aβ rising in the early stage of AD (Racine et al., 2014).”
From Early stage alterations in white matter and decreased functional interhemispheric hippocampal connectivity in the 3xTg mouse model of Alzheimer’s disease. (2019) · cites this paper as Racine et al., 2014
Experimental — accuracy not yet measuredThe cited source says what the claim attributes to it.
In the citing paper
“Diffusion tensor imaging (DTI) metrics or structural connectome alterations showed correlations with amyloid burden (Racine et al., 2014) or levels of cerebrospinal fluid amyloid and tau (Tucholka et al., 2018).”
From Effects of Alzheimer’s and Vascular Pathologies on Structural Connectivity in Early- and Late-Onset Alzheimer’s Disease (2021) · cites this paper as Racine et al., 2014
Self-check
Percentages, sums and reported differences re-computed from the paper’s own numbers.
The self-check needs the paper’s full text.
Citations
Cites
A reproducible evaluation of ANTs similarity metric performance in brain image registration
Avants, B. B., Tustison, N. J., Song, G., Cook, P. A., Klein, A., & Gee, J. C. (2011) · NeuroImage · doi:10.1016/j.neuroimage.2010.09.025 · Cited by 4,796
The basis of anisotropic water diffusion in the nervous system—A technical review.
Beaulieu, C. (2002) · NMR in Biomedicine · doi:10.1002/nbm.782 · Cited by 4,628
The Neuropsychological Assessment
Ogden, J. A. (2005) · Oxford University Press eBooks · doi:10.1093/oso/9780195171358.003.0002 · Cited by 4,382
Diffusion tensor imaging of the brain
Alexander, A. L., Lee, J. E., Lazar, M., & Field, A. S. (2007) · Neurotherapeutics · doi:10.1016/j.nurt.2007.05.011 · Cited by 2,747
Self-citationVillemagne, V. L., Burnham, S., Bourgeat, P., Brown, B., Ellis, K. A., Salvado, O., Szoeke, C., Macaulay, S. L., Martins, R., Maruff, P., et al. (2013) · The Lancet Neurology · doi:10.1016/s1474-4422(13)70044-9 · Cited by 2,279
The role of the posterior cingulate cortex in cognition and disease
Leech, R., & Sharp, D. J. (2014) · Brain · doi:10.1093/brain/awt162 · Cited by 2,247
Evaluation of 14 nonlinear deformation algorithms applied to human brain MRI registration
Klein, A., Andersson, J., Ardekani, B. A., Ashburner, J., Avants, B., Chiang, M.-C., Christensen, G. E., Collins, D. L., Gee, J., Hellier, P., et al. (2009) · NeuroImage · doi:10.1016/j.neuroimage.2008.12.037 · Cited by 2,227
Fiber Tract–based Atlas of Human White Matter Anatomy
Wakana, S., Jiang, H., Nagae‐Poetscher, L. M., van Zijl, P. C. M., & Mori, S. (2004) · Radiology · doi:10.1148/radiol.2301021640 · Cited by 2,023
High angular resolution diffusion imaging reveals intravoxel white matter fiber heterogeneity
Tuch, D. S., Reese, T. G., Wiegell, M. R., Makris, N., Belliveau, J. W., & Wedeen, V. J. (2002) · Magnetic Resonance in Medicine · doi:10.1002/mrm.10268 · Cited by 1,548 · cited 1×
“Future studies should combine DTI with high angular resolution diffusion imaging (HARDI), which uses 40 or more diffusion directions, to help resolve fiber orientation limitations and improve interpretations of DTI metrics in regions suspected to contain crossing fibers (Alexander et al., 2011; Tournier et al., 2008;…”
Remyelination in the CNS: from biology to therapy
Franklin, R. J. M., & ffrench-Constant, C. (2008) · Nature Reviews Neuroscience · doi:10.1038/nrn2480 · Cited by 1,544
Fiber tract-based atlas of human white matter anatomy
Wakana, S. (2006) · Medical Entomology and Zoology · Cited by 1,531
Correlation Between Elevated Levels of Amyloid β-Peptide in the Brain and Cognitive Decline
Näslund, J. (2000) · JAMA · doi:10.1001/jama.283.12.1571 · Cited by 1,268
Jack, C. R., Lowe, V. J., Weigand, S. D., Wiste, H. J., Senjem, M. L., Knopman, D. S., Shiung, M. M., Gunter, J. L., Boeve, B. F., Kemp, B. J., et al. (2009) · Brain · doi:10.1093/brain/awp062 · Cited by 1,099
Rabin, L., Barr, W., & Burton, L. A. (2004) · Archives of Clinical Neuropsychology · doi:10.1016/j.acn.2004.02.005 · Cited by 871
Evidence for cortical “disconnection” as a mechanism of age-related cognitive decline
O'Sullivan, M. J., Jones, D. K., Summers, P. E., Morris, R. G., Williams, S., & Markus, H. S. (2001) · Neurology · doi:10.1212/wnl.57.4.632 · Cited by 828
Twenty‐five pitfalls in the analysis of diffusion MRI data
Jones, D. K., & Cercignani, M. (2010) · NMR in Biomedicine · doi:10.1002/nbm.1543 · Cited by 827
Episodic memory loss is related to hippocampal-mediated -amyloid deposition in elderly subjects
Mormino, E. C., Kluth, J. T., Madison, C. M., Rabinovici, G. D., Baker, S. L., Miller, B. L., Koeppe, R. A., Mathis, C. A., Weiner, M. W., Jagust, W. J., et al. (2009) · Brain · doi:10.1093/brain/awn320 · Cited by 684
Trajectories of brain aging in middle-aged and older adults: Regional and individual differences
Raz, N., Ghisletta, P., Rodrigue, K. M., Kennedy, K. M., & Lindenberger, U. (2010) · NeuroImage · doi:10.1016/j.neuroimage.2010.03.020 · Cited by 626
Spatial transformations of diffusion tensor magnetic resonance images
Alexander, D. C., Pierpaoli, C., Basser, P. J., & Gee, J. C. (2001) · IEEE Transactions on Medical Imaging · doi:10.1109/42.963816 · Cited by 610 · cited 1×
“Tensor-based registration provides optimal alignment between subjects by taking advantage of similarity measures comparing whole tensors via explicit optimization of tensor reorientation (Alexander and Gee, 2000; Alexander et al., 2001).”
Tournier, J., Yeh, C., Calamante, F., Cho, K.-H., Connelly, A., & Lin, C. (2008) · NeuroImage · doi:10.1016/j.neuroimage.2008.05.002 · Cited by 591
Rate of memory decline in AD is related to education and occupation: Cognitive reserve?
Stern, Y., Albert, S., Tang, M.-X., & Tsai, W.-Y. (1999) · Neurology · doi:10.1212/wnl.53.9.1942 · Cited by 557
Douaud, G., Jbabdi, S., Behrens, T. E. J., Menke, R. A., Gass, A., Monsch, A. U., Rao, A., Whitcher, B., Kindlmann, G., Matthews, P. M., et al. (2011) · NeuroImage · doi:10.1016/j.neuroimage.2010.12.008 · Cited by 514
Edison, P., Archer, H. A., Gerhard, A., Hinz, R., Pavese, N., Turkheimer, F. E., Hammers, A., Tai, Y. F., Fox, N., Kennedy, A., et al. (2008) · Neurobiology of Disease · doi:10.1016/j.nbd.2008.08.001 · Cited by 513
Applications of diffusion‐weighted and diffusion tensor MRI to white matter diseases – a review
Horsfield, M. A., & Jones, D. K. (2002) · NMR in Biomedicine · doi:10.1002/nbm.787 · Cited by 468
Alexander, A. L., Hurley, S. A., Samsonov, A. A., Adluru, N., Hosseinbor, A. P., Mossahebi, P., Tromp, D., Zakszewski, E., & Field, A. S. (2011) · Brain Connectivity · doi:10.1089/brain.2011.0071 · Cited by 468
Self-citationDeformable registration of diffusion tensor MR images with explicit orientation optimization
ZHANG, H., Yushkevich, P. A., Alexander, D. C., & Gee, J. C. (2006) · Medical Image Analysis · doi:10.1016/j.media.2006.06.004 · Cited by 461
Construct validity in the trail making test: What makes part B harder?
Gaudino, E. A., Geisler, M. W., & Squires, N. K. (1995) · Journal of Clinical and Experimental Neuropsychology · doi:10.1080/01688639508405143 · Cited by 442
Trail Making Test errors in normal aging, mild cognitive impairment, and dementia
Ashendorf, L., Jefferson, A. L., O’Connor, M. K., Chaisson, C. E., Green, R. C., & Stern, R. A. (2008) · Archives of Clinical Neuropsychology · doi:10.1016/j.acn.2007.11.005 · Cited by 427
β-Amyloid burden in healthy aging: Regional distribution and cognitive consequences
Rodrigue, K. M., Kennedy, K. M., Devous, M. D., Rieck, J. R., Hebrank, A. C., Diaz-Arrastia, R., Mathews, D., & Park, D. C. (2012) · Neurology · doi:10.1212/wnl.0b013e318245d295 · Cited by 419
A meta-analysis of diffusion tensor imaging in mild cognitive impairment and Alzheimer's disease
Sexton, C. E., Kalu, U. G., Filippini, N., Mackay, C. E., & Ebmeier, K. P. (2011) · Neurobiology of Aging · doi:10.1016/j.neurobiolaging.2010.05.019 · Cited by 410
Relation of cognitive activity to risk of developing Alzheimer disease
Wilson, R. S., Scherr, P. A., Schneider, J. A., Tang, Y., & Bennett, D. A. (2007) · Neurology · doi:10.1212/01.wnl.0000271087.67782.cb · Cited by 400
Jones, D. K., & Leemans, A. (2010) · Methods in molecular biology · doi:10.1007/978-1-61737-992-5_6 · Cited by 391
Deformable Registration of Diffusion Tensor MR Images with Explicit Orientation Optimization
Zhang, H. G., Yushkevich, P. A., & Gee, J. C. (2005) · Lecture notes in computer science · doi:10.1007/11566465_22 · Cited by 389
Dissecting phenotypic traits linked to human resilience to Alzheimer’s pathology
Perez-Nievas, B. G., Stein, T. D., Tai, H.-C., Dols-Icardo, O., Scotton, T. C., Barroeta-Espar, I., Fernandez-Carballo, L., de Munain, E. L., Perez, J., Marquie, M., et al. (2013) · Brain · doi:10.1093/brain/awt171 · Cited by 387
Villain, N., Desgranges, B., Viader, F., de la Sayette, V., Mezenge, F., Landeau, B., Baron, J.-C., Eustache, F., & Chetelat, G. (2008) · Journal of Neuroscience · doi:10.1523/jneurosci.1392-08.2008 · Cited by 366
White matter damage on diffusion tensor imaging correlates with age-related cognitive decline
Charlton, R. A., Barrick, T. R., McIntyre, D. J., Shen, Y., O'Sullivan, M., Howe, F. A., Clark, C. A., Morris, R. G., & Markus, H. S. (2006) · Neurology · doi:10.1212/01.wnl.0000194256.15247.83 · Cited by 354 · cited 2×
“The potential predictive power of DTI on cognition has been less explored, but there is evidence that DTI values correlate with decline in working memory in healthy elderly (Bendlin et al., 2010a; Charlton et al., 2006; Pfefferbaum et al., 2000; Raz et al., 2010), and significant correlations between measures of white…”
Effectiveness of regional DTI measures in distinguishing Alzheimer’s disease, MCI, and normal aging
Nir, T. M., Jahanshad, N., Villalon-Reina, J. E., Toga, A. W., Jack, C. R., Weiner, M. W., & Thompson, P. M. (2013) · NeuroImage: Clinical · doi:10.1016/j.nicl.2013.07.006 · Cited by 348
Sullivan, E. V., Rohlfing, T., & Pfefferbaum, A. (2010) · Neurobiology of Aging · doi:10.1016/j.neurobiolaging.2008.04.007 · Cited by 346
Investigation of MS normal-appearing brain using diffusion tensor MRI with clinical correlations
Ciccarelli, O., Werring, D. J., Wheeler‐Kingshott, C. A. M. G., Barker, G. J., Parker, G. J. M., Thompson, A. J., & Miller, D. H. (2001) · Neurology · doi:10.1212/wnl.56.7.926 · Cited by 342
Hoeft, F., Barnea‐Goraly, N., Haas, B. W., Golarai, G., Ng, D., Mills, D. L., Korenberg, J. R., Bellugi, U., Galaburda, A. M., & Reiss, A. L. (2007) · Journal of Neuroscience · doi:10.1523/jneurosci.3591-07.2007 · Cited by 305
Lutz, J., Jäger, L., de Quervain, D. J. ‐., Krauseneck, T., Padberg, F., Wichnalek, M., Beyer, A., Stahl, R., Zirngibl, B., Morhard, D., et al. (2008) · Arthritis & Rheumatism · doi:10.1002/art.24070 · Cited by 292
Ringman, J. M., O'Neill, J., Geschwind, D., Medina, L., Apostolova, L. G., Rodriguez, Y., Schaffer, B., Varpetian, A., Tseng, B., Ortiz, F., et al. (2007) · Brain · doi:10.1093/brain/awm102 · Cited by 290
White matter hyperintensities and cognition: Testing the reserve hypothesis
Brickman, A. M., Siedlecki, K. L., Muraskin, J., Manly, J. J., Luchsinger, J. A., Yeung, L., Brown, T. R., DeCarli, C. S., & Stern, Y. (2009) · Neurobiology of Aging · doi:10.1016/j.neurobiolaging.2009.10.013 · Cited by 279
Diffusion tensor imaging in mild cognitive impairment and Alzheimerʼs disease: a review
Chua, T. C., Wen, W., Slavin, M. J., & Sachdev, P. S. (2008) · Current Opinion in Neurology · doi:10.1097/wco.0b013e3282f4594b · Cited by 273
Cerebral White Matter Integrity Mediates Adult Age Differences in Cognitive Performance
Madden, D. J., Spaniol, J., Costello, M. C., Bucur, B., White, L. E., Cabeza, R., Davis, S. W., Dennis, N. A., Provenzale, J. M., & Huettel, S. A. (2008) · Journal of Cognitive Neuroscience · doi:10.1162/jocn.2009.21047 · Cited by 265
Zhang, H. G., Avants, B., Yushkevich, P. A., Woo, J. H., Wang, S., McCluskey, L. F., Elman, L. B., Melhem, E. R., & Gee, J. C. (2007) · IEEE Transactions on Medical Imaging · doi:10.1109/tmi.2007.906784 · Cited by 263
Cognitive reserve: Implications for diagnosis and prevention of Alzheimer’s disease
Scarmeas, N., & Stern, Y. (2004) · Current Neurology and Neuroscience Reports · doi:10.1007/s11910-004-0084-7 · Cited by 260
Liu, Y., Spulber, G., Lehtimäki, K. K., Könönen, M., Hallikainen, I., Gröhn, H., Kivipelto, M., Hallikainen, M., Vanninen, R., & Soininen, H. (2011) · Neurobiology of Aging · doi:10.1016/j.neurobiolaging.2009.10.006 · Cited by 236
Voxel-based analysis of PET amyloid ligand [ 11 C]PIB uptake in Alzheimer disease
Kemppainen, N. M., Aalto, S., Wilson, I. A., Någren, K., Helin, S., Brück, A., Oikonen, V., Kailajärvi, M., Scheinin, M., Viitanen, M. H., et al. (2006) · Neurology · doi:10.1212/01.wnl.0000240117.55680.0a · Cited by 227
Regionally-specific diffusion tensor imaging in mild cognitive impairment and Alzheimer’s disease.
Mielke, M. M., Kozauer, N. A., Chan, K. C. G., George, M., Toroney, J., Zerrate, M., Bandeen-Roche, K., Wang, M.-C., vanZijl, P., & Pekar, J. J. (2009) · NeuroImage · doi:10.1016/j.neuroimage.2009.01.054 · Cited by 225
Sager, M. A., Hermann, B. P., & Rue, A. L. (2005) · Journal of Geriatric Psychiatry and Neurology · doi:10.1177/0891988705281882 · Cited by 224
Self-citationCo-Localization of Amyloid Beta and Tau Pathology in Alzheimer's Disease Synaptosomes
Fein, J. A., Sokolow, S., Miller, C. A., Vinters, H. V., Yang, F., Cole, G. M., & Gylys, K. H. (2008) · American Journal Of Pathology · doi:10.2353/ajpath.2008.070829 · Cited by 218
Amyloid burden and neural function in people at risk for Alzheimer's Disease
Johnson, S. C., Christian, B. T., Okonkwo, O. C., Oh, J. M., Harding, S., Xu, G., Hillmer, A. T., Wooten, D. W., Murali, D., Barnhart, T. E., et al. (2014) · Neurobiology of Aging · doi:10.1016/j.neurobiolaging.2013.09.028 · Cited by 218
Self-citationDiffusion barriers evoked in the rat cortex by reactive astrogliosis
Roitbak, T., & Sykov�, E. (1999) · Glia · doi:10.1002/(sici)1098-1136(199910)28:1 · Cited by 211
Ryan, N. S., Keihaninejad, S., Shakespeare, T. J., Lehmann, M., Crutch, S. J., Malone, I. B., Thornton, J. S., Mancini, L., Hyare, H., Yousry, T., et al. (2013) · Brain · doi:10.1093/brain/awt065 · Cited by 205
Bendlin, B. B., Fitzgerald, M. E., Ries, M. L., Xu, G., Kastman, E. K., Thiel, B., Rowley, H. A., Lazar, M., Alexander, A. L., & Johnson, S. C. (2010) · Developmental Neuropsychology · doi:10.1080/87565641003696775 · Cited by 199
Self-citationNeuropsychological Assessment, Fourth Edition
Kapur, N. (2005) · Journal of Neurology · doi:10.1007/s00415-005-0003-0 · Cited by 189
Aβ-independent processes—rethinking preclinical AD
Chételat, G. (2013) · Nature Reviews Neurology · doi:10.1038/nrneurol.2013.21 · Cited by 184
AMNESIA IN MAN FOLLOWING TRANSECTION OF THE FORNIX
Gaffan, D., & Gaffan, E. A. (1991) · Brain · doi:10.1093/brain/114.6.2611 · Cited by 182
The Auditory-Verbal Learning Test (AVLT): Norms for ages 55 years and older.
Ivnik, R. J., Malec, J. F., Tangalos, E. G., Petersen, R. C., Kokmen, E., & Kurland, L. T. (1990) · Psychological Assessment · doi:10.1037/1040-3590.2.3.304 · Cited by 179
Song, S.-K., Kim, J. H., Lin, S.-J., Brendza, R. P., & Holtzman, D. M. (2004) · Neurobiology of Disease · doi:10.1016/j.nbd.2003.12.003 · Cited by 170
Multivariate network analysis of fiber tract integrity in Alzheimer’s disease
Teipel, S. J., Stahl, R., Dietrich, O., Schoenberg, S. O., Perneczky, R., Bokde, A. L. W., Reiser, M. F., Möller, H., & Hampel, H. J. (2006) · NeuroImage · doi:10.1016/j.neuroimage.2006.07.047 · Cited by 169
Bound pool fractions complement diffusion measures to describe white matter micro and macrostructure
Stikov, N., Perry, L. M., Mezer, A., Rykhlevskaia, E. I., Wandell, B. A., Pauly, J. M., & Dougherty, R. F. (2010) · NeuroImage · doi:10.1016/j.neuroimage.2010.08.068 · Cited by 145
White matter abnormalities observed in bipolar disorder: a diffusion tensor imaging study
Yurgelun-Todd, D. A., Silveri, M. M., Gruber, S. A., Rohan, M. L., & Pimentel, P. (2007) · Bipolar Disorders · doi:10.1111/j.1399-5618.2007.00395.x · Cited by 139
Wu, T. C., Wilde, E. A., Bigler, E. D., Yallampalli, R., McCauley, S. R., Troyanskaya, M., Chu, Z. D., Li, X., Hanten, G. R., Hunter, J. V., et al. (2009) · Journal of Neurotrauma · doi:10.1089/neu.2009.1110 · Cited by 138
White matter is altered with parental family history of Alzheimer's disease
Bendlin, B. B., Ries, M. L., Canu, E., Sodhi, A., Lazar, M., Alexander, A. L., Carlsson, C. M., Sager, M. A., Asthana, S., & Johnson, S. C. (2010) · Alzheimer s & Dementia · doi:10.1016/j.jalz.2009.11.003 · Cited by 130
Self-citationResponses of Glial Cells to Stress and Glucocorticoids
Jáuregui-Huerta, F., Ruvalcaba-Delgadillo, Y., González-Pérez, Ó., González-Castañeda, R. E., Garcı́a‐Estrada, J., & Luquı́n, S. (2010) · Current Immunology Reviews · doi:10.2174/157339510791823790 · Cited by 127
Sun, S.-W., Song, S.-K., Harms, M. P., Lin, S.-J., Holtzman, D. M., Merchant, K. M., & Kotyk, J. J. (2005) · Experimental Neurology · doi:10.1016/j.expneurol.2004.09.006 · Cited by 121
DTI registration in atlas based fiber analysis of infantile Krabbe disease
Wang, Y., Gupta, A., Liu, Z., Zhang, H. G., Escolar, M. L., Gilmore, J. H., Gouttard, S., Fillard, P., Maltbie, E. A., Gerig, G., et al. (2011) · NeuroImage · doi:10.1016/j.neuroimage.2011.01.038 · Cited by 120
Ziolko, S. K., Weissfeld, L. A., Klunk, W. E., Mathis, C. A., Hoge, J. A., Lopresti, B. J., DeKosky, S. T., & Price, J. C. (2006) · NeuroImage · doi:10.1016/j.neuroimage.2006.05.063 · Cited by 119
Rodríguez, J. J., Witton, J., Olabarria, M., Noristani, H. N., & Verkhratsky, A. (2010) · Cell Death & Disease · doi:10.1038/cddis.2009.2 · Cited by 114
Copenhaver, B. R., Rabin, L. A., Saykin, A. J., Roth, R. M., Wishart, H. A., Flashman, L. A., Santulli, R. B., McHugh, T. L., & Mamourian, A. C. (2006) · Psychiatry Research Neuroimaging · doi:10.1016/j.pscychresns.2006.01.015 · Cited by 112 · cited 1×
“Volume decreases of the fornix have been demonstrated in AD (Copenhaver et al., 2006) and damage to the fornix has been shown to be associated with memory deficits (Gaffan and Gaffan, 1991).”
Mulkern, R. V., Zengingönül, H. P., Robertson, R. L., Bogner, P., Zou, K. H., Guðbjartsson, H., Guttmann, C. R. G., Holtzman, D. H., Kyriakos, W. E., Jolesz, F. A., et al. (2000) · Magnetic Resonance in Medicine · doi:10.1002/1522-2594(200008)44:2 · Cited by 111
Self-citationMedical Image Computing and Computer-Assisted Intervention – MICCAI 2007
Ayache, N., Sebastien Ourselin, A., & Maeder, A. (2007) · Lecture notes in computer science · doi:10.1007/978-3-540-75759-7 · Cited by 110
Radon in homes--a possible cause of lung cancer.
Edling, C., Kling, H., & Axelson, O. (1984) · Scandinavian Journal of Work Environment & Health · doi:10.5271/sjweh.2366 · Cited by 108
Effect of parental family history of Alzheimer's disease on serial position profiles
Rue, A. L., Hermann, B. P., Jones, J. E., Johnson, S. C., Asthana, S., & Sager, M. A. (2008) · Alzheimer s & Dementia · doi:10.1016/j.jalz.2008.03.009 · Cited by 100
Self-citationTovar-Moll, F. F., Evangelou, I. E., Chiu, A. W., Richert, N. D., Ostuni, J. L., Ohayon, J. M., Auh, S., Ehrmantraut, M. E., Talagala, S. L., McFarland, H. F., et al. (2009) · American Journal of Neuroradiology · doi:10.3174/ajnr.a1564 · Cited by 92
Elastic Matching of Diffusion Tensor Images
Alexander, D. C., & Gee, J. C. (2000) · Computer Vision and Image Understanding · doi:10.1006/cviu.1999.0817 · Cited by 90
Effects of beta-amyloid accumulation on neural function during encoding across the adult lifespan
Kennedy, K. M., Rodrigue, K. M., Devous, M. D., Hebrank, A. C., Bischof, G. N., & Park, D. C. (2012) · NeuroImage · doi:10.1016/j.neuroimage.2012.03.077 · Cited by 87
Hagen, K., Ehlis, A., Haeussinger, F. B., Heinzel, S., Dresler, T., Mueller, L., Herrmann, M. J., Fallgatter, A. J., & Metzger, F. G. (2013) · NeuroImage · doi:10.1016/j.neuroimage.2013.09.014 · Cited by 87
Chao, L. L., DeCarli, C. S., Kriger, S., Truran, D., Zhang, Y., Laxamana, J., Villeneuve, S., Jagust, W. J., Sanossian, N., Mack, W. J., et al. (2013) · PLoS ONE · doi:10.1371/journal.pone.0065175 · Cited by 85
The Fornix Sign: A Potential Sign for Alzheimer's Disease Based on Diffusion Tensor Imaging
Oishi, K., Mielke, M. M., Albert, M., Lyketsos, C. G., & Mori, S. (2011) · Journal of Neuroimaging · doi:10.1111/j.1552-6569.2011.00633.x · Cited by 84
Unbiased White Matter Atlas Construction Using Diffusion Tensor Images
Zhang, H. G., Yushkevich, P. A., Rueckert, D., & Gee, J. C. (2007) · Springer eBooks · doi:10.1007/978-3-540-75759-7_26 · Cited by 81
Diffusion tensor MRI to investigate dementias: a brief review
Bozzali, M., & Cherubini, A. (2007) · Magnetic Resonance Imaging · doi:10.1016/j.mri.2007.03.017 · Cited by 80
Gray and white matter degeneration revealed by diffusion in an Alzheimer mouse model
Zerbi, V., Kleinnijenhuis, M., Fang, X., Jansen, D., Veltien, A., Van Asten, J., Timmer, N., Dederen, P. J., Kiliaan, A. J., & Heerschap, A. (2013) · Neurobiology of Aging · doi:10.1016/j.neurobiolaging.2012.11.017 · Cited by 74
Hannoun, S., Durand‐Dubief, F., Confavreux, C., Ibarrola, D., Streichenberger, N., Cotton, F., Guttmann, C. R. G., & Sappey‐Marinier, D. (2012) · American Journal of Neuroradiology · doi:10.3174/ajnr.a2983 · Cited by 71
A diffusion tensor brain template for Rhesus Macaques
Adluru, N., Zhang, H. G., Fox, A. S., Shelton, S. E., Ennis, C. M., Bartosic, A. M., Oler, J. A., Tromp, D., Zakszewski, E., Gee, J. C., et al. (2011) · NeuroImage · doi:10.1016/j.neuroimage.2011.07.029 · Cited by 68
Self-citationRestricted diffusion in the brain of transgenic mice with cerebral amyloidosis
Mueggler, T., Meyer‐Luehmann, M., Rausch, M., Staufenbiel, M., Jucker, M., & Rudin, M. (2004) · European Journal of Neuroscience · doi:10.1111/j.1460-9568.2004.03534.x · Cited by 58
Lezak (1984) · PubMed · Cited by 48
White Matter Hyperintensities and Cognitive Dysfunction in Alzheimer Disease
Heo, J., Lee, S., Chu, K., Park, H.-J., Shim, J.-Y., & Kim, M. (2009) · Journal of Geriatric Psychiatry and Neurology · doi:10.1177/0891988709335800 · Cited by 43
Qin, Y.-Y., Li, M.-W., Zhang, S., Zhang, Y., Zhao, L.-Y., Lei, H., Oishi, K., & Zhu, W.-Z. (2013) · Neuroradiology · doi:10.1007/s00234-013-1195-0 · Cited by 42
Voxel-based diffusion tensor imaging of an APP/PS1 mouse model of Alzheimer’s disease.
Shu, X., Qin, Y.-Y., Zhang, S., Jiang, J.-J., Zhang, Y., Zhao, L.-Y., Shan, D., & Zhu, W.-Z. (2013) · Molecular Neurobiology · doi:10.1007/s12035-013-8418-6 · Cited by 41
KNIGHT, R., MCMAHON, J., Skeaff, C. M., & Green, T. (2007) · Archives of Clinical Neuropsychology · doi:10.1016/j.acn.2007.03.005 · Cited by 36
Okonkwo, O. C., Oh, J. M., Koscik, R. L., Jonaitis, E. M., Cleary, C. A., Dowling, N. M., Bendlin, B. B., LaRue, A. A., Hermann, B. P., Barnhart, T. E., et al. (2014) · Journal of the International Neuropsychological Society · doi:10.1017/s1355617714000113 · Cited by 31
Self-citationDiffusion tensor magnetic resonance imaging of the brain in app transgenic mice: A cohort study.
Müller, H.-P., Kassubek, J., Vernikouskaya, I., Ludolph, A. C., Stiller, D., & Rasche, V. (2013) · PLoS ONE · doi:10.1371/journal.pone.0067630 · Cited by 22
Thiessen, J. D., Glazner, K. A. C., Nafez, S., Schellenberg, A. E., Buist, R. J., Martin, M., & Albensi, B. C. (2010) · Brain Structure and Function · doi:10.1007/s00429-010-0271-z · Cited by 19
Cognitive and brain reserve and the diagnosis and treatment of preclinical Alzheimer disease
Jicha, G. A., & Rentz, D. M. (2013) · Neurology · doi:10.1212/wnl.0b013e318289714a · Cited by 9
Diffusion tensor imaging in patients with Creutzfeldt-Jakob disease
Fujita, K., Nakane, S., Harada, M., Izumi, Y., & Kaji, R. (2008) · Journal of Neurology Neurosurgery & Psychiatry · doi:10.1136/jnnp.2008.148528 · Cited by 7
White matter hyperintensities and cognitive dysfunction in Alzheimer's disease
Heo, J., Lee, S. T., Chu, K., & Kim, M. H. (2009) · Journal of the Neurological Sciences · doi:10.1016/j.jns.2009.02.178 · Cited by 2
Worsley (1996) · doi:10.1002/(sici)1097-0193(1996)4:1
Cited by
Sorted by citations
White-matter integrity on DTI and the pathologic staging of Alzheimer’s disease
Kantarci, K., Murray, M. E., Schwarz, C. G., Reid, R. I., Przybelski, S. A., Lesnick, T., Zuk, S. M., Raman, M. R., Senjem, M. L., Gunter, J. L., et al. (2017) · Neurobiology of Aging · doi:10.1016/j.neurobiolaging.2017.04.024 · Cited by 205
Cortical microstructural changes along the Alzheimer’s disease continuum
Montal, V., Vilaplana, E., Alcolea, D., Pegueroles, J., Pasternak, O., González‐Ortiz, S., Clarimón, J., Carmona‐Iragui, M., Illán‐Gala, I., Morenas‐Rodríguez, E., et al. (2018) · Alzheimer's & Dementia · doi:10.1016/j.jalz.2017.09.013 · Cited by 204
Gong, N.-J., Dibb, R., Bulk, M., van der Weerd, L., & Liu, C. (2019) · NeuroImage · doi:10.1016/j.neuroimage.2019.02.019 · Cited by 162
Multimodal neuroimaging computing: a review of the applications in neuropsychiatric disorders
Liu, S., Cai, W., Liu, S., Zhang, F., FULHAM, M., Feng, D., Pujol, S., & Kikinis, R. (2015) · Brain Informatics · doi:10.1007/s40708-015-0019-x · Cited by 150
Teipel, S. J., Grothe, M. J., Zhou, J. H., Sepulcre, J., Dyrba, M., Sorg, C., & Babiloni, C. (2016) · Journal of the International Neuropsychological Society · doi:10.1017/s1355617715000995 · Cited by 117
Metadata
- Authors
- Racine, A. M., Adluru, N., Alexander, A. L., Christian, B. T., Okonkwo, O. C., Oh, J., Cleary, C. A., Birdsill, A., Hillmer, A. T., Murali, D., Barnhart, T. E., Gallagher, C. L., Carlsson, C. M., Rowley, H. A., Dowling, N. M., Asthana, S., Sager, M. A., Bendlin, B. B., & Johnson, S. C.
- Affiliations
- University of Wisconsin–Madison (US)
- University of Wisconsin System (US)
- Corresponding author
- Johnson, Sterling C.
- ORCID
- Venue
- NeuroImage: Clinical
- Publisher
- Elsevier BV
- Published
- 2014
- Volume
- 4
- Pages
- 604-614
- ISSN
- 2213-1582 (ISSN-L)
- PMC
- PMC4053642
- OpenAlex
- W2060171712
- Cited by
- 136
- References
- 100
- Citations by year
- 2026: 7 · 2025: 8 · 2024: 11 · 2023: 7 · 2022: 7 · 2021: 11 · 2020: 15 · 2019: 12 · 2018: 16 · 2017: 12 · 2016: 11 · 2015: 15 · 2014: 2
- FWCI
- 10.18
- Type
- journal article
- Language
- en
- Open access
- gold
- doi.org
- Licence
- Locations
- NeuroImage Clinical (publishedVersion, cc-by-nc-nd)
- Europe PMC (PubMed Central) (publishedVersion, cc-by-nc-nd)
- PubMed Central (publishedVersion, cc-by-nc-nd)
- PubMed (publishedVersion)
- DOAJ (DOAJ: Directory of Open Access Journals) (submittedVersion, cc-by-sa)
- Funders
- NIH (AG021155, AG000213, AG027161, AG037639, AG033514)
- Veterans Administration Merit Review Grant (I01CX000165)
- Alzheimer's Association
- Clinical and Translational Science Award (UL1RR025011)
- University of Wisconsin, Madison
- NSF (0849122)
- Helen Bader Foundation
- Northwestern Mutual Foundation
- Extendicare Foundation
- Veterans Administration
- Waisman Center, University of Wisconsin-Madison
- Topics
- Health Sciences › Medicine › Psychiatry and Mental health › Dementia and Cognitive Impairment Research
- Health Sciences › Medicine › Radiology, Nuclear Medicine and Imaging › Advanced Neuroimaging Techniques and Applications
- Life Sciences › Neuroscience › Cellular and Molecular Neuroscience › Alzheimer's disease research and treatments
- Keywords
- preclinical Alzheimer's disease, brain amyloid burden, white matter microstructure, diffusion tensor imaging, fractional anisotropy, mean diffusivity, PiB PET, Pittsburgh compound B, cingulum, Wisconsin Registry for Alzheimer's Prevention, multimodal neuroimaging, compensatory mechanisms
- MeSH terms
- Aged, Alzheimer Disease, Brain, Female, Humans, Male, Middle Aged, Sensitivity and Specificity, Reproducibility of Results, Amyloid beta-Peptides, Positron-Emission Tomography, Diffusion Tensor Imaging, Molecular Imaging, Multimodal Imaging, White Matter
About these checks
Registry, retraction, Cites and statistics results are computed, not judged, with one exception: a printed reference that no index lists is read once by a model before it counts as a citation error. Claims are extracted by a model and kept only when their quote appears verbatim in the text; each cited source is then checked, with a model’s help, for whether it says what the claim relies on. Those verdicts can be wrong — read the claim’s quote and the cited source before relying on one.
Statistics and arithmetic are recomputed, not judged.
Confidence bands are shown only for fields calibrated on our annotated test set. None is calibrated yet, so no band is shown.
What counts as a claim ›How we measure confidence ›How we check this ›
Are you an author, or do you see a problem with this page? Request a review
