

The DOI matches its Crossref record; 81 of the 81 references it cites were found in a registry or an index; none of the 71 sources its claims cite is checked for support yet.
Geochronological Constraints on the Evolution and Petrogenesis of the Malwa Plateau Subprovince of the Deccan Traps
Open accessAbstract
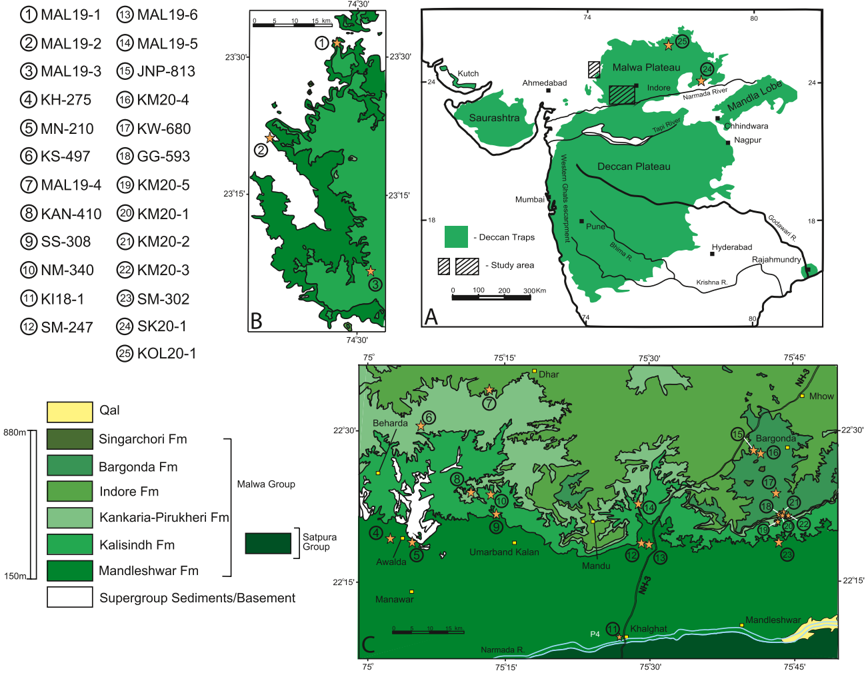
The eruptive history of the Malwa Plateau Subprovince of the Deccan Traps is addressed by dating 21 lavas spanning the exposed stratigraphic extent, using the 40 Ar/ 39 Ar method applied to plagioclase separates. Major, minor, and trace element geochemistry was determined for each of the dated lavas and four additional ones. Dating results indicate that the eruptions began prior to 66.8 Ma, at least 400 ka before the oldest known lava in the more extensively studied Western Ghats, representative of the main Deccan province, to the south. Eruption rates peaked from 66.4 to 66.3 Ma and then diminished until 65.6 Ma. The peak in eruption rates coincides with the well‐documented Late Maastrichtian Warming event. Malwa lavas show some major and trace element affinities with geochemically defined lava flow formations of the Western Ghats, but are generally out of the stratigraphic sequence manifest in the Western Ghats. The distinct geochemical evolution of Malwa Plateau lavas compared with those of the Western Ghats is at least in part a consequence of differences in crustal composition between the two subprovinces. Modeling of REE concentration patterns of Malwa lavas suggests that they were derived by slightly lower degrees of partial melting, at lower mantle temperatures and depths, than those in the Western Ghats. The Malwa Plateau thus appears to record an earlier, cooler stage of the Deccan plume's evolution and continued to erupt through a large part of the lifetime of the main Deccan province.
Overview
CoChat Summary
Written by AI from the paper’s full text.
TL;DR
New 40Ar/39Ar plagioclase ages and geochemistry for 25 Malwa Plateau lavas show Deccan volcanism there began by 66.834 ± 0.075 Ma, at least ~400 ka before the oldest dated Western Ghats lavas, peaked at 66.4–66.3 Ma, and continued to 65.6 Ma. Malwa lavas are geochemically distinct from Western Ghats chemotypes, and REE modeling suggests lower-degree, lower-temperature, shallower melting consistent with an earlier, cooler stage of the Deccan plume.
Key findings
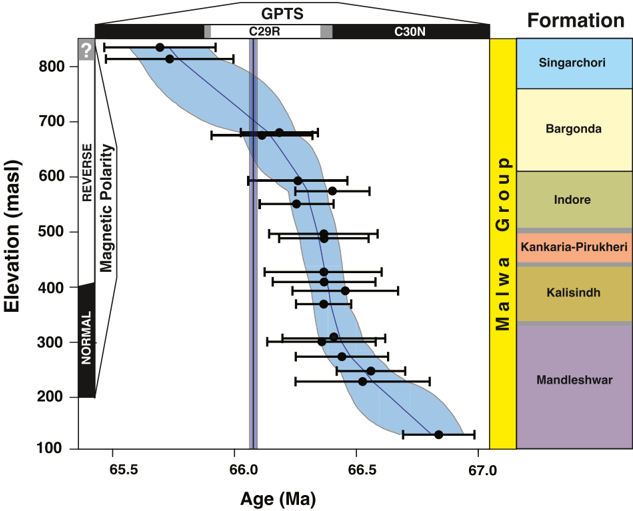
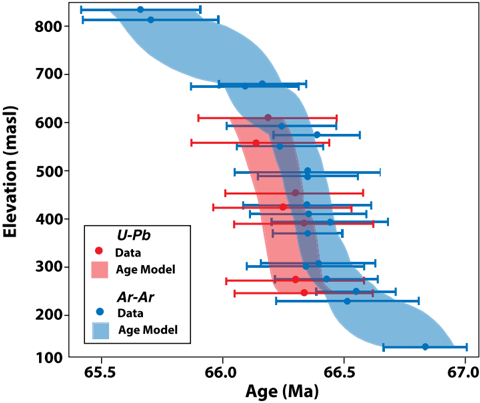
- 40Ar/39Ar dating of 21 lavas spanning the exposed stratigraphic extent shows eruptions began prior to 66.8 Ma; the oldest sample, KI18-1 of the Mandleshwar Formation, gives 66.834 ± 0.075 Ma (1σ analytical), at least 400 ka older than the oldest high-precision Western Ghats age of 66.413 ± 0.067 Ma (Sprain et al., 2019). Exposed southern Malwa lavas span ~700 m elevation and roughly 1 million years, with quasi-continuous eruptions for ~350,000 years leading up to the KPB; eruption rates peaked from 66.4 to 66.3 Ma and then diminished until 65.6 Ma, coinciding with the Late Maastrichtian Warming event.
- All but one analyzed sample are tholeiitic basalts or basaltic andesites with SiO2 49.3–54.2 wt% on a volatile-free basis; except topmost JNP-813 (TiO2 = 0.99 wt%, FeO = 10.8 wt%, MgO = 6.8 wt%), samples are high in TiO2 (2.3–3.3 wt%) and FeO (10.7–15.7 wt%) and low in MgO (3.8–6.9 wt%). One alkaline trachybasalt, MAL19-2 (66.51 ± 0.28 Ma), has strong LREE/HREE enrichment (La/Lu = 109.6).
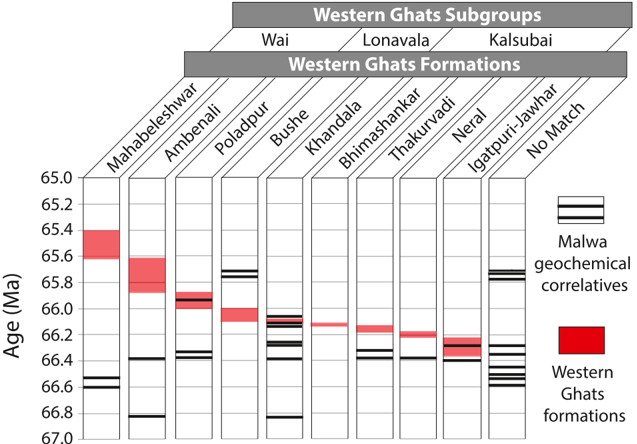
- Discriminant-function analysis returns some Malwa correlations to Western Ghats chemotypes, but many samples do not reliably match any chemotype and several matches are out of stratigraphic order; Khandala chemotypes erupted earlier in Malwa (66.8–66.2 Ma) than in the Western Ghats (66.2–66.1 Ma), while Bushe-like lavas erupted slightly later in Malwa (65.9–65.8 Ma) than in the Western Ghats (66.1–66.0 Ma).
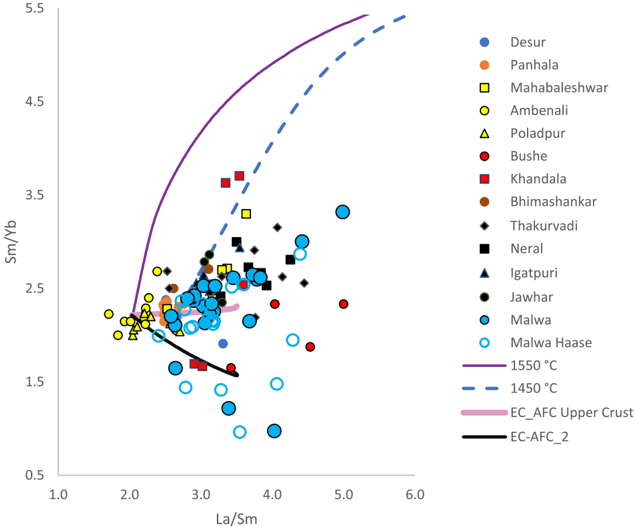
- REE modeling suggests Malwa lavas were derived by slightly lower degrees of partial melting, at lower mantle temperatures and depths, than Western Ghats lavas; Malwa thus appears to record an earlier, cooler stage of the Deccan plume’s evolution and continued erupting through a large part of the main Deccan province’s lifetime.
Methods
- Collected 25 lava samples from Malwa Plateau outcrops, predominantly in the southern region; 21 were selected for 40Ar/39Ar dating, and four were unsuitable due to plagioclase inclusions or alteration. Seven plagioclase megacrystic basalts had geochemistry previously presented by Marzoli et al. (2022).
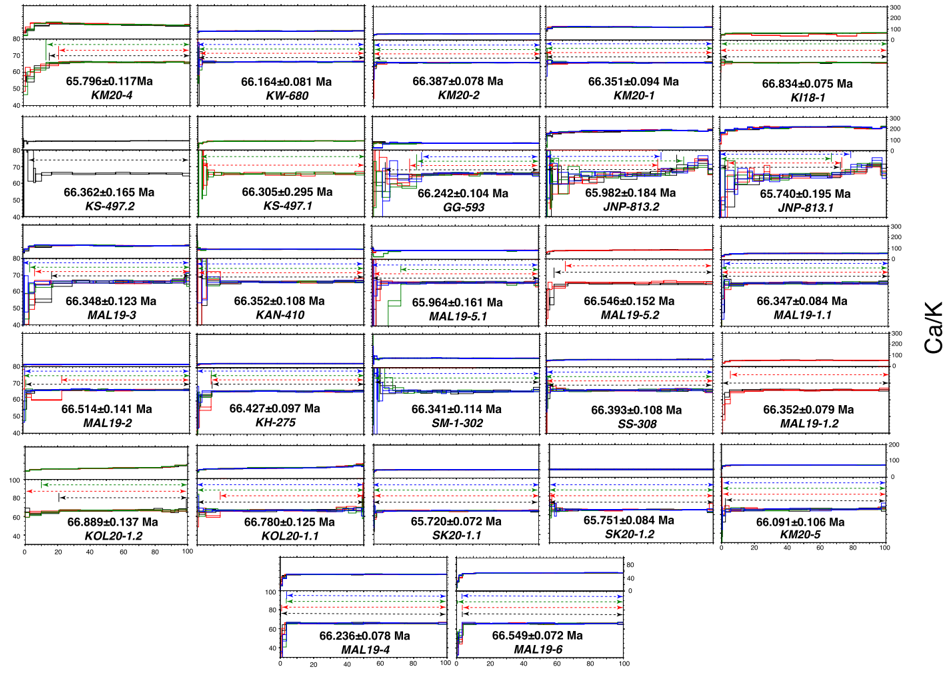
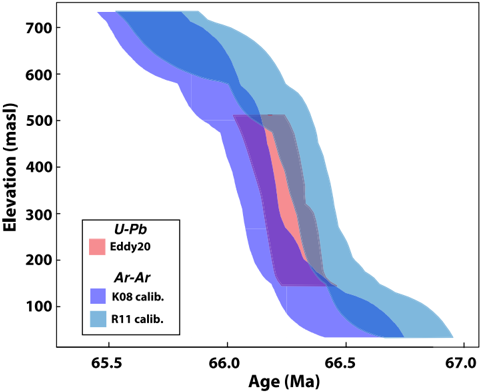
- 40Ar/39Ar dating used plagioclase separates co-irradiated with Fish Canyon sanidine in four separate 7 hr irradiations in the CLICIT facility of the Oregon State University TRIGA reactor; 4–8 aliquots per sample were analyzed in 12–15 step incremental CO2 laser heating experiments at the Berkeley Geochronology Center using a MAP 215C mass spectrometer. Weighted mean plateau ages are based on the Renne et al. (2011) calibration, and age models were produced with Chron.jl using sample elevations and 2σ weighted mean plateau ages including systematic uncertainties.
- Whole-rock major and trace element data were obtained on all 25 samples by XRF and ICP-MS at the Washington State University GeoAnalytical Lab; data were compared with Western Ghats chemotypes via discriminant-function analysis in SPSS v.27 following Peng et al. (1998) and Vanderkluysen et al. (2011), and REE patterns were modeled with REEBOX PRO and EC-AFC.
Limitations
- Stated: the duration of the waxing and waning phases of eruption rate is poorly constrained because of unknown erosion and the undated lava section below the lowest dated flow at the Narmada River; two dated samples (KOL20-1 and SK20-1) cannot be confidently placed in the age model.
- Stated: current age resolution permits only coarse climate modeling via geochemical box models, and there remains disagreement between pulsed versus quasi-continuous eruptive tempo; intercalibration uncertainties between 40Ar/39Ar and U-Pb dating persist, with offsets depending on whether the Renne et al. (2011) or Kuiper et al. (2008) calibration is used.
- Evident: sampling is concentrated in the southern Malwa Plateau where sections are least faulted and expose the maximum elevation range; geochemical correlations rely on liberal DFA criteria (Mahalanobis distance <20), and the paper notes that differences in Ti, Zr/Y, and Nb/La cast doubt on almost every correlation. The study also does not directly bear on the pulsed versus quasi-continuous eruptive tempo of the LIP as a whole.
Model-written summary. Check it against the paper before relying on it.
Integrity signals
Registry
Cites
Statistics
Figures




Verification
Claims the paper makes
38 Own result · 30 Own interpretation · 16 No full text of the sources · 13 Check pending · 12 Not checked yet · 4 Sources not found · 2 Own method · 1 No basis given
A result the paper reports from its own data — it cites no other source for it, so there is none to check. The quote shows it is in the paper.
In the paper
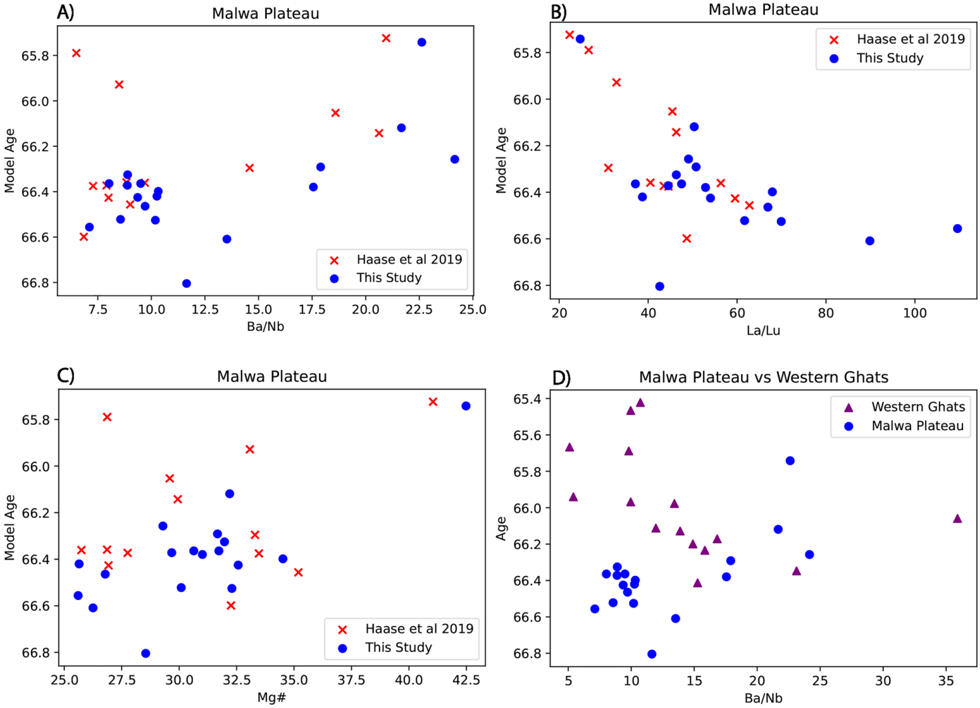
“Most samples that return a reasonable chemical correlation to a Western Ghat chemotype are vastly different in terms of their age relative to its counterpart in the main Deccan Plateau (Figure 6).”
§ Geochronological Constraints on the Evolution and Petrogenesis of the Malwa Plateau Subprovince of the Deccan Traps > 4.2. Geochemistry Results
plainstates an association- Asserted: passes — The authors put it forward as true.
- Checkable: passes — It can be checked against evidence.
- Load-bearing: passes — The paper’s conclusions depend on it.
- Based: passes — The paper gives a reason why it holds.
A result the paper reports from its own data — it cites no other source for it, so there is none to check. The quote shows it is in the paper.
In the paper
“Eruptions began as early as 66.834 ± 0.075 Ma (1σ analytical uncertainty) as indicated by the weighted mean plateau age for sample KI18-1 of the Mandleshwar Formation, sampled a few meters above the Narmada River representing the lowest exposed lava in this vicinity.”
§ Geochronological Constraints on the Evolution and Petrogenesis of the Malwa Plateau Subprovince of the Deccan Traps > 4.1. Geochronology Results
hedgedstates a causeSingle case- Asserted: passes — The authors put it forward as true.
- Checkable: passes — It can be checked against evidence.
- Load-bearing: passes — The paper’s conclusions depend on it.
- Based: passes — The paper gives a reason why it holds.
In the paper
“Overall, our major, minor, and trace element data overlap substantially with those of Haase et al. (2019) for the Malwa Plateau (Figure 4).”
§ Geochronological Constraints on the Evolution and Petrogenesis of the Malwa Plateau Subprovince of the Deccan Traps > 4.2. Geochemistry Results
What the sources say
- Not checked — no full text of the sourcecites Haase et al., 2019 source
plainstates an association- Asserted: passes — The authors put it forward as true.
- Checkable: passes — It can be checked against evidence.
- Load-bearing: unclear — It is unclear whether the paper’s conclusions depend on it.
- Based: passes — The paper gives a reason why it holds.
A result the paper states — it cites no source for it, so there is none to check. The quote shows it is in the paper.
In the paper
“The youngest Malwa basalts also overlap with Bushe basalts from the Western Ghats in low TiO 2 contents and enriched Sr-Nd isotopic compositions.”
§ Geochronological Constraints on the Evolution and Petrogenesis of the Malwa Plateau Subprovince of the Deccan Traps > 5.1. Rates of Chemical Variability
plainstates an association- Asserted: passes — The authors put it forward as true.
- Checkable: passes — It can be checked against evidence.
- Load-bearing: passes — The paper’s conclusions depend on it.
- Based: passes — The paper gives a reason why it holds.
A result the paper reports from its own data — it cites no other source for it, so there is none to check. The quote shows it is in the paper.
In the paper
“Results show that lavas currently exposed in the southern MP spanning 700 m in elevation record roughly 1 million years of eruptive history.”
§ Geochronological Constraints on the Evolution and Petrogenesis of the Malwa Plateau Subprovince of the Deccan Traps > 4.1. Geochronology Results
plain- Asserted: passes — The authors put it forward as true.
- Checkable: passes — It can be checked against evidence.
- Load-bearing: passes — The paper’s conclusions depend on it.
- Based: passes — The paper gives a reason why it holds.
- It may state two separate claims as one. 46
- Probably not a substantial claim. 10
Create a free account to see these claims.
Create a free account to see these assumptions.
59 more claims
Create a free account to see all 116 claims and to verify the 23 references still open.
Claims other papers make about this one
Each is checked against this paper’s own text: does it say what the citing paper says it does?
In the citing paper
“At Malwa Plateau, the highest basaltic eruption rates occur ~350 kyr before the K/Pg boundary and at least start ~400 kyr before Western Ghats basalts (11, 27).”
From Earth orbital rhythms links timing of Deccan trap volcanism phases and global climate change (2025) · cites this paper as [27]
In the citing paper
“Recent geochronological studies (Eddy et al., 2020;Patil Pillai et al., 2022;Tholt et al., 2023) demonstrate that longdistance correlations (used in the earlier unified chemostratigraphy and apparently supported by morphological types of the lava flows) are untenable across subprovince limits.”
From Spatio-temporal volume recalibration shows Deccan volcanism caused Terminal Cretaceous Mass Extinction (2026) · cites this paper as Tholt et al., 2023
In the citing paper
“Only the youngest Singarchori Formation of Malwa Group is of Danian age based on two dates (Tholt et al., 2023), namely, the intertrappean fossils and normal polarity (=Chron C29n) of the younger lavas recorded around Sagar (Madhya Pradesh, India; Singh et al., 2024).”
From Spatio-temporal volume recalibration shows Deccan volcanism caused Terminal Cretaceous Mass Extinction (2026) · cites this paper as Tholt et al., 2023
Self-check
Percentages, sums and reported differences re-computed from the paper’s own numbers.
Each contradiction between two passages listed here was confirmed by an independent check.
Rated minor: it would not touch a result — a value no result rests on, a p-value that stays on the same side of the significance level, or a conflict that is clerical, resolved elsewhere in the paper, or outside its own findings.
In the paper
§ Geochronological Constraints on the Evolution and Petrogenesis of the Malwa Plateau Subprovince of the Deccan Traps > 4.1. Geochronology Results
“KM20-4 at 843 masl”
§ Geochronological Constraints on the Evolution and Petrogenesis of the Malwa Plateau Subprovince of the Deccan Traps > 6. Conclusions
“| KM20-4 | 22.4615 | 75.6881 | 835 | 65.796 | 0.117 0.123 |”
Citations
Cites
Sun, S.-S., & McDonough, W. F. (1989) · Geological Society, London, Special Publications · doi:10.1144/gsl.sp.1989.042.01.19 · Cited by 16,410
McDonough, W. F., & Sun, S. (1995) · Chemical Geology · doi:10.1016/0009-2541(94)00140-4 · Cited by 14,231
Composition of the Continental Crust
Rudnick, R. L., & Gao, S. (2003) · Treatise on Geochemistry · doi:10.1016/b0-08-043751-6/03016-4 · Cited by 3,413
Westerhold, T., Marwan, N., Drury, A. J., Liebrand, D., Agnini, C., Anagnostou, E., Barnet, J. S. K., Bohaty, S. M., De Vleeschouwer, D., Florindo, F., et al. (2020) · Science · doi:10.1126/science.aba6853 · Cited by 1,946
Synchronizing Rock Clocks of Earth History
Kuiper, K. F., Deino, A., Hilgen, F. J., Krijgsman, W., Renne, P. R., & Wijbrans, J. R. (2008) · Science · doi:10.1126/science.1154339 · Cited by 1,345
Self-citationVertically extensive and unstable magmatic systems: A unified view of igneous processes
Cashman, K. V., Sparks, R. S. J., & Blundy, J. D. (2017) · Science · doi:10.1126/science.aag3055 · Cited by 1,159
Flood Basalts and Hot-Spot Tracks: Plume Heads and Tails
Richards, M. A., Duncan, R. A., & Courtillot, V. E. (1989) · Science · doi:10.1126/science.246.4926.103 · Cited by 1,137
Renne, P. R., Balco, G., Ludwig, K. R., Mundil, R., & Min, K. (2011) · Geochimica et Cosmochimica Acta · doi:10.1016/j.gca.2011.06.021 · Cited by 712
Self-citationDeccan flood basalts at the Cretaceous/Tertiary boundary?
Courtillot, V., Besse, J., Vandamme, D., Montigny, R., Jaeger, J.-J., & Cappetta, H. (1986) · Earth and Planetary Science Letters · doi:10.1016/0012-821x(86)90118-4 · Cited by 571
U-Pb constraints on pulsed eruption of the Deccan Traps across the end-Cretaceous mass extinction
Schoene, B., Eddy, M. P., Samperton, K. M., Keller, C. B., Keller, G., Adatte, T., & Khadri, S. F. R. (2019) · Science · doi:10.1126/science.aau2422 · Cited by 542
Geochemical characteristics of mid-ocean ridge basalts
Sun, S.-S., Nesbitt, R. W., & Sharaskin, A. Y. (1979) · Earth and Planetary Science Letters · doi:10.1016/0012-821x(79)90013-x · Cited by 532
Rapid eruption of the Deccan flood basalts at the Cretaceous/Tertiary boundary
Duncan, R. A., & Pyle, D. (1988) · Nature · doi:10.1038/333841a0 · Cited by 489
SPECIES: A Spatial Evaluation of Climate Impact on the Envelope of Species
Pearson, R. G., Dawson, T. P., Berry, P. M., & Harrison, P. A. (2002) · Ecological Modelling · doi:10.1016/s0304-3800(02)00056-x · Cited by 479
U-Pb geochronology of the Deccan Traps and relation to the end-Cretaceous mass extinction
Schoene, B., Samperton, K. M., Eddy, M. P., Keller, G., Adatte, T., Bowring, S. A., Khadri, S. F. R., & Gertsch, B. (2015) · Science · doi:10.1126/science.aaa0118 · Cited by 443
Deccan flood basalts and the Cretaceous/Tertiary boundary
Courtillot, V., Féraud, G., Maluski, H., Vandamme, D., Moreau, M. G., & Besse, J. (1988) · Nature · doi:10.1038/333843a0 · Cited by 443
State shift in Deccan volcanism at the Cretaceous-Paleogene boundary, possibly induced by impact
Renne, P. R., Sprain, C. J., Richards, M. A., Self, S., Vanderkluysen, L., & Pande, K. (2015) · Science · doi:10.1126/science.aac7549 · Cited by 431
Self-citationSpera, F. J. (2001) · Journal of Petrology · doi:10.1093/petrology/42.5.999 · Cited by 424
The eruptive tempo of Deccan volcanism in relation to the Cretaceous-Paleogene boundary
Sprain, C. J., Renne, P. R., Vanderkluysen, L., Pande, K., Self, S., & Mittal, T. (2019) · Science · doi:10.1126/science.aav1446 · Cited by 395
Self-citationStratigraphy, composition and form of the Deccan Basalts, Western Ghats, India
Beane, J. E., Turner, C. A., Hooper, P. R., Subbarao, K. V., & Walsh, J. N. (1986) · Bulletin of Volcanology · doi:10.1007/bf01073513 · Cited by 384
CHENET, A., QUIDELLEUR, X., FLUTEAU, F., COURTILLOT, V, & BAJPAI, S. (2007) · Earth and Planetary Science Letters · doi:10.1016/j.epsl.2007.07.011 · Cited by 294
Early and Late Alkali Igneous Pulses and a High-3He Plume Origin for the Deccan Flood Basalts
Basu, A. R., Renne, P. R., DasGupta, D. K., Teichmann, F., & Poreda, R. J. (1993) · Science · doi:10.1126/science.261.5123.902 · Cited by 291
Self-citationSelf, S., Widdowson, M., Thordarson, T., & Jay, A. E. (2006) · Earth and Planetary Science Letters · doi:10.1016/j.epsl.2006.05.041 · Cited by 287
Self-citationOn impact and volcanism across the Cretaceous-Paleogene boundary
Hull, P. M., Bornemann, A., Penman, D. E., Henehan, M. J., Norris, R. D., Wilson, P. A., Blum, P., Alegret, L., Batenburg, S. J., Bown, P. R., et al. (2020) · Science · doi:10.1126/science.aay5055 · Cited by 279
Hofmann, C., Féraud, G., & Courtillot, V. E. (2000) · Earth and Planetary Science Letters · doi:10.1016/s0012-821x(00)00159-x · Cited by 274
Revisions in stratigraphic nomenclature of the Columbia River Basalt Group
Swanson, D. A., Wright, T. L., HOOPER, P. R., & Bentley, R. D. (1979) · doi:10.3133/b1457g · Cited by 261
Vandamme, D., Courtillot, V. E., Besse, J., & Montigny, R. (1991) · Reviews of Geophysics · doi:10.1029/91rg00218 · Cited by 228
Peng, Z. X., Mahoney, J., Hooper, P., Harris, C., & Beane, J. (1994) · Geochimica et Cosmochimica Acta · doi:10.1016/0016-7037(94)90464-2 · Cited by 227
Wilf, P., Johnson, K. R., & Huber, B. T. (2003) · Proceedings of the National Academy of Sciences · doi:10.1073/pnas.0234701100 · Cited by 218
Deccan traps mantle degassing in the terminal Cretaceous marine extinctions
McLean, D. M. (1985) · Cretaceous Research · doi:10.1016/0195-6671(85)90048-5 · Cited by 218
JAY, A. E., & WIDDOWSON, M. (2008) · Journal of the Geological Society · doi:10.1144/0016-76492006-062 · Cited by 211
Triggering of the largest Deccan eruptions by the Chicxulub impact
Richards, M. A., Alvarez, W., Self, S., Karlstrom, L., Renne, P. R., Manga, M., Sprain, C. J., Smit, J., Vanderkluysen, L., & Gibson, S. A. (2015) · Geological Society of America Bulletin · doi:10.1130/b31167.1 · Cited by 210
Self-citationVolcanological and tectonic control of stratigraphy and structure in the western Deccan traps
Devey, C. W., & Lightfoot, P. C. (1986) · Bulletin of Volcanology · doi:10.1007/bf01087674 · Cited by 172
LOSCAR: Long-term Ocean-atmosphere-Sediment CArbon cycle Reservoir Model v2.0.4
Zeebe, R. E. (2012) · Geoscientific model development · doi:10.5194/gmd-5-149-2012 · Cited by 164
Reidel, S. P., Camp, V. E., Tolan, T. L., & Martin, B. S. (2013) · Geological Society of America eBooks · doi:10.1130/2013.2497(01 · Cited by 159
Ray, R., Sheth, H. C., & Mallik, J. (2006) · Bulletin of Volcanology · doi:10.1007/s00445-006-0089-y · Cited by 150
The feeder system of the Deccan Traps (India): insights from dike geochemistry
Vanderkluysen, L., Mahoney, J. J., Hooper, P. R., Sheth, H. C., & Ray, R. (2011) · Journal of Petrology · doi:10.1093/petrology/egq082 · Cited by 145
Self-citationA geological map of the southern Deccan Traps, India and its structural implications
Mitchell, C., & Widdowson, M. (1991) · Journal of the Geological Society · doi:10.1144/gsjgs.148.3.0495 · Cited by 142
Verma, R., & Banerjee, P. (1992) · Tectonophysics · doi:10.1016/0040-1951(92)90121-l · Cited by 135
Age of the Deccan traps using 187Re–187Os systematics
Allègre, C. J., Birck, J. L., Capmas, F., & Courtillot, V (1999) · Earth and Planetary Science Letters · doi:10.1016/s0012-821x(99)00110-7 · Cited by 133
Sprain, C. J., Renne, P. R., Clemens, W. A., & Wilson, G. P. (2018) · GSA Bulletin · doi:10.1130/b31890.1 · Cited by 130
Self-citationPeng, Z. X., Mahoney, J. J., Hooper, P. R., Macdougall, J. D., & Krishnamurthy, P. (1998) · Journal of Geophysical Research: Solid Earth · doi:10.1029/98jb01514 · Cited by 122
Tectonic setting and timing of the final Deccan flood basalt eruptions
Hooper, P., Widdowson, M., & Kelley, S. (2010) · Geology · doi:10.1130/g31072.1 · Cited by 115
Robinson, N., Ravizza, G., Coccioni, R., Peucker-Ehrenbrink, B., & Norris, R. (2009) · Earth and Planetary Science Letters · doi:10.1016/j.epsl.2009.02.019 · Cited by 111
Barnet, J. S. K., Littler, K., Kroon, D., Leng, M. J., Westerhold, T., Röhl, U., & Zachos, J. C. (2018) · Geology · doi:10.1130/g39771.1 · Cited by 111
Sprain, C. J., Renne, P. R., Wilson, G. P., & Clemens, W. A. (2015) · Geological Society of America Bulletin · doi:10.1130/b31076.1 · Cited by 103 · cited 1×
“The Deccan Traps are one of the largest and youngest continental LIPs, and are thus comparatively well exposed and preserved, as is the stratigraphic record of contemporaneous geologic events (Sprain et al., 2015).”
BackgroundSelf-citationEvolution of late Campanian-Maastrichtian marine climates and oceans
Barrera, E., & Savin, S. M. (1999) · Evolution of the Cretaceous Ocean-Climate System · doi:10.1130/0-8137-2332-9.245 · Cited by 93
K–Ar Age of the Deccan Traps, India
Wellman, P., & McElhinny, M. W. (1970) · Nature · doi:10.1038/227595a0 · Cited by 90
Stratigraphy and correlations in Deccan Volcanic Province, India: Quo vadis?
Kale, V. S., Dole, G., Shandilya, P., & Pande, K. (2019) · Geological Society of America Bulletin · doi:10.1130/b35018.1 · Cited by 85
Self-citationBrown, E., & Lesher, C. E. (2016) · Geochemistry Geophysics Geosystems · doi:10.1002/2016gc006579 · Cited by 76
Schöbel, S., de Wall, H., Ganerød, M., Pandit, M. K., & Rolf, C. (2014) · Journal of Asian Earth Sciences · doi:10.1016/j.jseaes.2014.03.022 · Cited by 73
Tobin, T. S., Wilson, G. P., Eiler, J. M., & Hartman, J. H. (2014) · Geology · doi:10.1130/g35262.1 · Cited by 73
Krishnamurthy (2020) · doi:10.1007/s12594-020-1501-5 · Cited by 72
Fendley, I. M., Mittal, T., Sprain, C. J., Marvin-DiPasquale, M., Tobin, T. S., & Renne, P. R. (2019) · Earth and Planetary Science Letters · doi:10.1016/j.epsl.2019.115721 · Cited by 71
Self-citationEddy, M. P., Schoene, B., Samperton, K. M., Keller, G., Adatte, T., & Khadri, S. F. R. (2020) · Earth and Planetary Science Letters · doi:10.1016/j.epsl.2020.116249 · Cited by 66
Developments in Earth Surface Processes, 21
(2016) · Developments in earth surface processes · doi:10.1016/b978-0-444-63787-1.21003-2 · Cited by 65
Developments in the stratigraphy of the Deccan Volcanic Province, peninsular India
Verma, O., & Khosla, A. (2019) · Comptes Rendus Géoscience · doi:10.1016/j.crte.2019.10.002 · Cited by 62
Thermal and Crustal Structure of "SONATA". A Zone of Mid Continental Rifting in Indian Shield
Shanker, R. (1991) · Journal Geological Society of India · doi:10.17491/jgsi/1991/370302 · Cited by 58
K/Ar ages of successive lava flows from the Deccan Traps, India
Kaneoka, I., & Haramura, H. (1973) · Earth and Planetary Science Letters · doi:10.1016/0012-821x(73)90061-7 · Cited by 57
Wilson, G. P. (2005) · Journal of Mammalian Evolution · doi:10.1007/s10914-005-6943-4 · Cited by 57
Spera, F. J., & Bohrson, W. A. (2002) · Geochemistry Geophysics Geosystems · doi:10.1029/2002gc000315 · Cited by 56
Parisio, L., Jourdan, F., Marzoli, A., Melluso, L., Sethna, S. F., & Bellieni, G. (2016) · Journal of the Geological Society · doi:10.1144/jgs2015-133 · Cited by 55
Self-citationChemical and Magnetic Stratigraphy of Parts of Narmada Region, Deccan Basalt Province
Rao, M. S., Reddy, N. R., Subbarao, K. V., Prasad, C. V. R. K., & Radhakrishnamurty, C. (1985) · Journal of the Geological Society of India · doi:10.17491/jgsi/1985/260901 · Cited by 52
Reconciling early Deccan Traps CO 2 outgassing and pre-KPB global climate
Hernandez Nava, A., Black, B. A., Gibson, S. A., Bodnar, R. J., Renne, P. R., & Vanderkluysen, L. (2021) · Proceedings of the National Academy of Sciences · doi:10.1073/pnas.2007797118 · Cited by 52
Self-citationSheth, H. C., Zellmer, G. F., Kshirsagar, P. V., & Cucciniello, C. (2013) · Bulletin of Volcanology · doi:10.1007/s00445-013-0701-x · Cited by 46
Diversity in the peninsular Indian lithosphere revealed from ambient noise and earthquake tomography
Saha, G., Prakasam, K. S., & Rai, S. S. (2020) · Physics of The Earth and Planetary Interiors · doi:10.1016/j.pepi.2020.106523 · Cited by 43
Chron.jl: A Bayesian framework for integrated eruption age and age-depth modellingPreprint
Keller, C. B. (2018) · OSF Preprints (OSF Preprints) · doi:10.17605/osf.io/tqx3f · Cited by 41
Age and duration of Deccan volcanism: K-Ar evidence
Alexander, P. O. (1981) · Cited by 38
Widespread silicic and alkaline magmatism synchronous with the Deccan Traps flood basalts, India
Basu, A. R., Chakrabarty, P., Szymanowski, D., Ibañez-Mejia, M., Schoene, B., Ghosh, N., & Georg, R. B. (2020) · Earth and Planetary Science Letters · doi:10.1016/j.epsl.2020.116616 · Cited by 37
Toward Understanding Deccan Volcanism
Self, S., Mittal, T., Vanderkluysen, L., & Dole, G. (2022) · Annual Review of Earth and Planetary Sciences · doi:10.1146/annurev-earth-012721-051416 · Cited by 37
Self-citationRao, N. V. C., Giri, R. K., Sharma, A., & Pandey, A. (2020) · Episodes · doi:10.18814/epiiugs/2020/020014 · Cited by 33
Callegaro, S., Baker, D. R., Renne, P. R., Melluso, L., Geraki, K., Whitehouse, M. J., De Min, A., & Marzoli, A. (2023) · Science Advances · doi:10.1126/sciadv.adg8284 · Cited by 31
Self-citation40Ar-39Ar age of a lava flow from the Bhimashankar Formation, Giravali Ghat, Deccan Traps
Pande, K., Pattanayak, S. K., Subbarao, K. V., Navaneethakrishnan, P., & Venkatesan, T. R. (2004) · Journal of Earth System Science · doi:10.1007/bf02704034 · Cited by 29
Self-citationRavizza, G., & VonderHaar, D. (2012) · Paleoceanography · doi:10.1029/2012pa002301 · Cited by 28
Haase, K. M., Regelous, M., Schöbel, S., Günther, T., & de Wall, H. (2019) · Earth and Planetary Science Letters · doi:10.1016/j.epsl.2019.115711 · Cited by 23
Marzoli, A., Renne, P. R., Andreasen, R., Spiess, R., Chiaradia, M., Ruth, D. C. S., Tholt, A. J., Pande, K., & Costa, F. (2022) · Journal of Petrology · doi:10.1093/petrology/egac075 · Cited by 20
Self-citationDongre, A. N., Dhote, P., Zamarkar, P., Sangode, S. J., Belyanin, G. A., Meshram, D. C., Patil, S. K., Karmakar, A., & Jain, L. (2021) · Geological Society London Special Publications · doi:10.1144/sp513-2021-34 · Cited by 19
The Magmatic Architecture of Continental Flood Basalts: 2. A New Conceptual Model
Mittal, T., & Richards, M. A. (2021) · Journal of Geophysical Research: Solid Earth · doi:10.1029/2021jb021807 · Cited by 16
Lamprophyres, lamproites and related rocks: Tracers to supercontinent cycles and metallogenesis
Krishnamurthy, R. B. P. (2023) · Journal of Earth System Science · doi:10.1007/s12040-023-02053-w · Cited by 12
Mohabey, D. M., & Samant, B. (2013) · Proceedings of XXIII Indian Colloquium on Micropaleontology and Stratigraphy and International Symposium on Global Bioevents in Earth’s History · doi:10.17491/cgsi/2013/63310 · Cited by 2
Self-citationTholt (2023) · Zenodo (CERN European Organization for Nuclear Research) · doi:10.5281/zenodo.10092451 · Cited by 1
Research works printed but not linked: 5
- Bhalla M. S., 1974, Low field hysteresis and palaeomagnetic stability criterion of rock samples from Dhar (Deccan traps) India, Journal of Indian Geophysical Union, 12, 14
- Kaila K. L., 1988, Deccan flood basalts, Memoir ‐ Geologic Society of India, 91
- Khadri S. F. R., 2003, Occurrence of N–R–N sequence in the Malwa Deccan lava flows to the north of Narmada region, Madhya Pradesh, India, Current Science, 85, 1126
- Khadri S. F. R., 1994, Magnetostratigraphy of Malwa Deccan Traps Near Mandu Region, Madhya Pradesh, 199
- 10.1017/s00167568200011683 · DOI
Cited by
Earth orbital rhythms links timing of Deccan trap volcanism phases and global climate change
Westerhold, T., Dallanave, E., Penman, D., Schoene, B., Röhl, U., Gussone, N., & Kuroda, J. (2025) · Science Advances · doi:10.1126/sciadv.adr8584 · Cited by 17
Dhobale, A., Mohabey, D. M., Samant, B., Sangode, S. J., & Kumar, D. (2024) · Historical Biology · doi:10.1080/08912963.2024.2418914 · Cited by 4
Self-citationMarzoli, A., Reisberg, L. C., Capriolo, M., Callegaro, S., Renne, P. R., Chiaradia, M., Meyzen, C., Self, S., Vanderkluysen, L., & Boscaini, A. (2026) · Earth and Planetary Science Letters · doi:10.1016/j.epsl.2026.119847 · Cited by 3
Self-citationKale, V. S., Upasani, D., Rajput, M., Dole, G., & Pillai, S. P. (2026) · Geological Society of America Bulletin · doi:10.1130/b38412.1 · Cited by 3
Sen, R., Polacci, M., Hartley, M. E., Burton, M. R., & Gupta, S. (2025) · Journal of Volcanology and Geothermal Research · doi:10.1016/j.jvolgeores.2025.108493 · Cited by 2
Metadata
- Authors
- Tholt, A. J., Renne, P. R., Marzoli, A., Vanderkluysen, L., Mohabey, D., Samant, B., Dhobale, A., Pande, K., & Self, S.
- Affiliations
- University of California, Berkeley (US)
- Berkeley Geochronology Center (US)
- University of Padua (IT)
- Drexel University (US)
- Rashtrasant Tukadoji Maharaj Nagpur University (IN)
- Savitribai Phule Pune University (IN)
- Indian Institute of Technology Bombay (IN)
- Corresponding author
- Tholt, A. J.
- ORCID
- Venue
- Geochemistry, Geophysics, Geosystems
- Publisher
- American Geophysical Union (AGU)
- Published
- 2023-12
- Volume
- 24
- Issue
- 12
- ISSN
- 1525-2027 (ISSN-L)
- OpenAlex
- W4389903873
- Cited by
- 15
- References
- 81
- Citations by year
- 2026: 7 · 2025: 6 · 2024: 2
- FWCI
- 2.14
- Type
- journal article
- Language
- en
- Open access
- gold
- doi.org
- Licence
- Locations
- Geochemistry Geophysics Geosystems (publishedVersion, cc-by-nc-nd)
- Padua Research Archive (University of Padova) (submittedVersion, cc-by-nc-nd)
- DOAJ (DOAJ: Directory of Open Access Journals) (submittedVersion, cc-by-sa)
- Topics
- Physical Sciences › Earth and Planetary Sciences › Geochemistry and Petrology › Geological and Geochemical Analysis
- Physical Sciences › Earth and Planetary Sciences › Geology › Geological and Geophysical Studies
- Physical Sciences › Earth and Planetary Sciences › Paleontology › Paleontology and Stratigraphy of Fossils
- Keywords
- Deccan Traps, 40Ar/39Ar geochronology, plagioclase, eruption rate, Western Ghats, crustal composition, mantle partial melting, rare earth element patterns, mantle temperature, Cretaceous volcanism, lava geochemistry
About these checks
Registry, retraction, Cites and statistics results are computed, not judged, with one exception: a printed reference that no index lists is read once by a model before it counts as a citation error. Claims are extracted by a model and kept only when their quote appears verbatim in the text; each cited source is then checked, with a model’s help, for whether it says what the claim relies on. Those verdicts can be wrong — read the claim’s quote and the cited source before relying on one.
A language model drew the claims from the paper on 2026-11-12, under version 3 of the claim definition (model deepseek-v4.1-flash, prompt extract-v3).
A second model labelled each claim on 2026-11-12 (model jev-1.13-20260917, definition revision gold-guideline-v0.2).
Statistics and arithmetic are recomputed, not judged.
Confidence bands are shown only for fields calibrated on our annotated test set. None is calibrated yet, so no band is shown.
What counts as a claim ›How we measure confidence ›How we check this ›
Are you an author, or do you see a problem with this page? Request a review
