Cited by 237

The DOI matches its Crossref record; 3 of the 3 references it cites were found in a registry or an index.

Infected erythrocyte-derived extracellular vesicles alter vascular function via regulatory Ago2-miRNA complexes in malaria.

Mantel, Pierre-Yves, Hjelmqvist, Daisy, Walch, Michael, Kharoubi-Hess, Solange, Nilsson, Sandra, Ravel, Deepali, Ribeiro, Marina, Grüring, Christof, Ma, Siyuan, Padmanabhan, Prasad, Trachtenberg, Alexander, Ankarklev, Johan, Brancucci, Nicolas M., Huttenhower, Curtis, Duraisingh, Manoj T., Ghiran, Ionita, Kuo, Winston P., Filgueira, Luis, Martinelli, Roberta, Marti, Matthias·2016·Nature Communications

Abstract

Malaria remains one of the greatest public health challenges worldwide, particularly in sub-Saharan Africa. The clinical outcome of individuals infected with Plasmodium falciparum parasites depends on many factors including host systemic inflammatory responses, parasite sequestration in tissues and vascular dysfunction. Production of pro-inflammatory cytokines and chemokines promotes endothelial activation as well as recruitment and infiltration of inflammatory cells, which in turn triggers further endothelial cell activation and parasite sequestration. Inflammatory responses are triggered in part by bioactive parasite products such as hemozoin and infected red blood cell-derived extracellular vesicles (iRBC-derived EVs). Here we demonstrate that such EVs contain functional miRNA-Argonaute 2 complexes that are derived from the host RBC. Moreover, we show that EVs are efficiently internalized by endothelial cells, where the miRNA-Argonaute 2 complexes modulate target gene expression and barrier properties. Altogether, these findings provide a mechanistic link between EVs and vascular dysfunction during malaria infection.

Overview

The claims and statistics of this paper haven’t been checked yet.

Run the check — free, no account needed. It reads the open-access text and checks the sources it cites.

A few free checks a day · papers already verified open instantly · results are public

Integrity signals

Registry

Crossref · 10.1038/ncomms12727

Cites

3 of 3 references verified0 citation errors · 0 not checkable

Statistics

Figures

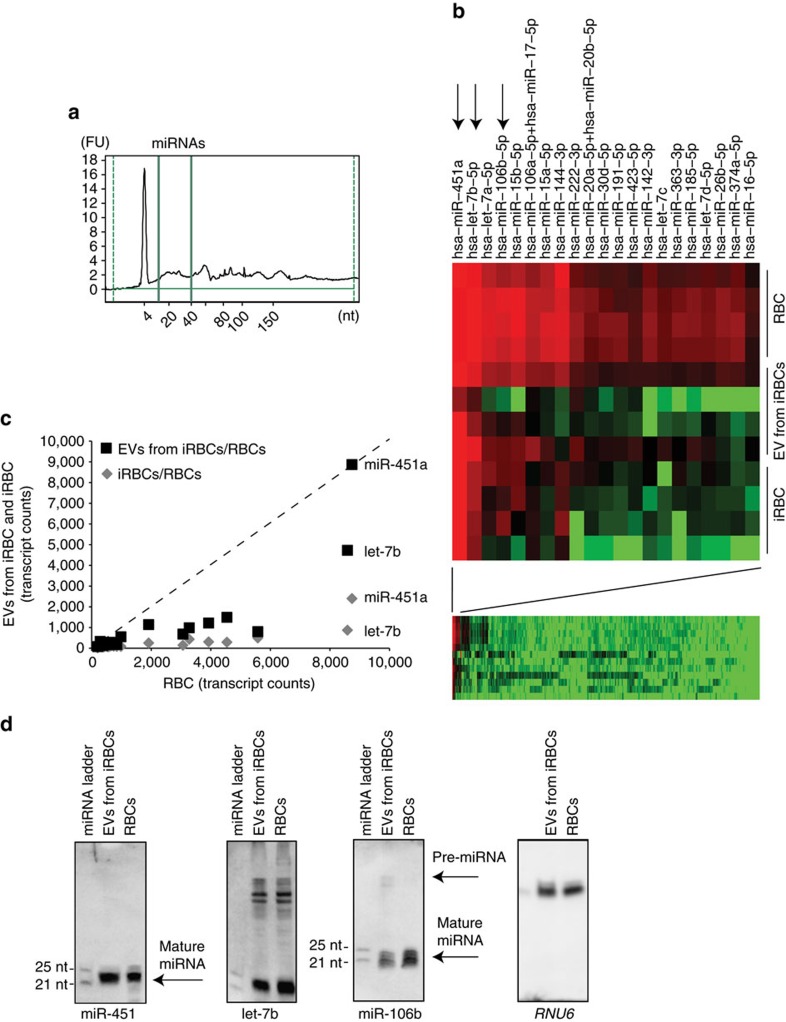
Figure 1 Detection of human miRNA species in EVs. (a) EVs derived from iRBCs contain small RNAs. RNA samples were prepared from EVs and analysed by Agilent Bioanalyzer Small RNA Chip. Small RNA species of up to 150 nucleotides are detected, including species between 20 to 25 nucleotides (range marked by green lines). FU, fluorescence units. (b) miRNA profiling of iRBCs, EVs from iRBCs and RBCs by nanostring. miRNA preparations from four experiments were analysed using a Nanostring miRNA array containing 800 human miRNA species. Normalized data from the entire array are shown in the left panel. Twenty-one miRNAs are expressed in RBCs, of which a subset is also present in iRBCs and EVs from iRBCs (right). These are (in order of expression levels) miR-451a, let-7b, let-7a, miR-106b and miR-15b. Those that are further characterized in this study are marked with black arrows. (c) Differential abundance of miRNA species in RBCs, EVs from iRBCs and RBCs. The normalized Nanostring data from b are represented as correlations between the mean expression across four experiments of RBC and the mean expression of either iRBCs (black boxes) or EVs from iRBCs (grey diamonds). miR-451a and let-7b show similar abundance across all three populations, while the other miRNA species are greatly reduced in iRBCs and EVs from iRBCs. (d) Detection of miRNAs by northern blot. RNA samples from RBCs and EVs from iRBCs are hybridized with probes specific for miR-451a, let-7b and miR-106b. The northern blot shows specific bands at the expected size of 22 nucleotides for miR-451a and let-7b, and of 21 nucleotides for miR-106b. In addition unprocessed Pre-miRNA species at the expected size of 70 nucleotides are detectable for let-7b and miR-106b. Shown is also a blot for U6 small nuclear RNA (RNU6) as a control for RBC-derived non-miRNA RNA species23. Samples were normalized using equal RNA input.
Figure 1 Detection of human miRNA species in EVs. (a) EVs derived from iRBCs contain small RNAs. RNA samples were prepared from EVs and analysed by Agilent Bioanalyzer Small RNA Chip. Small RNA species of up to 150 nucleotides are detected, including species between 20 to 25 nucleotides (range marked by green lines). FU, fluorescence units. (b) miRNA profiling of iRBCs, EVs from iRBCs and RBCs by nanostring. miRNA preparations from four experiments were analysed using a Nanostring miRNA array containing 800 human miRNA species. Normalized data from the entire array are shown in the left panel. Twenty-one miRNAs are expressed in RBCs, of which a subset is also present in iRBCs and EVs from iRBCs (right). These are (in order of expression levels) miR-451a, let-7b, let-7a, miR-106b and miR-15b. Those that are further characterized in this study are marked with black arrows. (c) Differential abundance of miRNA species in RBCs, EVs from iRBCs and RBCs. The normalized Nanostring data from b are represented as correlations between the mean expression across four experiments of RBC and the mean expression of either iRBCs (black boxes) or EVs from iRBCs (grey diamonds). miR-451a and let-7b show similar abundance across all three populations, while the other miRNA species are greatly reduced in iRBCs and EVs from iRBCs. (d) Detection of miRNAs by northern blot. RNA samples from RBCs and EVs from iRBCs are hybridized with probes specific for miR-451a, let-7b and miR-106b. The northern blot shows specific bands at the expected size of 22 nucleotides for miR-451a and let-7b, and of 21 nucleotides for miR-106b. In addition unprocessed Pre-miRNA species at the expected size of 70 nucleotides are detectable for let-7b and miR-106b. Shown is also a blot for U6 small nuclear RNA (RNU6) as a control for RBC-derived non-miRNA RNA species23. Samples were normalized using equal RNA input.CC BY · PubMed Central
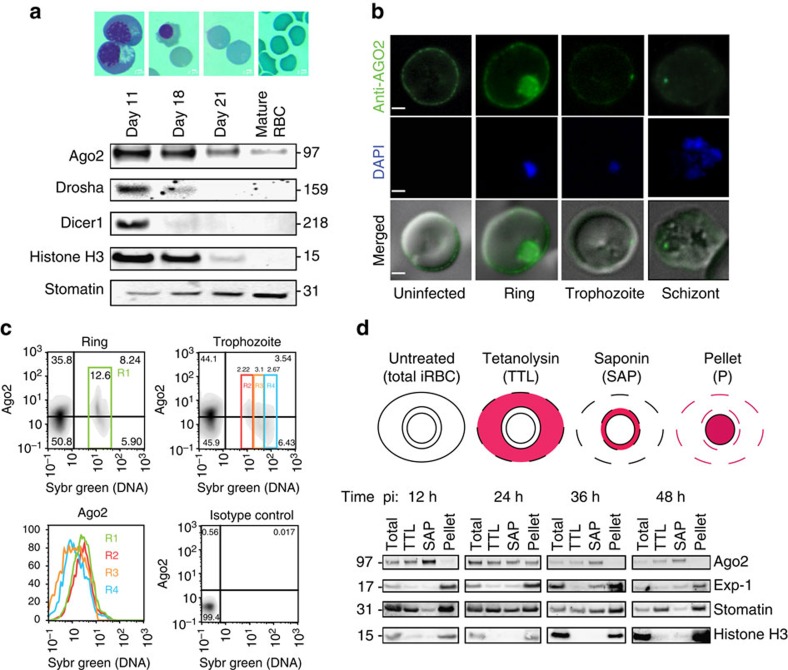
Figure 2 Detection of human Ago2 in RBCs and iRBCs. (a) Expression of RNAi machinery during RBC development. Cell lysates from different developmental stages of erythropoiesis were prepared (day 11: basophilic and polychromatic erythroblasts, day 18: orthochromatic erythroblasts and reticulocytes, day 21: reticulocytes and normocytes; representative images are shown). Ago2 is detectable in mature RBCs while dicer, drosha (and human histone H3) are not present. Stomatin is present in all preparations. (b) IFA of Ago2 in RBCs and iRBCs. Ago2 is localized to the RBC periphery in uninfected and infected RBCs, however, labelling is reduced in later parasite stages. Notably, ring stage parasites also show Ago2 accumulation in the parasite. Scale bar; 1 μm. (c) Flow cytometry analysis of Ago2 labelling in RBCs and iRBCs. Uninfected RBCs and iRBCs were gated based on SYBR staining (nuclear content, n) and Ago2 labelling. Young iRBCs (rings, and trophozoites with n=1) show the highest Ago2 labelling, confirming IFA data. (d) Sequential fractionation of purified infected parasites analysed by western blot. iRBC samples were collected at four time points post invasion, separated from uninfected RBCs and fractionated. The host cytosol was released with 1 HU of tetanolysin (TTL) and subsequently the PV contents were released with 0.035% of saponin (SAP). The pellet contains parasite material and host membranes while the TTL supernatant contains RBC cytosol and the SAP supernatant contains soluble parasitophorous vacuole material. The parasitophorous vacuole membrane marker PfExp-1 and parasite nuclear histone H3 are detectable in the pellet fraction across the asexual parasite cycle. Ago2 is present in cytosol (SAP, TTL) across the cycle but only present in the pellet fraction in early parasite stages, supporting the dynamic distribution observed by IFA. Host stomatin is present in cytosol (SAp, TTL) and membranes (pellet) throughout the cycle. Data are representative of three independent experiments. pi: post invasion.
Figure 2 Detection of human Ago2 in RBCs and iRBCs. (a) Expression of RNAi machinery during RBC development. Cell lysates from different developmental stages of erythropoiesis were prepared (day 11: basophilic and polychromatic erythroblasts, day 18: orthochromatic erythroblasts and reticulocytes, day 21: reticulocytes and normocytes; representative images are shown). Ago2 is detectable in mature RBCs while dicer, drosha (and human histone H3) are not present. Stomatin is present in all preparations. (b) IFA of Ago2 in RBCs and iRBCs. Ago2 is localized to the RBC periphery in uninfected and infected RBCs, however, labelling is reduced in later parasite stages. Notably, ring stage parasites also show Ago2 accumulation in the parasite. Scale bar; 1 μm. (c) Flow cytometry analysis of Ago2 labelling in RBCs and iRBCs. Uninfected RBCs and iRBCs were gated based on SYBR staining (nuclear content, n) and Ago2 labelling. Young iRBCs (rings, and trophozoites with n=1) show the highest Ago2 labelling, confirming IFA data. (d) Sequential fractionation of purified infected parasites analysed by western blot. iRBC samples were collected at four time points post invasion, separated from uninfected RBCs and fractionated. The host cytosol was released with 1 HU of tetanolysin (TTL) and subsequently the PV contents were released with 0.035% of saponin (SAP). The pellet contains parasite material and host membranes while the TTL supernatant contains RBC cytosol and the SAP supernatant contains soluble parasitophorous vacuole material. The parasitophorous vacuole membrane marker PfExp-1 and parasite nuclear histone H3 are detectable in the pellet fraction across the asexual parasite cycle. Ago2 is present in cytosol (SAP, TTL) across the cycle but only present in the pellet fraction in early parasite stages, supporting the dynamic distribution observed by IFA. Host stomatin is present in cytosol (SAp, TTL) and membranes (pellet) throughout the cycle. Data are representative of three independent experiments. pi: post invasion.CC BY · PubMed Central
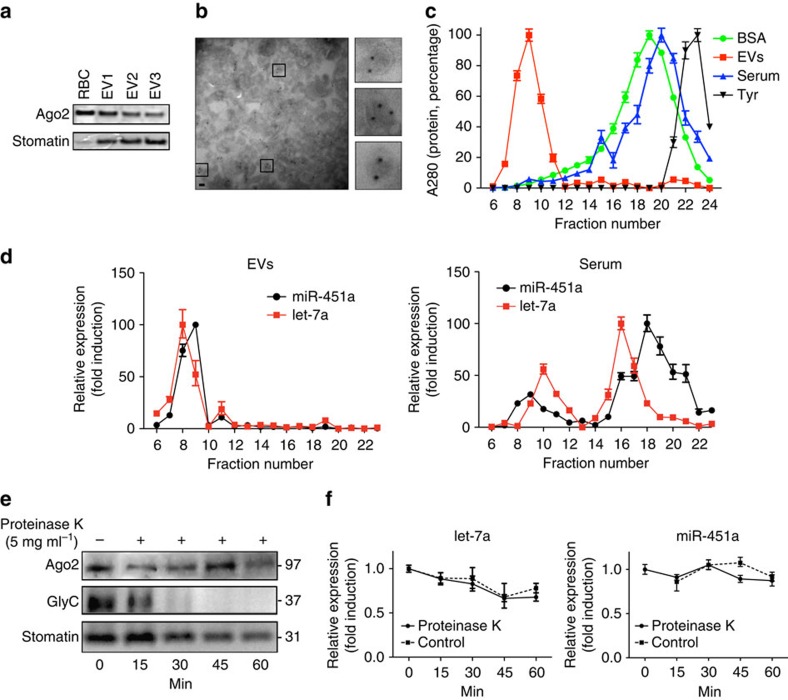
Figure 3 Ago2 and miRNA are present within purified EVs. (a) Expression of Ago2 and stomatin in multiple EV preparations was probed by western blot. (b) Immuno electron microscopy. EVs were prepared and processed as described in materials and methods for labelling with human Ago2 antibody. The field of view shows multiple EVs with internal immunogold labelling, demonstrating that Ago2 is present in EVs rather than associated by surface attachment. Inserts: three representative EVs in higher magnification (scale bar, 100 nm). (c) Elution profile of purified EVs, human serum, BSA and tyrosine (Tyr) after size-exclusion separation. Protein abundance was determined by absorbance at 280 nm. Points represent the mean±s.d. of three experiments performed in triplicate. (d) Fractions from purified EVs (left) and serum (right) were assayed for miR451a (black) and let-7a (red) using absolute quantification by TaqMan qPCR. The mean±s.d. of one representative experiment is shown (n=2). (e,f) The Ago2-miRNA complexes are protected from protease K digestion. (e) EVs were treated with proteinase K (5 mg ml−1, or untreated control) at 55 °C. At times indicated, aliquots were removed and assessed for Ago2, stomatin and Glycophorin C expression by western Blot. In contrast to Glycophorin C, Ago2 and stomatin were protected from digestion by proteinase K. (f) Untreated (open symbols) or treated samples (close symbols) were also analysed for miR-451a and let-7a expression by qPCR. Points represent miRNA copies detected at each time relative to the control sample at time point 0. The mean±s.d. of one representative experiment is shown (n=3). qPCR, quantitative PCR.
Figure 3 Ago2 and miRNA are present within purified EVs. (a) Expression of Ago2 and stomatin in multiple EV preparations was probed by western blot. (b) Immuno electron microscopy. EVs were prepared and processed as described in materials and methods for labelling with human Ago2 antibody. The field of view shows multiple EVs with internal immunogold labelling, demonstrating that Ago2 is present in EVs rather than associated by surface attachment. Inserts: three representative EVs in higher magnification (scale bar, 100 nm). (c) Elution profile of purified EVs, human serum, BSA and tyrosine (Tyr) after size-exclusion separation. Protein abundance was determined by absorbance at 280 nm. Points represent the mean±s.d. of three experiments performed in triplicate. (d) Fractions from purified EVs (left) and serum (right) were assayed for miR451a (black) and let-7a (red) using absolute quantification by TaqMan qPCR. The mean±s.d. of one representative experiment is shown (n=2). (e,f) The Ago2-miRNA complexes are protected from protease K digestion. (e) EVs were treated with proteinase K (5 mg ml−1, or untreated control) at 55 °C. At times indicated, aliquots were removed and assessed for Ago2, stomatin and Glycophorin C expression by western Blot. In contrast to Glycophorin C, Ago2 and stomatin were protected from digestion by proteinase K. (f) Untreated (open symbols) or treated samples (close symbols) were also analysed for miR-451a and let-7a expression by qPCR. Points represent miRNA copies detected at each time relative to the control sample at time point 0. The mean±s.d. of one representative experiment is shown (n=3). qPCR, quantitative PCR.CC BY · PubMed Central
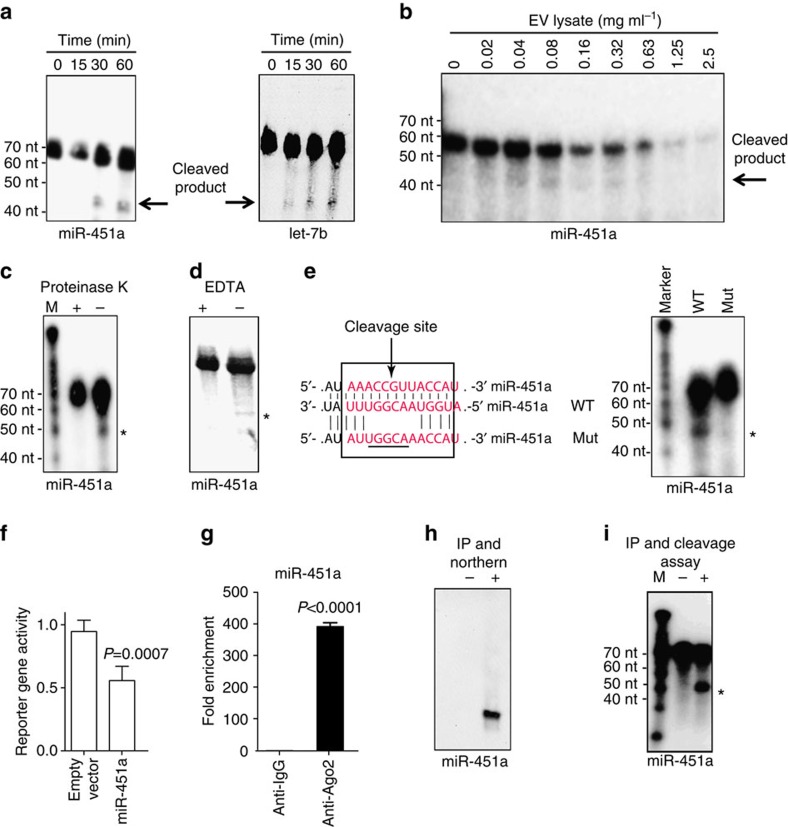
Figure 4 Characterization of a functional Ago2-miRNA complex in EVs that are functionally competent in gene silencing. (a,b). In vitro RISC activity assay. (a) EV lysates were incubated for 0, 15, 30 or 60 min in the presence of a 32P-labelled RNA sensor with binding site complementary to miR-451a (left) or let-7b (right). The cleavage was monitored by gel electrophoresis. (b) miR-451a sensor was incubated for 90 min with increasing amounts of EV lysate and emergence of processed product was monitored as above. The autoradiogram demonstrates emergence of product in a range between 0.04 and 0.32 mg EV lysate per ml. (c–e) Specificity of endonucleolytic RISC activity. Co-incubation of EVs and miR-451a probe with 1 mg ml−1 of proteinase K (c) or EDTA (d) inhibits the cleavage reaction, while a DMSO control remains unaffected. (e) Disruption of the miR-451a cleavage site on the probe (Mut) blocks processing, while the wild-type probe (WT) is efficiently cleaved. (f) 3′-UTR degradation activity. HEK293 cells transiently expressing a Renilla luciferase reporter gene with binding site complementary to miR-451a in the 3′-UTR of the reporter cassette were incubated with EVs derived from iRBCs for 48 h prior to luciferase activity measurements. Results are normalized based on constitutive Firefly luciferase activity, and expressed as mean (±s.e.m.) percentage of control (n=3 experiments). P versus control (Student's t-test). (g,h) Activity of purified Ago2-miRNA complex. (g) Quantification of miRNA by qRT-PCR. Protein extracts derived from purified EVs were subjected to immunoprecipitation (IP) using anti-Ago2 antibody, followed by miR-451a quantification using qRT-PCR. Results are normalized by the 2-Ct method, using the RNU6 gene as a reference and expressed as the enrichment versus the IgG1 negative control (mean ± s.e.m.; n=4 experiments). P versus control (Student's t-test). (h) Detection of miRNA by northern blot. Negative control represents IP using control IgG. (i) Activity of Ago2-miRNA complex. The precipitated complex was incubated with a miR-451a probe and cleavage confirmed, while the negative control shows no processing. ‘ * ‘ Indicates the expected cleavage product of the probes (46 nt).
Figure 4 Characterization of a functional Ago2-miRNA complex in EVs that are functionally competent in gene silencing. (a,b). In vitro RISC activity assay. (a) EV lysates were incubated for 0, 15, 30 or 60 min in the presence of a 32P-labelled RNA sensor with binding site complementary to miR-451a (left) or let-7b (right). The cleavage was monitored by gel electrophoresis. (b) miR-451a sensor was incubated for 90 min with increasing amounts of EV lysate and emergence of processed product was monitored as above. The autoradiogram demonstrates emergence of product in a range between 0.04 and 0.32 mg EV lysate per ml. (c–e) Specificity of endonucleolytic RISC activity. Co-incubation of EVs and miR-451a probe with 1 mg ml−1 of proteinase K (c) or EDTA (d) inhibits the cleavage reaction, while a DMSO control remains unaffected. (e) Disruption of the miR-451a cleavage site on the probe (Mut) blocks processing, while the wild-type probe (WT) is efficiently cleaved. (f) 3′-UTR degradation activity. HEK293 cells transiently expressing a Renilla luciferase reporter gene with binding site complementary to miR-451a in the 3′-UTR of the reporter cassette were incubated with EVs derived from iRBCs for 48 h prior to luciferase activity measurements. Results are normalized based on constitutive Firefly luciferase activity, and expressed as mean (±s.e.m.) percentage of control (n=3 experiments). P versus control (Student's t-test). (g,h) Activity of purified Ago2-miRNA complex. (g) Quantification of miRNA by qRT-PCR. Protein extracts derived from purified EVs were subjected to immunoprecipitation (IP) using anti-Ago2 antibody, followed by miR-451a quantification using qRT-PCR. Results are normalized by the 2-Ct method, using the RNU6 gene as a reference and expressed as the enrichment versus the IgG1 negative control (mean ± s.e.m.; n=4 experiments). P versus control (Student's t-test). (h) Detection of miRNA by northern blot. Negative control represents IP using control IgG. (i) Activity of Ago2-miRNA complex. The precipitated complex was incubated with a miR-451a probe and cleavage confirmed, while the negative control shows no processing. ‘ * ‘ Indicates the expected cleavage product of the probes (46 nt).CC BY · PubMed Central
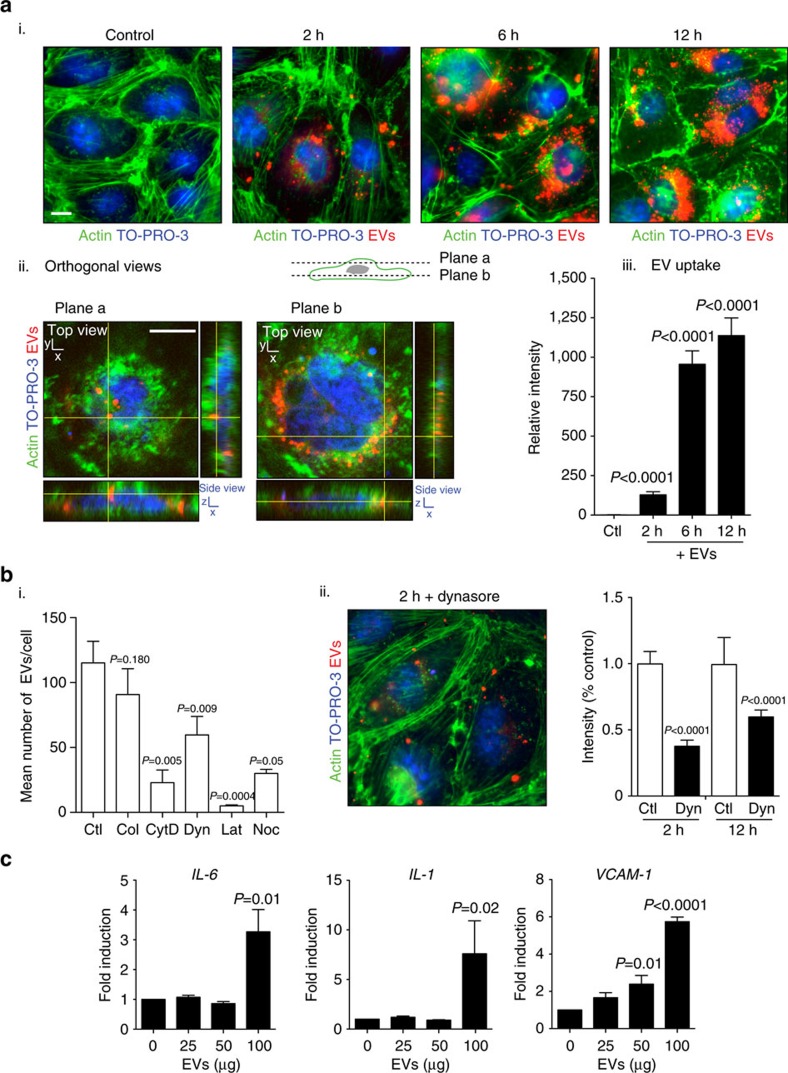
Figure 5 Uptake of EVs by endothelial cells. (a) Dynamics of EV internalization. Bone marrow endothelial cells (BMEC) were incubated with 100 μg of PKH26 fluorescently labelled EVs for 0, 2, 6 or 12 h. BMECs were stained for actin (phalloidin, green) and nuclei (TO-PRO-3, blue). (i) Following washing, the majority of internalized EVs were detected in a perinuclear region of the endothelial cell starting at 2 h post incubation. Scale bar, 10 μm. (ii) Orthogonal views of a representative cell after 12 h of EV uptake demonstrate that EVs are internalized. Scale bar, 7 μm. (iii) Internalized EVs were quantified by means of fluorescence intensity. Background signal was subtracted for every single image before obtaining the relative fluorescence per field. At least 15 images were collected per condition (mean ± s.e.m.; n=3 experiments). P versus control (Student's t-test). (b) Effect of inhibitors on EV uptake. Cells were co-incubated with inhibitors and EVs, uptake was quantified compared with control as in a. (i) Effect of known EV uptake inhibitors. Compounds were co-incubated for 2 h with EVs and the effect measured as mean number of EVs per cell. Ctl: control. Col: Colchicine (31 nM). CytD: Cytochalasin (600 nM). D. Dyn: Dynasore (80 μM). Lat: Latrunculin A (5 μM). Noc: Nocodazole (20 μM). (ii) Phenotypic effect of Dynasore inhibition. The drug was added at 80 μM and the effect measured (intensity of PKH26 staining) after 2 and 12 h of co-incubation with EVs. (mean ± s.e.m.; n=3 experiments). P versus control (Student's t-test). (c) Activation of cytokines and cell surface receptors upon EV uptake. Detection of IL-1, IL-6 and VCAM-1 by qRT-PCR in BMEC upon incubation with an increasing amount of EVs. qRT-PCR results are normalized by the 2-Ct method, using EF-1 as a reference and expressed as mean and fold induction over control (mean ± s.e.m.; n=3 experiments), P versus control (Student's t-test).
Figure 5 Uptake of EVs by endothelial cells. (a) Dynamics of EV internalization. Bone marrow endothelial cells (BMEC) were incubated with 100 μg of PKH26 fluorescently labelled EVs for 0, 2, 6 or 12 h. BMECs were stained for actin (phalloidin, green) and nuclei (TO-PRO-3, blue). (i) Following washing, the majority of internalized EVs were detected in a perinuclear region of the endothelial cell starting at 2 h post incubation. Scale bar, 10 μm. (ii) Orthogonal views of a representative cell after 12 h of EV uptake demonstrate that EVs are internalized. Scale bar, 7 μm. (iii) Internalized EVs were quantified by means of fluorescence intensity. Background signal was subtracted for every single image before obtaining the relative fluorescence per field. At least 15 images were collected per condition (mean ± s.e.m.; n=3 experiments). P versus control (Student's t-test). (b) Effect of inhibitors on EV uptake. Cells were co-incubated with inhibitors and EVs, uptake was quantified compared with control as in a. (i) Effect of known EV uptake inhibitors. Compounds were co-incubated for 2 h with EVs and the effect measured as mean number of EVs per cell. Ctl: control. Col: Colchicine (31 nM). CytD: Cytochalasin (600 nM). D. Dyn: Dynasore (80 μM). Lat: Latrunculin A (5 μM). Noc: Nocodazole (20 μM). (ii) Phenotypic effect of Dynasore inhibition. The drug was added at 80 μM and the effect measured (intensity of PKH26 staining) after 2 and 12 h of co-incubation with EVs. (mean ± s.e.m.; n=3 experiments). P versus control (Student's t-test). (c) Activation of cytokines and cell surface receptors upon EV uptake. Detection of IL-1, IL-6 and VCAM-1 by qRT-PCR in BMEC upon incubation with an increasing amount of EVs. qRT-PCR results are normalized by the 2-Ct method, using EF-1 as a reference and expressed as mean and fold induction over control (mean ± s.e.m.; n=3 experiments), P versus control (Student's t-test).CC BY · PubMed Central
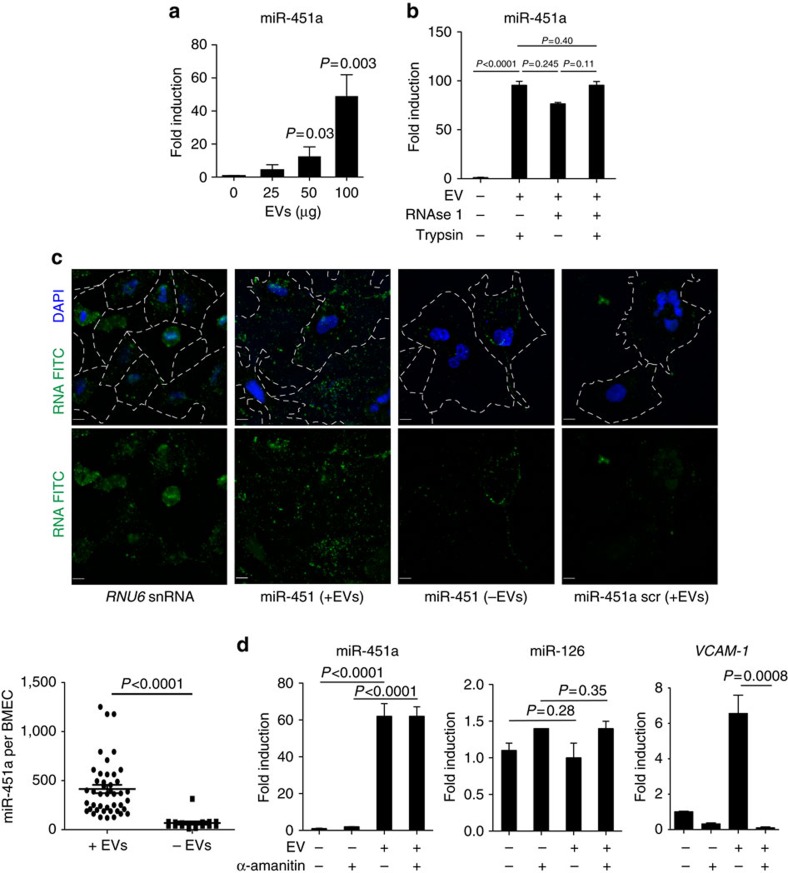
Figure 6 Accumulation of miRNA in BMEC upon EV uptake. (a) Detection of miRNA by qRT-PCR. miR-451a was quantified by qRT-PCR in BMEC upon incubation with an increasing amount of EVs during 24 h. (b) miRNA uptake is resistant to RNAse 1 and trypsin. BMEC was incubated with RNAse 1 and/or trypsin after EV uptake. miR-451a was quantified by qRT-PCR in endothelial cells. (c) Detection of miRNA by RNA FISH. miRNA transfer by EVs is measured by RNA FISH. miR-451a is only detected in endothelial cells upon EV transfer, and only when a sequence-specific probe is used for detection (green spots; single-molecule RNA FISH; maximum intensity merges of Z-stacks). RNU6, positive control; scramble, negative control. Blue, nuclei (DAPI); scale bar, 10 μm. Cell membrane area is outlined by white dashed lines. P versus control (Student's t-test. (d) EV uptake does not induce miRNA expression in BMEC. BMEC were incubated with α-amanitin before EV uptake. miRNAs (miR-451a and miR-126) and VCAM-1 were quantified by qRT-PCR in endothelial cells upon EV incubation. qRT-PCR results from all experiments are normalized by the 2-Ct method, using RNU6 as a reference and expressed as mean and fold induction over control (mean ± s.e.m.; n=3 experiments), P versus control (Student's t-test).
Figure 6 Accumulation of miRNA in BMEC upon EV uptake. (a) Detection of miRNA by qRT-PCR. miR-451a was quantified by qRT-PCR in BMEC upon incubation with an increasing amount of EVs during 24 h. (b) miRNA uptake is resistant to RNAse 1 and trypsin. BMEC was incubated with RNAse 1 and/or trypsin after EV uptake. miR-451a was quantified by qRT-PCR in endothelial cells. (c) Detection of miRNA by RNA FISH. miRNA transfer by EVs is measured by RNA FISH. miR-451a is only detected in endothelial cells upon EV transfer, and only when a sequence-specific probe is used for detection (green spots; single-molecule RNA FISH; maximum intensity merges of Z-stacks). RNU6, positive control; scramble, negative control. Blue, nuclei (DAPI); scale bar, 10 μm. Cell membrane area is outlined by white dashed lines. P versus control (Student's t-test. (d) EV uptake does not induce miRNA expression in BMEC. BMEC were incubated with α-amanitin before EV uptake. miRNAs (miR-451a and miR-126) and VCAM-1 were quantified by qRT-PCR in endothelial cells upon EV incubation. qRT-PCR results from all experiments are normalized by the 2-Ct method, using RNU6 as a reference and expressed as mean and fold induction over control (mean ± s.e.m.; n=3 experiments), P versus control (Student's t-test).CC BY · PubMed Central
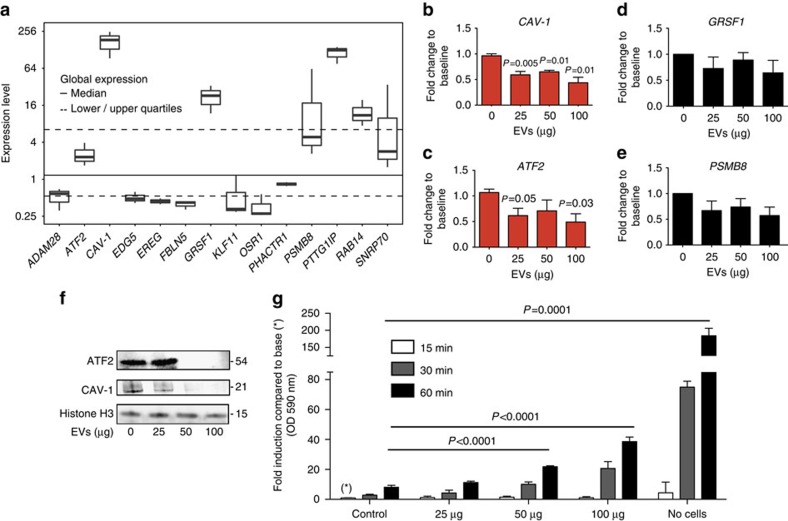
Figure 7 Downregulation of miR-451a target genes in endothelial cells upon EV uptake. (a) Enodogenous expression of miR-451a targets in endothelial cells. Shown is a boxplot for gene expression distribution of putative and known miR-451a targets in untreated BMEC cells41, that is, only the control samples from GEO platform GPL2986 (three in total) are included in the analysis. Most variable probe sets were used to represent gene expression when mapping from probe sets to genes isn't unique. Note the y-axis is log2 scaled. (b–e) Expression of miR-451a targets upon EV incubation. Potential miR-451a target transcripts were quantified by qRT-PCR. Two target genes, (b) CAV-1 and (c) ATF2 show significant downregulation, while GRSF1 (d) and PSMB8 (e) are not affected significantly in its transcript level. Results are normalized by the 2-Ct method using EF-1, and with 18 S rRNA as a reference and expressed as mean (±s.e.m.) fold induction over untreated control (n=3 experiments), P versus control (Student's t-test). (f) Western blot analysis of ATF2 and CAV-1 demonstrates depletion of protein for both markers below detection levels upon incubation with 50 and 100 μg of EVs. (g) Effect of EV uptake on endothelial barrier. Endothelial cells were incubated with an EV titration and rhodamine-labelled dextran to measure permeability across a trans-well membrane over time. Permeability across the endothelial layer is significantly increased after 2 h of incubation with 50 and 100 μg of EVs. Data represent mean (±s.e.m.) from 3 experiments, P versus control (Student's t-test).
Figure 7 Downregulation of miR-451a target genes in endothelial cells upon EV uptake. (a) Enodogenous expression of miR-451a targets in endothelial cells. Shown is a boxplot for gene expression distribution of putative and known miR-451a targets in untreated BMEC cells41, that is, only the control samples from GEO platform GPL2986 (three in total) are included in the analysis. Most variable probe sets were used to represent gene expression when mapping from probe sets to genes isn't unique. Note the y-axis is log2 scaled. (b–e) Expression of miR-451a targets upon EV incubation. Potential miR-451a target transcripts were quantified by qRT-PCR. Two target genes, (b) CAV-1 and (c) ATF2 show significant downregulation, while GRSF1 (d) and PSMB8 (e) are not affected significantly in its transcript level. Results are normalized by the 2-Ct method using EF-1, and with 18 S rRNA as a reference and expressed as mean (±s.e.m.) fold induction over untreated control (n=3 experiments), P versus control (Student's t-test). (f) Western blot analysis of ATF2 and CAV-1 demonstrates depletion of protein for both markers below detection levels upon incubation with 50 and 100 μg of EVs. (g) Effect of EV uptake on endothelial barrier. Endothelial cells were incubated with an EV titration and rhodamine-labelled dextran to measure permeability across a trans-well membrane over time. Permeability across the endothelial layer is significantly increased after 2 h of incubation with 50 and 100 μg of EVs. Data represent mean (±s.e.m.) from 3 experiments, P versus control (Student's t-test).CC BY · PubMed Central
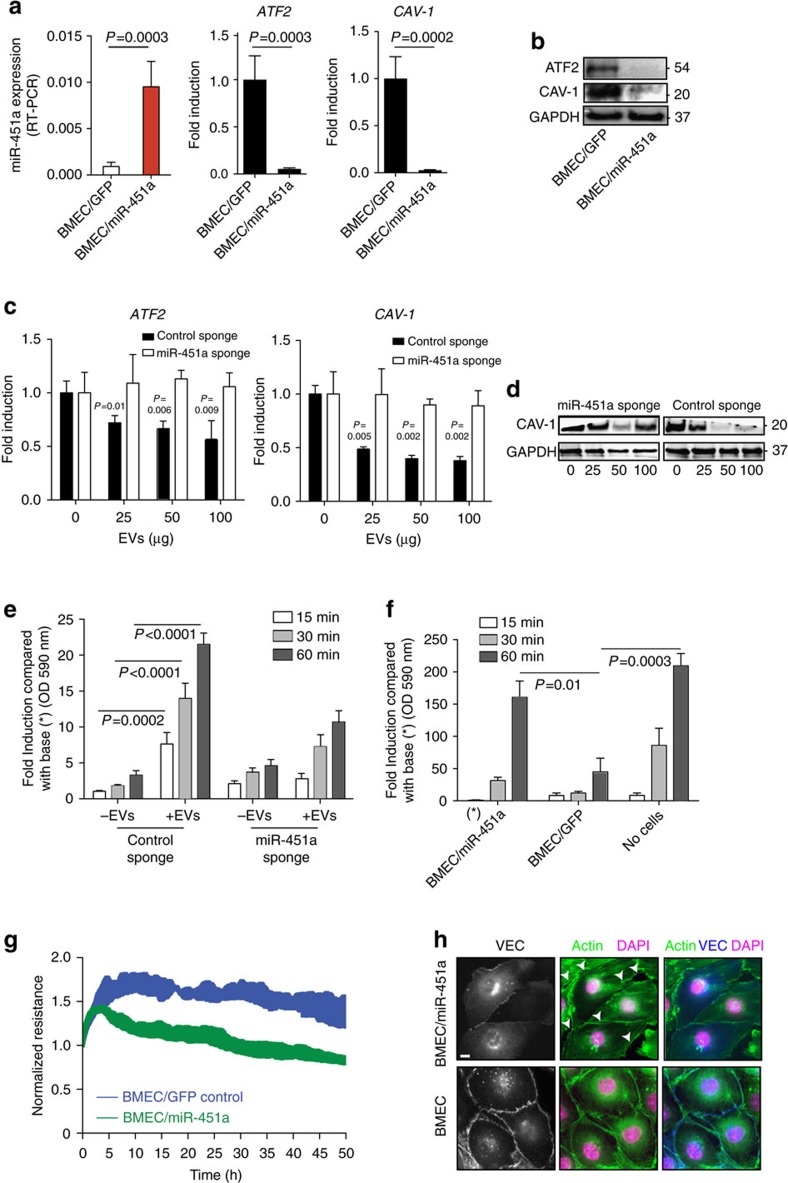
Figure 8 miR-451a alters endothelial barrier properties. (a,b) Effect of miR-451a over-expression. Endothelial cells were transduced with a lentiviral vector expressing miR-451a (BMEC/miR-451a) or GFP control (BMEC/GFP). Expression of CAV-1 and ATF2 was assessed on a transcript level by qRT-PCR (a) and on a protein level by western blot (b). At both levels the two markers are significantly reduced in BMEC/miR-451a compared with GFP control and wild-type BMEC. qRT-PCR results are normalized by the 2-Ct method using GAPDH, and expressed as mean (±s.e.m.) (n=3 experiments), p versus control (Student's t-test). (c,d) miRNA inhibition via miRNA Sponge. Endothelial cells were transduced with miR-451a Sponge miRNA or control Sponge miRNA before addition of EVs and target gene and protein expression in endothelial cells was determined by qRT-PCR (c) and western blot (d). Expression of both target genes, CAV-1 and ATF2, is restored compared with BMECs transduced with control Sponge. qRT-PCR results are normalized by the 2-Ct method using EF-1, and with 18 S rRNA as a reference and expressed as mean (±s.e.m.) fold induction over untreated control (n=3 experiments), P versus control (Student's t-test). (e) Permeability of BMECs transduced with miR-451a Sponge or control Sponge was assessed by measuring the appearance of rhodamine-labelled dextran in the bottom well of a trans-well set up after a 1 hour time-course. The absorbance at 15, 30 and 60 min time points was compared with the control Sponge condition. Data represent mean (±s.e.m., n=6), P versus control (Student's t-test). (f,g) Altered barrier properties in BMEC/miR-451a line. Permeability assays using rhodamine-labeled dextran (f) and TEER assays (g) were performed over time, with BMEC/miR-451a and the BMEC/GFP control line. Both experimental approaches demonstrate significant reduction in endothelial barrier properties in BMEC/miR-451a compared with control. (h) BMEC control and BMEC/miR-451a cells were plated for 36 h before fixation, permeabilization and staining for actin and the junctional protein VE-cadherin (VEC). White arrows indicate presence of gaps in the BMEC/miR-451a line. Scale bar, 10 μm. TEER, trans-endothelial electrical resistance.
Figure 8 miR-451a alters endothelial barrier properties. (a,b) Effect of miR-451a over-expression. Endothelial cells were transduced with a lentiviral vector expressing miR-451a (BMEC/miR-451a) or GFP control (BMEC/GFP). Expression of CAV-1 and ATF2 was assessed on a transcript level by qRT-PCR (a) and on a protein level by western blot (b). At both levels the two markers are significantly reduced in BMEC/miR-451a compared with GFP control and wild-type BMEC. qRT-PCR results are normalized by the 2-Ct method using GAPDH, and expressed as mean (±s.e.m.) (n=3 experiments), p versus control (Student's t-test). (c,d) miRNA inhibition via miRNA Sponge. Endothelial cells were transduced with miR-451a Sponge miRNA or control Sponge miRNA before addition of EVs and target gene and protein expression in endothelial cells was determined by qRT-PCR (c) and western blot (d). Expression of both target genes, CAV-1 and ATF2, is restored compared with BMECs transduced with control Sponge. qRT-PCR results are normalized by the 2-Ct method using EF-1, and with 18 S rRNA as a reference and expressed as mean (±s.e.m.) fold induction over untreated control (n=3 experiments), P versus control (Student's t-test). (e) Permeability of BMECs transduced with miR-451a Sponge or control Sponge was assessed by measuring the appearance of rhodamine-labelled dextran in the bottom well of a trans-well set up after a 1 hour time-course. The absorbance at 15, 30 and 60 min time points was compared with the control Sponge condition. Data represent mean (±s.e.m., n=6), P versus control (Student's t-test). (f,g) Altered barrier properties in BMEC/miR-451a line. Permeability assays using rhodamine-labeled dextran (f) and TEER assays (g) were performed over time, with BMEC/miR-451a and the BMEC/GFP control line. Both experimental approaches demonstrate significant reduction in endothelial barrier properties in BMEC/miR-451a compared with control. (h) BMEC control and BMEC/miR-451a cells were plated for 36 h before fixation, permeabilization and staining for actin and the junctional protein VE-cadherin (VEC). White arrows indicate presence of gaps in the BMEC/miR-451a line. Scale bar, 10 μm. TEER, trans-endothelial electrical resistance.CC BY · PubMed Central

Verification

Claims the paper makes

The claims and statistics of this paper haven’t been checked yet.

Run the check — free, no account needed. It reads the open-access text and checks the sources it cites.

A few free checks a day · papers already verified open instantly · results are public

Claims other papers make about this one

Each is checked against this paper’s own text: does it say what the citing paper says it does?

Self-check

Percentages, sums and reported differences re-computed from the paper’s own numbers.

The self-check needs the paper’s full text.

Citations

Cites

Show all 3 references

Research works printed but not linked: 64

  1. Murray, C. J. et al. Global malaria mortality between 1980 and 2010: a systematic analysis. Lancet 379, 413–431 (2012). · DOI · Paper page
  2. Miller, L. H., Baruch, D. I., Marsh, K. & Doumbo, O. K. The pathogenic basis of malaria. Nature 415, 673–679 (2002). · DOI
  3. Pino, P., Taoufiq, Z., Nitcheu, J., Vouldoukis, I. & Mazier, D. Blood-brain barrier breakdown during cerebral malaria: suicide or murder? Thromb. Haemost. 94, 336–340 (2005). · DOI
  4. Turner, G. D. et al. An immunohistochemical study of the pathology of fatal malaria. Evidence for widespread endothelial activation and a potential role for intercellular adhesion molecule-1 in cerebral sequestration. Am. J. Pathol. 145, 1057–1069 (1994).
  5. Boonpucknavig, V., Boonpucknavig, S., Udomsangpetch, R. & Nitiyanant, P. An immunofluorescence study of cerebral malaria. A correlation with histopathology. Arch. Pathol. Lab. Med. 114, 1028–1034 (1990).
  6. Brown, H. et al. Evidence of blood-brain barrier dysfunction in human cerebral malaria. Neuropathol. Appl. Neurobiol. 25, 331–340 (1999). · DOI
  7. Jambou, R. et al. Plasmodium falciparum adhesion on human brain microvascular endothelial cells involves transmigration-like cup formation and induces opening of intercellular junctions. PLoS Pathog. 6, e1001021 (2010). · DOI
  8. Pongponratn, E., Riganti, M., Punpoowong, B. & Aikawa, M. Microvascular sequestration of parasitized erythrocytes in human falciparum malaria: a pathological study. Am. J. Trop. Med. Hyg. 44, 168–175 (1991). · DOI
  9. Genrich, G. L. et al. Fatal malaria infection in travelers: novel immunohistochemical assays for the detection of Plasmodium falciparum in tissues and implications for pathogenesis. Am. J. Trop. Med. Hyg. 76, 251–259 (2007). · DOI
  10. Regev-Rudzki, N. et al. Cell-cell communication between malaria-infected red blood cells via exosome-like vesicles. Cell 153, 1120–1133 (2013). · DOI · Paper page
  11. Mantel, P. Y. et al. Malaria-infected erythrocyte-derived microvesicles mediate cellular communication within the parasite population and with the host immune system. Cell Host Microbe 13, 521–534 (2013). · DOI
  12. Combes, V. et al. ABCA1 gene deletion protects against cerebral malaria: potential pathogenic role of microparticles in neuropathology. Am. J. Pathol. 166, 295–302 (2005). · DOI
  13. Couper, K. N. et al. Parasite-derived plasma microparticles contribute significantly to malaria infection-induced inflammation through potent macrophage stimulation. PLoS Pathog. 6, e1000744 (2010). · DOI
  14. Nantakomol, D. et al. Circulating red cell-derived microparticles in human malaria. J. Infect. Dis. 203, 700–706 (2011). · DOI
  15. Pegtel, D. M. et al. Functional delivery of viral miRNAs via exosomes. Proc. Natl Acad. Sci. USA 107, 6328–6333 (2010). · DOI
  16. Dreux, M. et al. Short-range exosomal transfer of viral RNA from infected cells to plasmacytoid dendritic cells triggers innate immunity. Cell Host Microbe 12, 558–570 (2012). · DOI
  17. Vickers, K. C., Palmisano, B. T., Shoucri, B. M., Shamburek, R. D. & Remaley, A. T. MicroRNAs are transported in plasma and delivered to recipient cells by high-density lipoproteins. Nat. Cell Biol. 13, 423–433 (2011). · DOI · Paper page
  18. Meister, G. et al. Human Argonaute2 mediates RNA cleavage targeted by miRNAs and siRNAs. Mol. Cell 15, 185–197 (2004). · DOI · Paper page
  19. Meister, G. & Tuschl, T. Mechanisms of gene silencing by double-stranded RNA. Nature 431, 343–349 (2004). · DOI
  20. Bartel, D. P. MicroRNAs: target recognition and regulatory functions. Cell 136, 215–233 (2009). · DOI · Paper page
  21. O'Connell, R. M., Rao, D. S. & Baltimore, D. microRNA regulation of inflammatory responses. Annu. Rev. Immunol. 30, 295–312 (2012). · DOI · Paper page
  22. Baum, J. et al. Molecular genetics and comparative genomics reveal RNAi is not functional in malaria parasites. Nucleic Acids Res. 37, 3788–3798 (2009). · DOI
  23. Chen, S. Y., Wang, Y., Telen, M. J. & Chi, J. T. The genomic analysis of erythrocyte microRNA expression in sickle cell diseases. PLoS ONE 3, e2360 (2008). · DOI · Paper page
  24. Patrick, D. M. et al. Defective erythroid differentiation in miR-451 mutant mice mediated by 14-3-3zeta. Genes Dev. 24, 1614–1619 (2010). · DOI
  25. Montecalvo, A. et al. Mechanism of transfer of functional microRNAs between mouse dendritic cells via exosomes. Blood 119, 756–766 (2012). · DOI · Paper page
  26. Lawrie, C. H. microRNA expression in erythropoiesis and erythroid disorders. Br. J. Haematol. 150, 144–151 (2010). · DOI
  27. Bei, A. K., Brugnara, C. & Duraisingh, M. T. In vitro genetic analysis of an erythrocyte determinant of malaria infection. J. Infect. Dis. 202, 1722–1727 (2010). · DOI
  28. Klemba, M., Gluzman, I. & Goldberg, D. E. A Plasmodium falciparum dipeptidyl aminopeptidase I participates in vacuolar hemoglobin degradation. J. Biol. Chem. 279, 43000–43007 (2004). · DOI
  29. Arroyo, J. D. et al. Argonaute2 complexes carry a population of circulating microRNAs independent of vesicles in human plasma. Proc. Natl Acad. Sci. USA 108, 5003–5008 (2011). · DOI · Paper page
  30. Schweitzer, K. M. et al. Characterization of a newly established human bone marrow endothelial cell line: distinct adhesive properties for hematopoietic progenitors compared with human umbilical vein endothelial cells. Lab. Invest. 76, 25–36 (1997).
  31. Mulcahy, L. A., Pink, R. C. & Carter, D. R. Routes and mechanisms of extracellular vesicle uptake. J. Extracell. Vesicles 3, http://dx.doi.org/10.3402/jev.v3.24641 (2014). · DOI · Paper page
  32. Macia, E. et al. Dynasore, a cell-permeable inhibitor of dynamin. Dev. Cell 10, 839–850 (2006). · DOI · Paper page
  33. Subtil, A. & Dautry-Varsat, A. Microtubule depolymerization inhibits clathrin coated-pit internalization in non-adherent cell lines while interleukin 2 endocytosis is not affected. J. Cell Sci. 110, 2441–2447 (1997). · DOI
  34. Lamaze, C., Fujimoto, L. M., Yin, H. L. & Schmid, S. L. The actin cytoskeleton is required for receptor-mediated endocytosis in mammalian cells. J. Biol. Chem. 272, 20332–20335 (1997). · DOI
  35. Barres, C. et al. Galectin-5 is bound onto the surface of rat reticulocyte exosomes and modulates vesicle uptake by macrophages. Blood 115, 696–705 (2010). · DOI
  36. Argaw, A. T. et al. IL-1beta regulates blood-brain barrier permeability via reactivation of the hypoxia-angiogenesis program. J. Immunol. 177, 5574–5584 (2006). · DOI
  37. Raab, M. et al. Variation of adhesion molecule expression on human umbilical vein endothelial cells upon multiple cytokine application. Clin. Chim. Acta 321, 11–16 (2002). · DOI
  38. Zhan, M., Miller, C. P., Papayannopoulou, T., Stamatoyannopoulos, G. & Song, C. Z. MicroRNA expression dynamics during murine and human erythroid differentiation. Exp. Hematol. 35, 1015–1025 (2007). · DOI
  39. Dore, L. C. et al. A GATA-1-regulated microRNA locus essential for erythropoiesis. Proc. Natl Acad. Sci. USA 105, 3333–3338 (2008). · DOI · Paper page
  40. Lee, Y. et al. MicroRNA genes are transcribed by RNA polymerase II. EMBO J. 23, 4051–4060 (2004). · DOI
  41. Laurance, S. et al. Hydroxycarbamide stimulates the production of proinflammatory cytokines by endothelial cells: relevance to sickle cell disease. Pharmacogenet. Genomics 20, 257–268 (2010). · DOI
  42. Orom, U. A. et al. MicroRNA-203 regulates caveolin-1 in breast tissue during caloric restriction. Cell Cycle 11, 1291–1295 (2012). · DOI
  43. Lv, G. et al. MicroRNA-451 regulates activating transcription factor 2 expression and inhibits liver cancer cell migration. Oncol. Rep. 32, 1021–1028 (2014). · DOI
  44. Lopotova, T., Zackova, M., Klamova, H. & Moravcova, J. MicroRNA-451 in chronic myeloid leukemia: miR-451-BCR-ABL regulatory loop? Leuk. Res. 35, 974–977 (2011). · DOI
  45. Yin, P. et al. MiR-451 suppresses cell proliferation and metastasis in A549 lung cancer cells. Mol. Biotechnol. 57, 1–11 (2015). · DOI
  46. Bastiani, M. & Parton, R. G. Caveolae at a glance. J. Cell Sci. 123, 3831–3836 (2010). · DOI
  47. Lau, E. & Ronai, Z. A. ATF2 - at the crossroad of nuclear and cytosolic functions. J. Cell Sci. 125, 2815–2824 (2012). · DOI
  48. Song, L., Ge, S. & Pachter, J. S. Caveolin-1 regulates expression of junction-associated proteins in brain microvascular endothelial cells. Blood 109, 1515–1523 (2007). · DOI
  49. Bauer, P. M. et al. Endothelial-specific expression of caveolin-1 impairs microvascular permeability and angiogenesis. Proc. Natl Acad. Sci. USA 102, 204–209 (2005). · DOI
  50. Valadi, H. et al. Exosome-mediated transfer of mRNAs and microRNAs is a novel mechanism of genetic exchange between cells. Nat. Cell Biol. 9, 654–659 (2007). · DOI · Paper page
  51. Skog, J. et al. Glioblastoma microvesicles transport RNA and proteins that promote tumour growth and provide diagnostic biomarkers. Nat. Cell Biol. 10, 1470–1476 (2008). · DOI · Paper page
  52. Cheloufi, S., Dos Santos, C. O., Chong, M. M. & Hannon, G. J. A dicer-independent miRNA biogenesis pathway that requires Ago catalysis. Nature 465, 584–589 (2010). · DOI · Paper page
  53. Cifuentes, D. et al. A novel miRNA processing pathway independent of Dicer requires Argonaute2 catalytic activity. Science 328, 1694–1698 (2010). · DOI
  54. Zhang, Y. et al. Secreted monocytic miR-150 enhances targeted endothelial cell migration. Mol. Cell 39, 133–144 (2010). · DOI
  55. Bhoumik, A., Jones, N. & Ronai, Z. Transcriptional switch by activating transcription factor 2-derived peptide sensitizes melanoma cells to apoptosis and inhibits their tumorigenicity. Proc. Natl Acad. Sci. USA 101, 4222–4227 (2004). · DOI
  56. Bhoumik, A. et al. An ATF2-derived peptide sensitizes melanomas to apoptosis and inhibits their growth and metastasis. J. Clin. Invest. 110, 643–650 (2002). · DOI
  57. Hemmer, C. J. et al. Plasmodium falciparum malaria: reduction of endothelial cell apoptosis in vitro. Infect. Immun. 73, 1764–1770 (2005). · DOI
  58. Lin, M. I., Yu, J., Murata, T. & Sessa, W. C. Caveolin-1-deficient mice have increased tumor microvascular permeability, angiogenesis, and growth. Cancer Res. 67, 2849–2856 (2007). · DOI
  59. Jackson, K. E. et al. Selective permeabilization of the host cell membrane of Plasmodium falciparum-infected red blood cells with streptolysin O and equinatoxin II. Biochem. J. 403, 167–175 (2007). · DOI
  60. Perron, M. P., Landry, P., Plante, I. & Provost, P. Detection of human Dicer and Argonaute 2 catalytic activity. Methods Mol Biol 725, 121–141 (2011). · DOI
  61. Landry, P. et al. Existence of a microRNA pathway in anucleate platelets. Nat. Struct. Mol. Biol. 16, 961–966 (2009). · DOI
  62. Lu, J. & Tsourkas, A. Quantification of miRNA abundance in single cells using locked nucleic acid-FISH and enzyme-labelled fluorescence. Methods Mol. Biol. 680, 77–88 (2011). · DOI
  63. Alves, M. P. et al. Toll-like receptor 7 and MyD88 knockdown by lentivirus-mediated RNA interference to porcine dendritic cell subsets. Gene Ther. 14, 836–844 (2007). · DOI
  64. Martinelli, R. et al. Probing the biomechanical contribution of the endothelium to lymphocyte migration: diapedesis by the path of least resistance. J. Cell Sci. 127, 3720–3734 (2014). · DOI

Cited by

Sorted by citations

Metadata

Authors
Mantel, P.-Y., Hjelmqvist, D., Walch, M., Kharoubi-Hess, S., Nilsson, S., Ravel, D., Ribeiro, M., Grüring, C., Ma, S., Padmanabhan, P., Trachtenberg, A., Ankarklev, J., Brancucci, N. M., Huttenhower, C., Duraisingh, M. T., Ghiran, I., Kuo, W. P., Filgueira, L., Martinelli, R., & Marti, M.
Venue
Nature Communications
Published
2016-10-10
Volume
7
Issue
1
ISSN
2041-1723
Cited by
237
References
3
Language
en

About these checks

Registry, retraction, Cites and statistics results are computed, not judged, with one exception: a printed reference that no index lists is read once by a model before it counts as a citation error. Claims are extracted by a model and kept only when their quote appears verbatim in the text; each cited source is then checked, with a model’s help, for whether it says what the claim relies on. Those verdicts can be wrong — read the claim’s quote and the cited source before relying on one.

Statistics and arithmetic are recomputed, not judged.

Confidence bands are shown only for fields calibrated on our annotated test set. None is calibrated yet, so no band is shown.

What counts as a claim ›How we measure confidence ›How we check this ›

Are you an author, or do you see a problem with this page? Request a review