

The DOI matches its Crossref record; 16 of the 16 references it cites were found in a registry or an index.
Ancestry and demography and descendants of Iron Age nomads of the Eurasian Steppe
Abstract
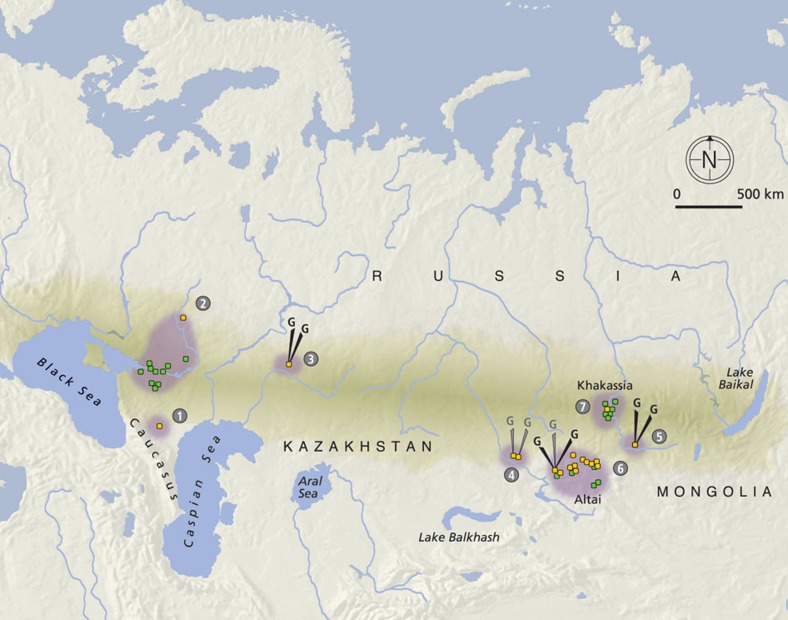
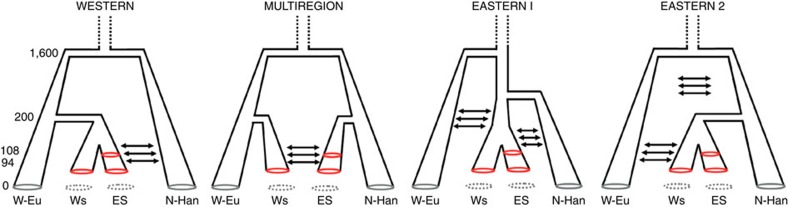
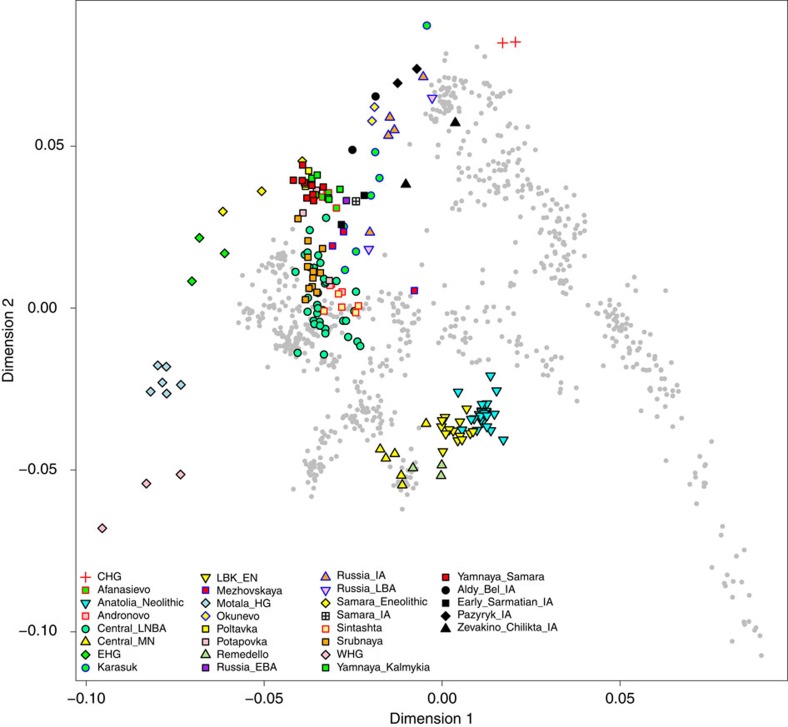
During the 1 st millennium before the Common Era (BCE), nomadic tribes associated with the Iron Age Scythian culture spread over the Eurasian Steppe, covering a territory of more than 3,500 km in breadth. To understand the demographic processes behind the spread of the Scythian culture, we analysed genomic data from eight individuals and a mitochondrial dataset of 96 individuals originating in eastern and western parts of the Eurasian Steppe. Genomic inference reveals that Scythians in the east and the west of the steppe zone can best be described as a mixture of Yamnaya-related ancestry and an East Asian component. Demographic modelling suggests independent origins for eastern and western groups with ongoing gene-flow between them, plausibly explaining the striking uniformity of their material culture. We also find evidence that significant gene-flow from east to west Eurasia must have occurred early during the Iron Age.
Overview
The claims and statistics of this paper haven’t been checked yet.
Run the check — free, no account needed. It reads the open-access text and checks the sources it cites.
Integrity signals
Registry
Cites
Statistics
Figures
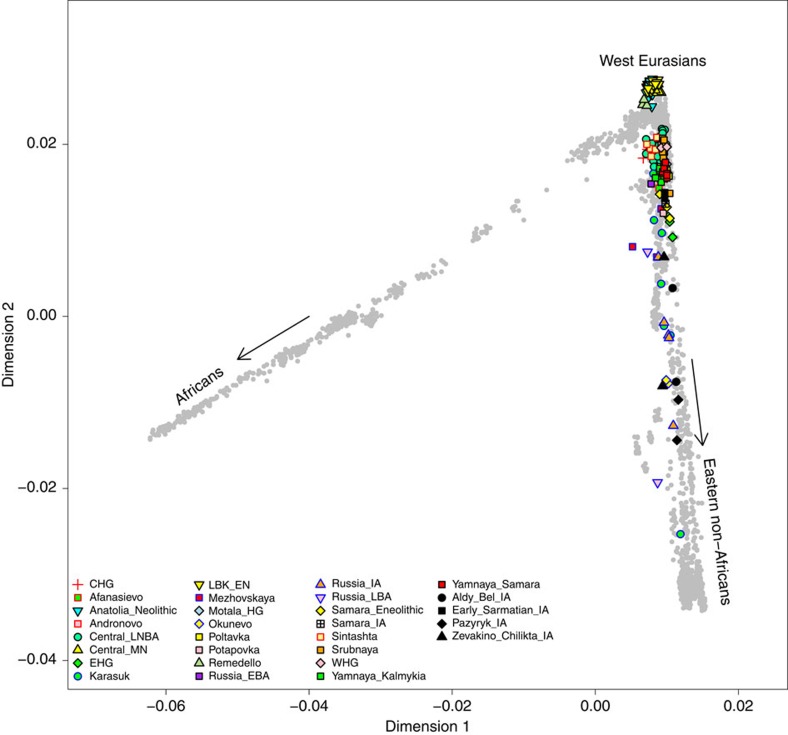
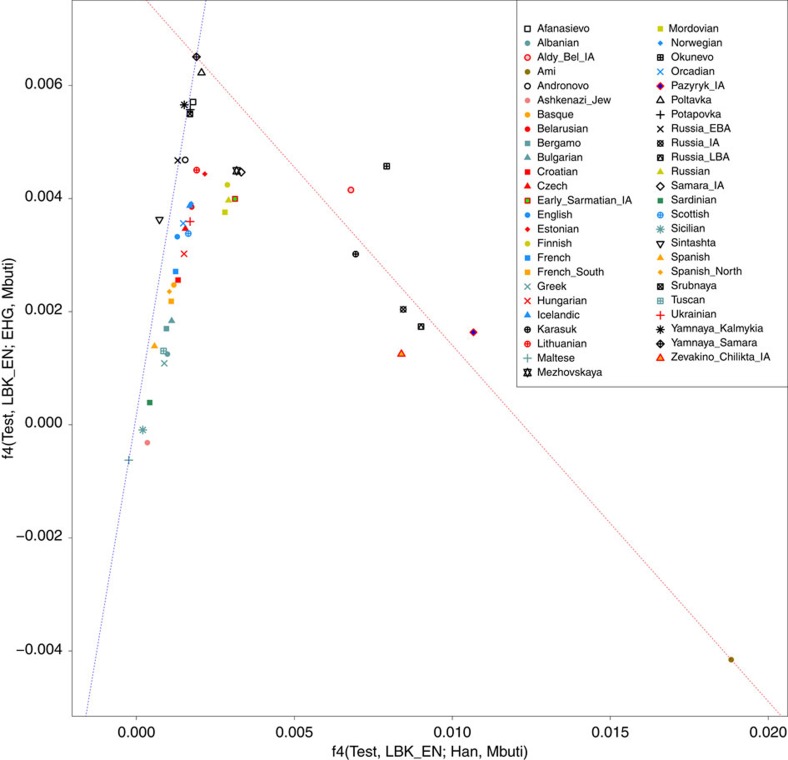
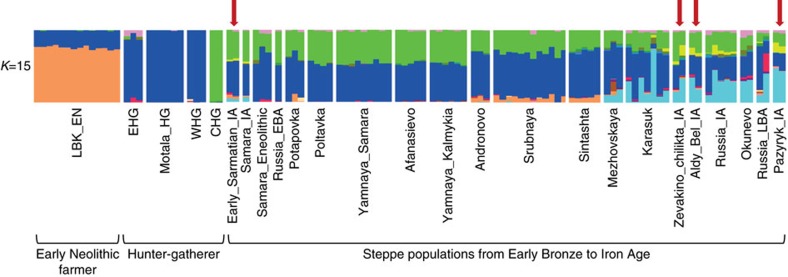
Verification
Claims the paper makes
The claims and statistics of this paper haven’t been checked yet.
Run the check — free, no account needed. It reads the open-access text and checks the sources it cites.
Claims other papers make about this one
Each is checked against this paper’s own text: does it say what the citing paper says it does?
In the citing paper
“Central Asian pastoralists, who are organized into patriclans, have high levels of intergroup competition and demonstrate ethnolinguistic and population-genetic turnover down into the historical period59”
From Cultural hitchhiking and competition between patrilineal kin groups explain the post-Neolithic Y-chromosome bottleneck (2018) · cites this paper as [59]
Self-check
Percentages, sums and reported differences re-computed from the paper’s own numbers.
The self-check needs the paper’s full text.
Citations
Cites
An integrated map of genetic variation from 1,092 human genomes
The 1000 Genomes Project Consortium (2012) · Nature · doi:10.1038/nature11632 · Cited by 7,711
Population Structure and Eigenanalysis
Patterson, N., Price, A. L., & Reich, D. (2006) · PLoS Genetics · doi:10.1371/journal.pgen.0020190 · Cited by 5,280
Self-citationAncient Admixture in Human History
Patterson, N., Moorjani, P., Luo, Y., Mallick, S., Rohland, N., Zhan, Y., Genschoreck, T., Webster, T., & Reich, D. (2012) · Genetics · doi:10.1534/genetics.112.145037 · Cited by 2,848
Self-citationGenome-wide detection and characterization of positive selection in human populations
The International HapMap Consortium, Sabeti, P. C., Varilly, P., Fry, B., Lohmueller, J., Hostetter, E., Cotsapas, C., Xie, X., Byrne, E. H., McCarroll, S. A., et al. (2007) · Nature · doi:10.1038/nature06250 · Cited by 2,131
Massive migration from the steppe was a source for Indo-European languages in Europe
Haak, W., Lazaridis, I., Patterson, N., Rohland, N., Mallick, S., Llamas, B., Brandt, G., Nordenfelt, S., Harney, E., Stewardson, K., et al. (2015) · Nature · doi:10.1038/nature14317 · Cited by 1,940
Self-citationUpdated comprehensive phylogenetic tree of global human mitochondrial DNA variation
van Oven, M., & Kayser, M. (2009) · Human Mutation · doi:10.1002/humu.20921 · Cited by 1,810
Population genomics of Bronze Age Eurasia
Allentoft, M. E., Sikora, M., Sjögren, K.-G., Rasmussen, S., Rasmussen, M., Stenderup, J., Damgaard, P. B., Schroeder, H., Ahlström, T., Vinner, L., et al. (2015) · Nature · doi:10.1038/nature14507 · Cited by 1,550
Self-citationGenome-wide patterns of selection in 230 ancient Eurasians
Mathieson, I., Lazaridis, I., Rohland, N., Mallick, S., Patterson, N., Roodenberg, S. A., Harney, E., Stewardson, K., Fernandes, D., Novak, M., et al. (2015) · Nature · doi:10.1038/nature16152 · Cited by 1,515
Self-citationAncient human genomes suggest three ancestral populations for present-day Europeans
Lazaridis, I., Patterson, N., Mittnik, A., Renaud, G., Mallick, S., Kirsanow, K., Sudmant, P. H., Schraiber, J. G., Castellano, S., Lipson, M., et al. (2014) · Nature · doi:10.1038/nature13673 · Cited by 1,357
Self-citationApproximate Bayesian Computation (ABC) in practice
Csilléry, K., Blum, M. G. B., Gaggiotti, O. E., & François, O. (2010) · Trends in Ecology & Evolution · doi:10.1016/j.tree.2010.04.001 · Cited by 1,302
Double indexing overcomes inaccuracies in multiplex sequencing on the Illumina platform
Kircher, M., Sawyer, S., & Meyer, M. (2012) · Nucleic Acids Research · doi:10.1093/nar/gkr771 · Cited by 1,106
Genome sequence of a 45,000-year-old modern human from western Siberia
Fu, Q., Li, H., Moorjani, P., Jay, F., Slepchenko, S. M., Bondarev, A. A., Johnson, P. L. F., Aximu-Petri, A., Prüfer, K., de Filippo, C., et al. (2014) · Nature · doi:10.1038/nature13810 · Cited by 1,023
Self-citationUpper Palaeolithic Siberian genome reveals dual ancestry of Native Americans
Raghavan, M., Skoglund, P., Graf, K. E., Metspalu, M., Albrechtsen, A., Moltke, I., Rasmussen, S., Stafford Jr, T. W., Orlando, L., Metspalu, E., et al. (2014) · Nature · doi:10.1038/nature12736 · Cited by 963
An early modern human from Romania with a recent Neanderthal ancestor
Fu, Q., Hajdinjak, M., Moldovan, O. T., Constantin, S., Mallick, S., Skoglund, P., Patterson, N., Rohland, N., Lazaridis, I., Nickel, B., et al. (2015) · Nature · doi:10.1038/nature14558 · Cited by 802
Self-citationUpper Palaeolithic genomes reveal deep roots of modern Eurasians
Jones, E. R., Gonzalez-Fortes, G., Connell, S., Siska, V., Eriksson, A., Martiniano, R., McLaughlin, R. L., Gallego Llorente, M., Cassidy, L. M., Gamba, C., et al. (2015) · Nature Communications · doi:10.1038/ncomms9912 · Cited by 417
Self-citationGenomic structure in Europeans dating back at least 36,200 years
Seguin-Orlando, A., Korneliussen, T. S., Sikora, M., Malaspinas, A.-S., Manica, A., Moltke, I., Albrechtsen, A., Ko, A., Margaryan, A., Moiseyev, V., et al. (2014) · Science · doi:10.1126/science.aaa0114 · Cited by 315
Research works printed but not linked: 47
- Herodotus, Herodotus: The History University of Chicago Press (1987). · DOI
- Grjaznov, M. P. Der Großkurgan von Arzan in Tuva, Südsibirien Vol. 23, (C.H. Beck, 1984).
- Alekseev, A. Y. et al. A chronology of the Scythian antiquities of Eurasia based on new archaeological and 14C data. Radiocarbon 43, 1085–1107 (2001). · DOI
- Alekseev, A. Y. et al. Some problems in the study of the chronology of the ancient nomadic cultures in Eurasia (9th–3rd centuries BC). Geochronometria 21, 143–150 (2002).
- Lalueza-Fox, C. et al. Unravelling migrations in the steppe: mitochondrial DNA sequences from ancient central Asians. Proc. R. Soc. Lond. B Biol. Sci. 271, 941–947 (2004). · DOI
- Comas, D. et al. Trading genes along the silk road: mtDNA sequences and the origin of central Asian populations. Am. J. Hum. Genet. 63, 1824–1838 (1998). · DOI · Paper page
- Comas, D. et al. Admixture, migrations, and dispersals in Central Asia: evidence from maternal DNA lineages. Eur. J. Hum. Genet. 12, 495–504 (2004). · DOI · Paper page
- Quintana-Murci, L. et al. Where west meets east: the complex mtDNA landscape of the southwest and Central Asian corridor. Am. J. Hum. Genet. 74, 827–845 (2004). · DOI · Paper page
- Martinez-Cruz, B. et al. In the heartland of Eurasia: the multilocus genetic landscape of Central Asian populations. Eur. J. Hum. Genet. 19, 216–223 (2011). · DOI
- Palstra, F. P., Heyer, E. & Austerlitz, F. Statistical inference on genetic data reveals the complex demographic history of human populations in Central Asia. Mol. Biol. Evol. 32, 1411–1424 (2015). · DOI · Paper page
- Chaix, R., Austerlitz, F., Hegay, T., Quintana-Murci, L. & Heyer, E. Genetic traces of east-to-west human expansion waves in Eurasia. Am. J. Phys. Anthropol. 136, 309–317 (2008). · DOI
- Der Sarkissian, C. et al. Ancient DNA reveals prehistoric gene-flow from Siberia in the complex human population history of North East Europe. PLoS Genet. 9, e1003296 (2013). · DOI
- Li, C. et al. Evidence that a west-east admixed population lived in the Tarim Basin as early as the early Bronze Age. BMC Biol. 8, 15 (2010). · DOI · Paper page
- Ricaut, F. X., Keyser-Tracqui, C., Cammaert, L., Crubezy, E. & Ludes, B. Genetic analysis and ethnic affinities from two Scytho-Siberian skeletons. Am. J. Phys. Anthropol. 123, 351–360 (2004). · DOI
- Pilipenko, A., Romaschenko, A., Molodin, V., Parzinger, H. & Kobzev, V. Mitochondrial DNA studies of the Pazyryk people (4th to 3rd centuries BC) from northwestern Mongolia. Archaeol. Anthropol. Sci. 2, 231–236 (2010). · DOI
- Clisson, I. et al. Genetic analysis of human remains from a double inhumation in a frozen kurgan in Kazakhstan (Berel site, early 3rd century BC). Int. J. Legal. Med. 116, 304–308 (2002). · DOI
- González-Ruiz, M. et al. Tracing the origin of the east-west population admixture in the Altai region (Central Asia). PloS ONE 7, e48904 (2012). · DOI
- Van Noten, F. & Polosmak, N. The frozen tombs of the Scythians. Endeavour 19, 76–82 (1995). · DOI
- Beaumont, M. A., Zhang, W. & Balding, D. J. Approximate Bayesian computation in population genetics. Genetics 162, 2025–2035 (2002). · DOI · Paper page
- Kohl, P. L. The Making of Bronze Age Eurasia Cambridge University Press (2007). · DOI
- Molodin, V. I. et al. in Population Dynamics in Prehistory and Early History—New Approaches Using Stable Isotopes and Genetics (eds Burger, J., Kaiser, E.& Schier, W.) 93-112 (De Gruyter, 2012).
- Keyser, C. et al. Ancient DNA provides new insights into the history of south Siberian kurgan people. Hum. Genet. 126, 395–410 (2009). · DOI · Paper page
- Molodin, V. I., Pilipenko, A. S., Zhuravlev, A. A., Trapezov, R. O. & Romashchenko, A. G. An analysis of mitochondrial DNA from the Pakhomovskaya population of the late Bronze Age, Western Siberia. Archaeol. Ethnol. Anthropol. Eurasia 40, 62–69 (2012). · DOI
- Alexander, D. H., Novembre, J. & Lange, K. Fast model-based estimation of ancestry in unrelated individuals. Genome Res. 19, 1655–1664 (2009). · DOI · Paper page
- Alexander, D. & Lange, K. Enhancements to the ADMIXTURE algorithm for individual ancestry estimation. BMC Bioinformatics 12, 246 (2011). · DOI
- Soejima, M., Tachida, H., Ishida, T., Sano, A. & Koda, Y. Evidence for recent positive selection at the human AIM1 locus in a European population. Mol. Biol. Evol. 23, 179–188 (2006). · DOI · Paper page
- Wilde, S. et al. Direct evidence for positive selection of skin, hair, and eye pigmentation in Europeans during the last 5,000 y. Proc. Natl Acad. Sci. USA 111, 4832–4837 (2014). · DOI · Paper page
- Han, Y. et al. Evidence of positive selection on a class I ADH locus. Am. J. Hum. Genet. 80, 441–456 (2007). · DOI
- Peng, Y. et al. The ADH1B Arg47His polymorphism in East Asian populations and expansion of rice domestication in history. BMC Evol. Biol. 10, 15 (2010). · DOI
- Hollard, C. et al. Strong genetic admixture in the Altai at the Middle Bronze Age revealed by uniparental and ancestry informative markers. Forensic Sci. Int. Genet. 12, 199–207 (2014). · DOI
- Hellenthal, G. et al. A genetic atlas of human admixture history. Science 343, 747–751 (2014). · DOI · Paper page
- Torroni, A. et al. Native American mitochondrial DNA analysis indicates that the Amerind and the Nadene populations were founded by two independent migrations. Genetics 130, 153–162 (1992). · DOI
- Finnilä, S., Lehtonen, M. S. & Majamaa, K. Phylogenetic network for European mtDNA. Am. J. Hum. Genet. 68, 1475–1484 (2001). · DOI
- Kivisild, T. et al. The emerging limbs and twigs of the East Asian mtDNA tree. Mol. Biol. Evol. 19, 1737–1751 (2002). · DOI · Paper page
- Meyer, M., Stenzel, U. & Hofreiter, M. Parallel tagged sequencing on the 454 platform. Nat. Protoc. 3, 267–278 (2008). · DOI
- Niu, B., Fu, L., Sun, S. & Li, W. Artificial and natural duplicates in pyrosequencing reads of metagenomic data. BMC Bioinformatics 11, 187 (2010). · DOI
- Katoh, K., Misawa, K., Kuma, K. & Miyata, T. MAFFT: a novel method for rapid multiple sequence alignment based on fast Fourier transform. Nucleic Acids Res. 30, 3059–3066 (2002). · DOI · Paper page
- Kloss-Brandstätter, A. et al. HaploGrep: a fast and reliable algorithm for automatic classification of mitochondrial DNA haplogroups. Hum. Mutat. 32, 25–32 (2011). · DOI
- Excoffier, L. & Lischer, H. E. Arlequin suite ver 3.5: a new series of programs to perform population genetics analyses under Linux and Windows. Mol. Ecol. Resour. 10, 564–567 (2010). · DOI
- Nei, M. Molecular Evolutionary Genetics Columbia University Press (1987). · DOI
- Tajima, F. Evolutionary relationship of DNA sequences in finite populations. Genetics 105, 437–460 (1983). · DOI
- Reynolds, J., Weir, B. S. & Cockerhem, C. C. Estimation of the coancestry coefficient: basis for a short-term genetic distance. Genetics 105, 767–779 (1983). · DOI
- Fu, Y. X. Statistical tests of neutrality of mutations against population growth, hitchhiking and background selection. Genetics 147, 915–925 (1997). · DOI
- Anderson, C. N., Ramakrishnan, U., Chan, Y. L. & Hadly, E. A. Serial SimCoal: a population genetics model for data from multiple populations and points in time. Bioinformatics 21, 1733–1734 (2005). · DOI
- Excoffier, L., Novembre, J. & Schneider, S. SIMCOAL: a general coalescent program for the simulation of molecular data in interconnected populations with arbitrary demography. J. Hered. 91, 506–509 (2000). · DOI
- Librado, P. & Rozas, J. DnaSP v5: a software for comprehensive analysis of DNA polymorphism data. Bioinformatics 25, 1451–1452 (2009). · DOI
- Csillery, K., Francois, O. & Blum, M. G. B. abc: an R package for approximate Bayesian computation (ABC). Methods Ecol. Evol. 3, 475–479 (2012). · DOI
Cited by
A Dynamic 6,000-Year Genetic History of Eurasia’s Eastern Steppe
Jeong, C., Wang, K., Wilkin, S., Taylor, W. T. T., Miller, B. K., Bemmann, J. H., Stahl, R., Chiovelli, C., Knolle, F., Ulziibayar, S., et al. (2020) · Cell · doi:10.1016/j.cell.2020.10.015 · Cited by 328
Ancient Genomics of Modern Humans: The First Decade
Skoglund, P., & Mathieson, I. (2018) · Annual Review of Genomics and Human Genetics · doi:10.1146/annurev-genom-083117-021749 · Cited by 246
Zeng, T. C., Aw, A. J., & Feldman, M. W. (2018) · Nature Communications · doi:10.1038/s41467-018-04375-6 · Cited by 121
Zhabagin, M., Wei, L.-H., Sabitov, Z., Ma, P.-C., Sun, J., Dyussenova, Z., Balanovska, E., Li, H., & Ramankulov, Y. (2022) · Genes · doi:10.3390/genes13101776 · Cited by 17
Silva, N. M., Rio, J., Kreutzer, S., Papageorgopoulou, C., & Currat, M. (2018) · Evolutionary Applications · doi:10.1111/eva.12655 · Cited by 11
Self-citation
Metadata
- Authors
- Unterländer, M., Palstra, F., Lazaridis, I., Pilipenko, A., Hofmanová, Z., Groß, M., Sell, C., Blöcher, J., Kirsanow, K., Rohland, N., Rieger, B., Kaiser, E., Schier, W., Pozdniakov, D., Khokhlov, A., Georges, M., Wilde, S., Powell, A., Heyer, E., Currat, M., Reich, D., Samashev, Z., Parzinger, H., Molodin, V. I., & Burger, J.
- Venue
- Nature Communications
- Published
- 2017-03-03
- Volume
- 8
- Issue
- 1
- ISSN
- 2041-1723
- PMC
- PMC5337992
- Cited by
- 142
- References
- 16
- Language
- en
About these checks
Registry, retraction, Cites and statistics results are computed, not judged, with one exception: a printed reference that no index lists is read once by a model before it counts as a citation error. Claims are extracted by a model and kept only when their quote appears verbatim in the text; each cited source is then checked, with a model’s help, for whether it says what the claim relies on. Those verdicts can be wrong — read the claim’s quote and the cited source before relying on one.
Statistics and arithmetic are recomputed, not judged.
Confidence bands are shown only for fields calibrated on our annotated test set. None is calibrated yet, so no band is shown.
What counts as a claim ›How we measure confidence ›How we check this ›
Are you an author, or do you see a problem with this page? Request a review
