

The DOI matches its Crossref record; 62 of the 62 references it cites were found in a registry or an index.
A draft network of ligand–receptor-mediated multicellular signalling in human
Open accessAbstract
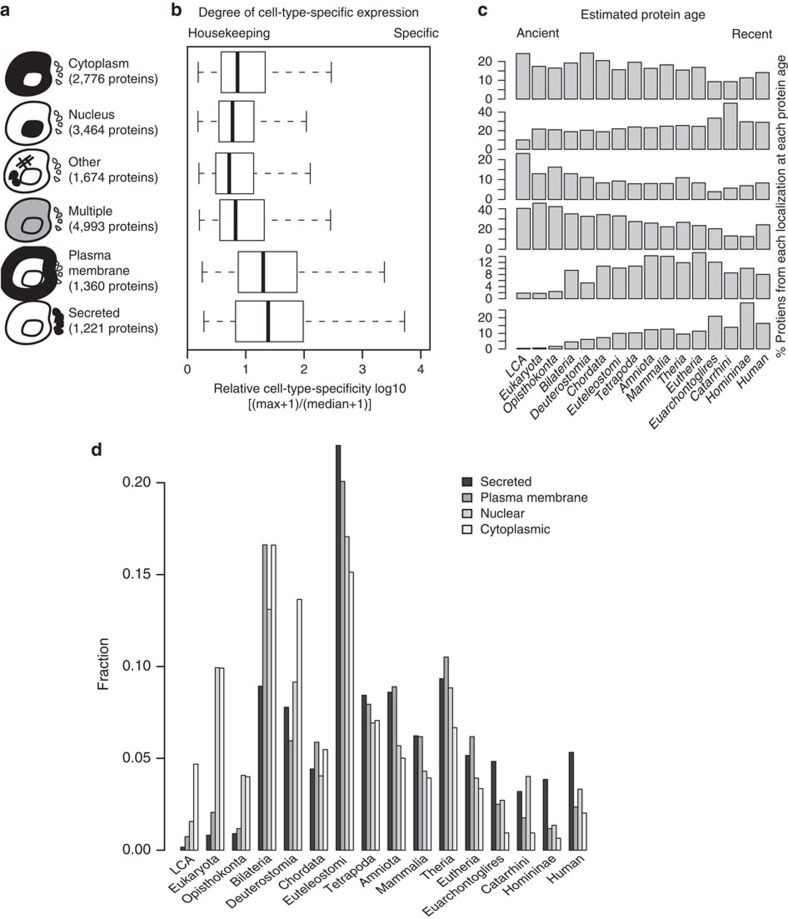
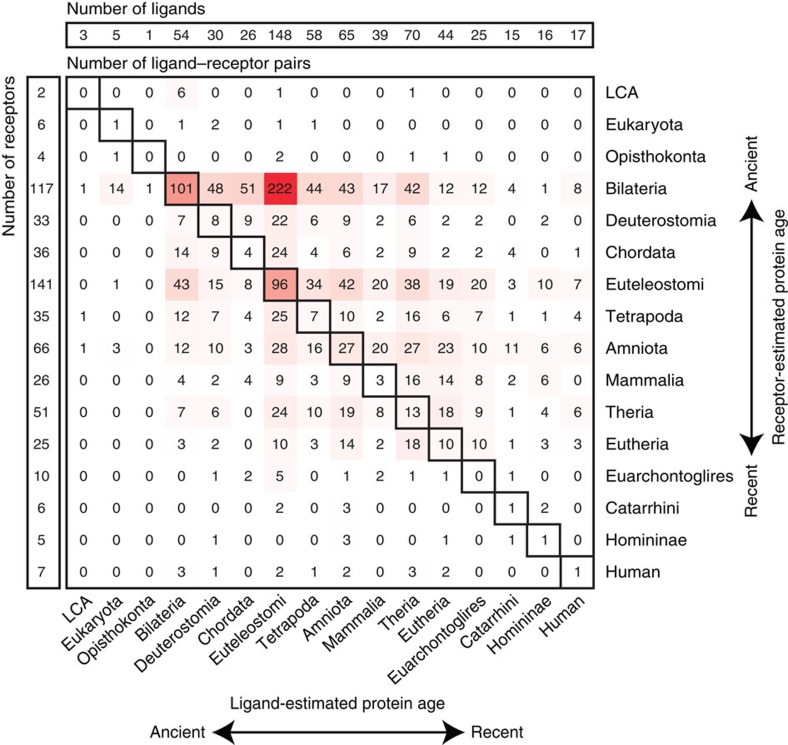
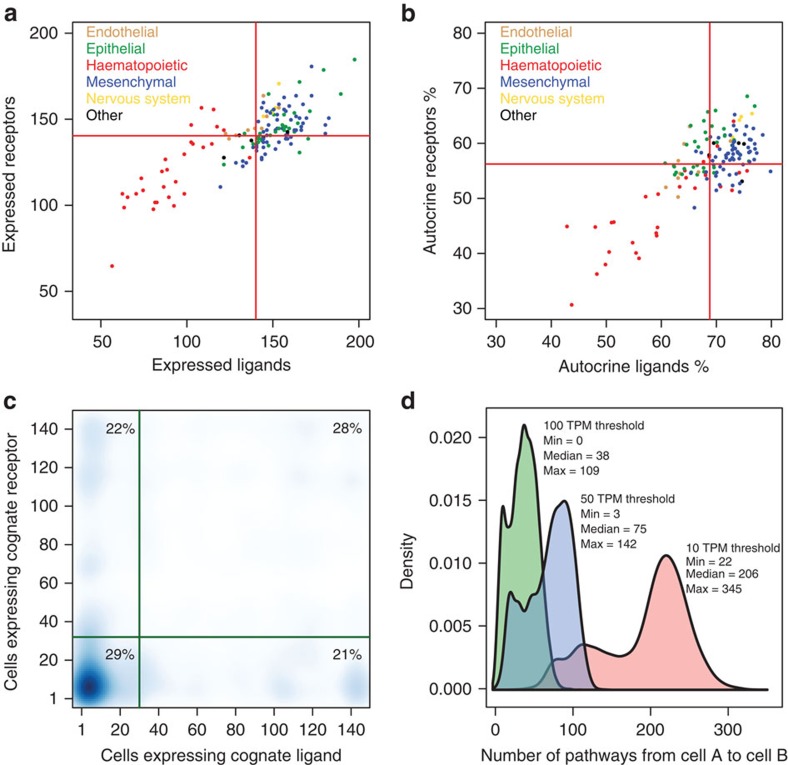
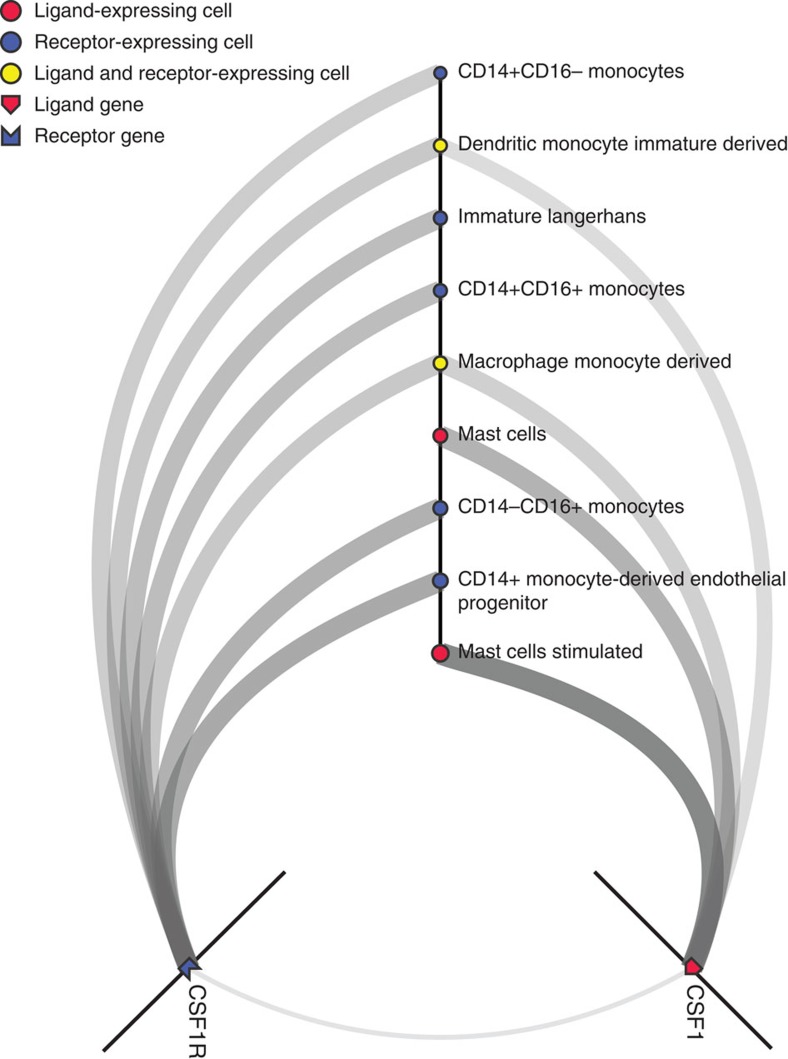
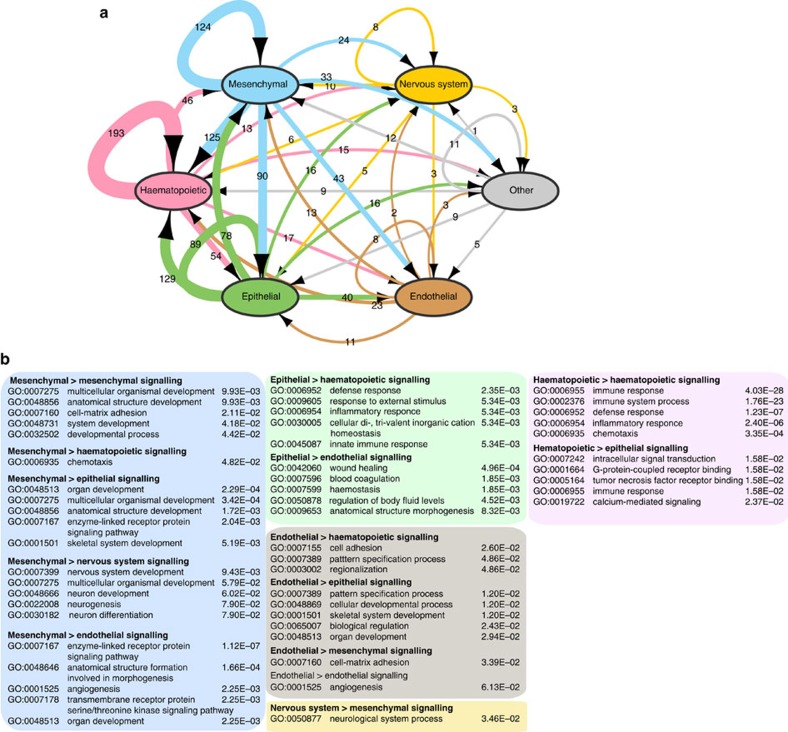
Cell-to-cell communication across multiple cell types and tissues strictly governs proper functioning of metazoans and extensively relies on interactions between secreted ligands and cell-surface receptors. Herein, we present the first large-scale map of cell-to-cell communication between 144 human primary cell types. We reveal that most cells express tens to hundreds of ligands and receptors to create a highly connected signalling network through multiple ligand-receptor paths. We also observe extensive autocrine signalling with approximately two-thirds of partners possibly interacting on the same cell type. We find that plasma membrane and secreted proteins have the highest cell-type specificity, they are evolutionarily younger than intracellular proteins, and that most receptors had evolved before their ligands. We provide an online tool to interactively query and visualize our networks and demonstrate how this tool can reveal novel cell-to-cell interactions with the prediction that mast cells signal to monoblastic lineages via the CSF1-CSF1R interacting pair.
Overview
The claims and statistics of this paper haven’t been checked yet.
Run the check — free, no account needed. It reads the open-access text and checks the sources it cites.
Integrity signals
Registry
Cites
Statistics
Figures
Verification
Claims the paper makes
The claims and statistics of this paper haven’t been checked yet.
Run the check — free, no account needed. It reads the open-access text and checks the sources it cites.
Claims other papers make about this one
Each is checked against this paper’s own text: does it say what the citing paper says it does?
The cited source says what the claim attributes to it.
In the citing paper
“Based on a database of ligand-receptor pairs (Ramilowski et al., 2015), TSKs participated in extensive autocrine and paracrine interactions (mostly with CAFs, endothelial cells, macrophages, and MDSCs)”
From Multimodal Analysis of Composition and Spatial Architecture in Human Squamous Cell Carcinoma (2020) · cites this paper as Ramilowski et al., 2015
The cited source says what the claim attributes to it.
In the citing paper
“There were also 22 trans-CDS associations between known ligand–receptor pairs37 (Supplementary Table 11).”
From Rare variant associations with plasma protein levels in the UK Biobank (2023) · cites this paper as [37]
The check wasn’t confident either way, so it gives no verdict — never disputed.
In the citing paper
“A literature review of newly published experimental reports was used to validate 7 of the top 20 and 2 of the bottom predicted ATG dark genes (73).”
From Artificial Intelligence for Drug Discovery: Are We There Yet? (2024) · cites this paper as [73]
Experimental — accuracy not yet measuredThe check wasn’t confident either way, so it gives no verdict — never disputed.
In the citing paper
“Given the complexity of ATG-associated genomic datasets, an ATG-specific XGBoost machine learning model was developed to aid in designing relevant experiments (73).”
From Artificial Intelligence for Drug Discovery: Are We There Yet? (2024) · cites this paper as [73]
Experimental — accuracy not yet measuredThe check wasn’t confident either way, so it gives no verdict — never disputed.
In the citing paper
“The ATG-specific meta-path XGBoost model used 103 ATG-associated (positive) genes and 3468 negatives (not ATG-associated genes), collating data from Pharos.”
From Artificial Intelligence for Drug Discovery: Are We There Yet? (2024) · cites this paper as [73]
Experimental — accuracy not yet measured
The check wasn’t confident either way, so it gives no verdict — never disputed.
In the citing paper
“Among the top 251 genes predicted to have ATG associations, 43 genes were already in the Autophagy Database, and another 15 had potential ATG associations.”
From Artificial Intelligence for Drug Discovery: Are We There Yet? (2024) · cites this paper as [73]
Experimental — accuracy not yet measured
Self-check
Percentages, sums and reported differences re-computed from the paper’s own numbers.
The self-check needs the paper’s full text.
Citations
Cites
Cytoscape: A software Environment for integrated models of biomolecular interaction networks
Shannon, P., Markiel, A., Ozier, O., Baliga, N. S., Wang, J. T., Ramage, D., Amin, N., Schwikowski, B., & Ideker, T. (2003) · Genome Research · doi:10.1101/gr.1239303 · Cited by 51,888
Gene Ontology: tool for the unification of biology
Ashburner, M., Ball, C. A., Blake, J. A., Botstein, D., Butler, H., Cherry, J. M., Davis, A. P., Dolinski, K., Dwight, S. S., Eppig, J. T., et al. (2000) · Nature Genetics · doi:10.1038/75556 · Cited by 43,206
Gephi: An Open Source Software for Exploring and Manipulating Networks
Bastian, M., Heymann, S., & Jacomy, M. (2009) · Proceedings of the International AAAI Conference on Web and Social Media · doi:10.1609/icwsm.v3i1.13937 · Cited by 11,675
DAVID: Database for Annotation, Visualization, and Integrated Discovery
Dennis, G., Sherman, B. T., Hosack, D. A., Yang, J., Gao, W., Lane, H. C., & Lempicki, R. A. (2003) · Genome Biology · doi:10.1186/gb-2003-4-5-p3 · Cited by 9,327
Inflammation and metabolic disorders
Hotamisligil, G. S. (2006) · Nature · doi:10.1038/nature05485 · Cited by 9,199
Highly parallel genome-wide expression profiling of individual cells using nanoliter droplets.
Macosko, E. Z., Basu, A., Satija, R., Nemesh, J., Shekhar, K., Goldman, M., Tirosh, I., Bialas, A. R., Kamitaki, N., Martersteck, E. M., et al. (2015) · Cell · doi:10.1016/j.cell.2015.05.002 · Cited by 7,110
OrthoMCL: Identification of Ortholog Groups for Eukaryotic Genomes
Li, L., Stoeckert, C. J., & Roos, D. S. (2003) · Genome Research · doi:10.1101/gr.1224503 · Cited by 5,707
STRING v9.1: protein-protein interaction networks, with increased coverage and integration
Franceschini, A., Szklarczyk, D., Frankild, S., Kuhn, M., Simonovic, M., Roth, A., Lin, J., Minguez, P., Bork, P., von Mering, C., et al. (2012) · Nucleic Acids Research · doi:10.1093/nar/gks1094 · Cited by 4,398
Human Protein Reference Database--2009 update
Prasad, T. S. K., Goel, R., Kandasamy, K., Keerthikumar, S., Kumar, S., Mathivanan, S., Telikicherla, D., Raju, R., Shafreen, R. B., Venugopal, A., et al. (2008) · Nucleic Acids Research · doi:10.1093/nar/gkn892 · Cited by 3,252
Bostock, M., Ogievetsky, V., & Heer, J. (2011) · IEEE Transactions on Visualization and Computer Graphics · doi:10.1109/tvcg.2011.185 · Cited by 3,165
Research works printed but not linked: 1
- Dollo, L. The laws of evolution. Bull. Soc. Bel. Geol. Paleontol. 7, 164–166 (1893).
Cited by
Sorted by citations
Inference and analysis of cell-cell communication using CellChat
Jin, S., Guerrero-Juarez, C. F., Zhang, L., Chang, I., Ramos, R., Kuan, C.-H., Myung, P., Plikus, M. V., & Nie, Q. (2021) · Nature Communications · doi:10.1038/s41467-021-21246-9 · Cited by 8,409
The Immune Landscape of Cancer
Thorsson, V., Gibbs, D. L., Brown, S. D., Wolf, D., Bortone, D. S., Ou Yang, T.-H., Porta-Pardo, E., Gao, G. F., Plaisier, C. L., Eddy, J. A., et al. (2018) · Immunity · doi:10.1016/j.immuni.2018.03.023 · Cited by 5,870
Efremova, M., Vento-Tormo, M., Teichmann, S. A., & Vento-Tormo, R. (2020) · Nature Protocols · doi:10.1038/s41596-020-0292-x · Cited by 3,449
Puram, S. V., Tirosh, I., Parikh, A. S., Patel, A. P., Yizhak, K., Gillespie, S., Rodman, C., Luo, C. L., Mroz, E. A., Emerick, K. S., et al. (2017) · Cell · doi:10.1016/j.cell.2017.10.044 · Cited by 2,557
Regev, A., Teichmann, S. A., Lander, E. S., Amit, I., Benoist, C., Birney, E., Bodenmiller, B., Campbell, P., Carninci, P., Clatworthy, M., et al. (2017) · eLife · doi:10.7554/elife.27041 · Cited by 2,232
Self-citationNicheNet: Modeling intercellular communication by linking ligands to target genes
Browaeys, R., Saelens, W., & Saeys, Y. (2020) · Nature Methods · doi:10.1038/s41592-019-0667-5 · Cited by 2,192
Transcriptome-scale super-resolved imaging in tissues by RNA seqFISH
Eng, C.-H. L., Lawson, M., Zhu, Q., Dries, R., Koulena, N., Takei, Y., Yun, J., Cronin, C., Karp, C., Yuan, G.-C., et al. (2019) · Nature · doi:10.1038/s41586-019-1049-y · Cited by 1,754
A single-cell and spatially resolved atlas of human breast cancers
Wu, S. Z., Al-Eryani, G., Roden, D. L., Junankar, S., Harvey, K., Andersson, A., Thennavan, A., Wang, C., Torpy, J. R., Bartonicek, N., et al. (2021) · Nature Genetics · doi:10.1038/s41588-021-00911-1 · Cited by 1,775
Landscape and Dynamics of Single Immune Cells in Hepatocellular Carcinoma
Zhang, Q., He, Y., Luo, N., Patel, S. J., Han, Y., Gao, R., Modak, M., Carotta, S., Haslinger, C., Kind, D., et al. (2019) · Cell · doi:10.1016/j.cell.2019.10.003 · Cited by 1,624
Fibroblast Heterogeneity and Immunosuppressive Environment in Human Breast Cancer
Costa, A., Kieffer, Y., Scholer-Dahirel, A., Pelon, F., Bourachot, B., Cardon, M., Sirven, P., Magagna, I., Fuhrmann, L., Bernard, C., et al. (2018) · Cancer Cell · doi:10.1016/j.ccell.2018.01.011 · Cited by 1,705
Single-Cell Analyses Inform Mechanisms of Myeloid-Targeted Therapies in Colon Cancer
Zhang, L., Li, Z., Skrzypczynska, K. M., Fang, Q., Zhang, W., O’Brien, S. A., He, Y., Wang, L., Zhang, Q., Kim, A., et al. (2020) · Cell · doi:10.1016/j.cell.2020.03.048 · Cited by 1,620
A Cancer Cell Program Promotes T Cell Exclusion and Resistance to Checkpoint Blockade
Jerby-Arnon, L., Shah, P., Cuoco, M. S., Rodman, C., Su, M.-J., Melms, J. C., Leeson, R., Kanodia, A., Mei, S., Lin, J.-R., et al. (2018) · Cell · doi:10.1016/j.cell.2018.09.006 · Cited by 1,429
Intra- and Inter-cellular Rewiring of the Human Colon during Ulcerative Colitis
Smillie, C. S., Biton, M., Ordovás-Montañés, J., Sullivan, K. M., Burgin, G., Graham, D. B., Herbst, R. H., Rogel, N., Slyper, M., Waldman, J., et al. (2019) · Cell · doi:10.1016/j.cell.2019.06.029 · Cited by 1,417
Regev, A., Teichmann, S. A., Lander, E. S., Amit, I., Benoist, C. O., Birney, E., Bodenmiller, B., & al, E. (2017) · Zurich Open Repository and Archive (University of Zurich) · doi:10.5167/uzh-162597 · Cited by 1,457
Deciphering cell–cell interactions and communication from gene expression
Armingol, E., Officer, A., Harismendy, O., & Lewis, N. E. (2021) · Nature Reviews Genetics · doi:10.1038/s41576-020-00292-x · Cited by 1,267
Multimodal Analysis of Composition and Spatial Architecture in Human Squamous Cell Carcinoma
Ji, A. L., Rubin, A. J., Thrane, K., Jiang, S., Reynolds, D. L., Meyers, R. M., Guo, M. G., George, B. M., Mollbrink, A., Bergenstråhle, J., et al. (2020) · Cell · doi:10.1016/j.cell.2020.05.039 · Cited by 1,117
“Based on a database of ligand-receptor pairs (Ramilowski et al., 2015), TSKs participated in extensive autocrine and paracrine interactions (mostly with CAFs, endothelial cells, macrophages, and MDSCs) (Figures 6B and 6C; STAR Methods).”
BackgroundSingle-cell immune landscape of human atherosclerotic plaques
Fernandez, D. M., Rahman, A. H., Fernandez, N. F., Chudnovskiy, A., Amir, E.-A. D., Amadori, L., Khan, N. S., Wong, C. K., Shamailova, R., Hill, C. A., et al. (2019) · Nature Medicine · doi:10.1038/s41591-019-0590-4 · Cited by 970
Giotto: a toolbox for integrative analysis and visualization of spatial expression data
Dries, R., Zhu, Q., Dong, R., Eng, C.-H. L., Li, H., Liu, K., Fu, Y., Zhao, T., Sarkar, A., Bao, F., et al. (2021) · Genome biology · doi:10.1186/s13059-021-02286-2 · Cited by 966
Lineage-dependent gene expression programs influence the immune landscape of colorectal cancer
Lee, H., Hong, Y., Etlioglu, H. E., Cho, Y. B., Pomella, V., den Bosch, B. V., Vanhecke, J., Verbandt, S., Hong, H.-K., Min, J.-W., et al. (2020) · Nature Genetics · doi:10.1038/s41588-020-0636-z · Cited by 934
Martin, J. P. D., Chang, C., Boschetti, G., Ungaro, R. C., Giri, M., Grout, J. A., Gettler, K., Chuang, L.-S. F., Nayar, S., Greenstein, A. J., et al. (2019) · Cell · doi:10.1016/j.cell.2019.08.008 · Cited by 890
Baccin, C., Al-Sabah, J., Velten, L., Helbling, P. M., Grünschläger, F., Hernández-Malmierca, P., Nombela‐Arrieta, C., Steinmetz, L. M., Trumpp, A., & Haas, S. F. (2019) · Nature Cell Biology · doi:10.1038/s41556-019-0439-6 · Cited by 894
Xiong, X., Kuang, H., Ansari, S., Liu, T., Gong, J., Wang, S., Zhao, X.-Y., Ji, Y., Li, C., Guo, L., et al. (2019) · Molecular Cell · doi:10.1016/j.molcel.2019.07.028 · Cited by 784
Strunz, M., Simon, L. M., Ansari, M., Kathiriya, J. J., Angelidis, I., Mayr, C. H., Tsidiridis, G., Lange, M., Mattner, L. F., Yee, M., et al. (2020) · Nature Communications · doi:10.1038/s41467-020-17358-3 · Cited by 740
Immune Landscape of Viral- and Carcinogen-Driven Head and Neck Cancer
Cillo, A. R., Kürten, C. H. L., Tabib, T., Qi, Z., Onkar, S., Wang, T., Liu, A., Duvvuri, U., Kim, S., Soose, R. J., et al. (2020) · Immunity · doi:10.1016/j.immuni.2019.11.014 · Cited by 677
Dimitrov, D., Türei, D., Garrido-Rodriguez, M., Burmedi, P. L., Nagai, J. S., Boys, C., Ramirez Flores, R. O., Kim, H., Szalai, B., Costa, I. G., et al. (2022) · Nature Communications · doi:10.1038/s41467-022-30755-0 · Cited by 664
Cell profiling of mouse acute kidney injury reveals conserved cellular responses to injury
Kirita, Y., Wu, H., Uchimura, K., Wilson, P. C., & Humphreys, B. D. (2020) · Proceedings of the National Academy of Sciences · doi:10.1073/pnas.2005477117 · Cited by 650
Multilineage communication regulates human liver bud development from pluripotency
Camp, J. G., Sekine, K., Gerber, T., Loeffler-Wirth, H., Binder, H., Gac, M., Kanton, S., Kageyama, J., Damm, G., Seehofer, D., et al. (2017) · Nature · doi:10.1038/nature22796 · Cited by 621
Wu, H., Uchimura, K., Donnelly, E. L., Kirita, Y., Morris, S. A., & Humphreys, B. D. (2018) · Cell stem cell · doi:10.1016/j.stem.2018.10.010 · Cited by 623
Hara, T., Chanoch-Myers, R., Mathewson, N. D., Myskiw, C., Atta, L., Bussema, L., Eichhorn, S. W., Greenwald, A., Kinker, G. S., Rodman, C., et al. (2021) · Cancer Cell · doi:10.1016/j.ccell.2021.05.002 · Cited by 613
Zepp, J. A., Zacharias, W. J., Frank, D. B., Cavanaugh, C. A., Zhou, S., Morley, M. P., & Morrisey, E. E. (2017) · Cell · doi:10.1016/j.cell.2017.07.034 · Cited by 567
T Helper Cell Cytokines Modulate Intestinal Stem Cell Renewal and Differentiation
Biton, M., Haber, A. L., Rogel, N., Burgin, G., Beyaz, S., Schnell, A., Ashenberg, O., Su, C., Smillie, C. S., Shekhar, K., et al. (2018) · Cell · doi:10.1016/j.cell.2018.10.008 · Cited by 597
Hallmarks of transcriptional intratumour heterogeneity across a thousand tumours
Gavish, A., Tyler, M., Greenwald, A. C., Hoefflin, R., Simkin, D., Tschernichovsky, R., Galili Darnell, N., Somech, E., Barbolin, C., Antman, T., et al. (2023) · Nature · doi:10.1038/s41586-023-06130-4 · Cited by 556
The Human and Mouse Enteric Nervous System at Single-Cell Resolution
Drokhlyansky, E., Smillie, C. S., Wittenberghe, N. V., Ericsson, M., Griffin, G. K., Eraslan, G., Dionne, D. A., Cuoco, M. S., Goder-Reiser, M. N., Sharova, T. Y., et al. (2020) · Cell · doi:10.1016/j.cell.2020.08.003 · Cited by 606
Skelly, D. A., Squiers, G. T., McLellan, M. A., Bolisetty, M. T., Robson, P., Rosenthal, N. A., & Pinto, A. R. (2018) · Cell Reports · doi:10.1016/j.celrep.2017.12.072 · Cited by 559
Multimodal mapping of the tumor and peripheral blood immune landscape in human pancreatic cancer
Steele, N. G., Carpenter, E. S., Kemp, S. B., Sirihorachai, V. R., The, S., Delrosario, L., Lazarus, J., Amir, E.-A. D., Gunchick, V., Espinoza, C. E., et al. (2020) · Nature Cancer · doi:10.1038/s43018-020-00121-4 · Cited by 556
Farbehi, N., Patrick, R., Dorison, A., Xaymardan, M., Janbandhu, V. C., Wystub-Lis, K., Ho, J. W. K., Nordon, R. E., & Harvey, R. P. (2019) · eLife · doi:10.7554/elife.43882 · Cited by 570
The single-cell transcriptomic landscape of early human diabetic nephropathy
Wilson, P. C., Wu, H., Kirita, Y., Uchimura, K., Ledru, N., Rennke, H. G., Welling, P. A., Waikar, S. S., & Humphreys, B. D. (2019) · Proceedings of the National Academy of Sciences · doi:10.1073/pnas.1908706116 · Cited by 544
Lu, Y., Yang, A., Quan, C., Pan, Y., Zhang, H., Li, Y., Gao, C., Lu, H. X., Wang, X., Cao, P., et al. (2020) · Nature Communications · doi:10.1038/s41467-022-32283-3 · Cited by 564
Glioma progression is shaped by genetic evolution and microenvironment interactions
Varn, F. S., Johnson, K. C., Martinek, J., Huse, J. T., Nasrallah, M. P., Wesseling, P., Cooper, L., Malta, T. M., Wade, T. E., Sabedot, T. S., et al. (2022) · Cell · doi:10.1016/j.cell.2022.04.038 · Cited by 516
Single-cell analysis of experience-dependent transcriptomic states in the mouse visual cortex
Hrvatin, S., Hochbaum, D. R., Nagy, M. A., Cicconet, M., Robertson, K., Cheadle, L., Zilionis, R., Ratner, A., Borges-Monroy, R., Klein, A. M., et al. (2018) · Nature Neuroscience · doi:10.1038/s41593-017-0029-5 · Cited by 497
An immune-cell signature of bacterial sepsis
Reyes, M., Filbin, M. R., Bhattacharyya, R. P., Billman, K., Eisenhaure, T., Hung, D. T., Levy, B. D., Baron, R. M., Blainey, P. C., Goldberg, M. B., et al. (2020) · Nature Medicine · doi:10.1038/s41591-020-0752-4 · Cited by 505
Stromal cell diversity associated with immune evasion in human triple‐negative breast cancer
Wu, S. Z., Roden, D. L., Wang, C., Holliday, H., Harvey, K., Cazet, A., Murphy, K. J., Pereira, B., Al‐Eryani, G., Bartoniček, N., et al. (2020) · The EMBO Journal · doi:10.15252/embj.2019104063 · Cited by 454
Structural cells are key regulators of organ-specific immune responses
Krausgruber, T., Fortelny, N., Fife-Gernedl, V., Senekowitsch, M., Schuster, L. C., Lercher, A., Nemc, A., Schmidl, C., Rendeiro, A. F., Bergthaler, A., et al. (2020) · Nature · doi:10.1038/s41586-020-2424-4 · Cited by 434
Kumar, M. P., Du, J., Lagoudas, G., Yang, J., Sawyer, A. J., Drummond, D. C., Lauffenburger, D. A., & Raue, A. (2018) · Cell Reports · doi:10.1016/j.celrep.2018.10.047 · Cited by 417
Lung Single-Cell Signaling Interaction Map Reveals Basophil Role in Macrophage Imprinting
Cohen, M., Giladi, A., Gorki, A.-D., Gelbard-Solodkin, D., Zada, M., Hladik, A., Miklosi, A., Salame, T., Halpern, K. B., David, E., et al. (2018) · Cell · doi:10.1016/j.cell.2018.09.009 · Cited by 418
Cell-cell communication: New insights and clinical implications
Su, J., Song, Y., Zhu, Z., Huang, X., Fan, J., Qiao, J., & Mao, F. (2024) · Signal Transduction and Targeted Therapy · doi:10.1038/s41392-024-01888-z · Cited by 433
SingleCellSignalR: inference of intercellular networks from single-cell transcriptomics
Cabello‐Aguilar, S., Alame, M., Kon-Sun-Tack, F., Fau, C., Lacroix, M., & Colinge, J. (2020) · Nucleic Acids Research · doi:10.1093/nar/gkaa183 · Cited by 405
Inferring spatial and signaling relationships between cells from single cell transcriptomic data
Cang, Z., & Nie, Q. H. (2020) · Nature Communications · doi:10.1038/s41467-020-15968-5 · Cited by 400
Integrated intra‐ and intercellular signaling knowledge for multicellular omics analysis
Türei, D., Valdeolivas, A., Gul, L., Palacio‐Escat, N., Klein, M., Ivanova, O., Olbei, M. L., Gábor, A., Theis, F. J., Módos, D., et al. (2021) · Molecular Systems Biology · doi:10.15252/msb.20209923 · Cited by 389
Grout, J. A., Sirven, P., Leader, A. M., Maskey, S., Hector, E., Puisieux, I., Steffan, F., Cheng, E., Tung, N., Maurin, M., et al. (2022) · Cancer Discovery · doi:10.1158/2159-8290.cd-21-1714 · Cited by 391
Leader, A. M., Grout, J. A., Maier, B. B., Nabet, B. Y., Park, M. D., Tabachnikova, A., Chang, C., Walker, L. A., Lansky, A., Bérichel, J. L., et al. (2021) · Cancer Cell · doi:10.1016/j.ccell.2021.10.009 · Cited by 370
Dictionary of immune responses to cytokines at single-cell resolution
Cui, A., Huang, T., Li, S., Ma, A., Pérez, J. L., Sander, C., Keskin, D. B., Wu, C. J., Fraenkel, E., & Hacohen, N. (2023) · Nature · doi:10.1038/s41586-023-06816-9 · Cited by 371
Verma, M., Asakura, Y., Murakonda, B. S. R., Pengo, T., Latroche, C., Chazaud, B., McLoon, L. K., & Asakura, A. (2018) · Cell stem cell · doi:10.1016/j.stem.2018.09.007 · Cited by 355
Atlas of clinically distinct cell states and ecosystems across human solid tumors
Luca, B. A., Steen, C. B., Matusiak, M., Azizi, A., Varma, S., Zhu, C., Przybył, J., Espín-Pérez, A., Diehn, M., Alizadeh, A. A., et al. (2021) · Cell · doi:10.1016/j.cell.2021.09.014 · Cited by 359
Joshi, N., Watanabe, S., Verma, R., Jablonski, R. P., Chen, C.-I., Cheresh, P., Markov, N. S., Reyfman, P. A., McQuattie-Pimentel, A. C., Sichizya, L., et al. (2020) · European Respiratory Journal · doi:10.1183/13993003.00646-2019 · Cited by 344
iTALK: an R Package to Characterize and Illustrate Intercellular CommunicationPreprint
Wang, Y., Wang, R., Zhang, S., Song, S., Jiang, C., Han, G., Wang, M. L., Ajani, J. A., Futreal, A., & Wang, L. (2019) · bioRxiv (Cold Spring Harbor Laboratory) · doi:10.1101/507871 · Cited by 323
The Molecular Anatomy of Mouse Skin during Hair Growth and Rest
Joost, S., Annusver, K., Jacob, T., Sun, X., Dalessandri, T., Sivan, U., Sequeira, I., Sandberg, R., & Kasper, M. (2020) · Cell stem cell · doi:10.1016/j.stem.2020.01.012 · Cited by 333
Spatial components of molecular tissue biology
Palla, G., Fischer, D. S., Regev, A., & Theis, F. J. (2022) · Nature Biotechnology · doi:10.1038/s41587-021-01182-1 · Cited by 318
Becker, W. R., Nevins, S. A., Chen, D. C., Chiu, R., Horning, A. M., Guha, T. K., Laquindanum, R., Mills, M. A., Chaı̈b, H., Ladabaum, U., et al. (2022) · Nature Genetics · doi:10.1038/s41588-022-01088-x · Cited by 333
Somatic inflammatory gene mutations in human ulcerative colitis epithelium
Nanki, K., Fujii, M., Shimokawa, M., Matano, M., Nishikori, S., Date, S., Takano, A., Toshimitsu, K., Ohta, Y., Takahashi, S., et al. (2019) · Nature · doi:10.1038/s41586-019-1844-5 · Cited by 333
Ho, D. W., Tsui, Y., Chan, L., Sze, K. M., Zhang, X., Cheu, J. W., Chiu, Y., Lee, J. M., Chan, A. C. Y., Cheung, E. T.-Y., et al. (2021) · Nature Communications · doi:10.1038/s41467-021-24010-1 · Cited by 324
Organization of the human intestine at single-cell resolution
Hickey, J. W., Becker, W. R., Nevins, S. A., Horning, A. M., Espín-Pérez, A., Zhu, C., Zhu, B., Wei, B., Chiu, R., Chen, D. C., et al. (2023) · Nature · doi:10.1038/s41586-023-05915-x · Cited by 330
Single-cell RNA sequencing in cardiovascular development, disease and medicine
Paik, D. T., Cho, S., Tian, L., Chang, H. Y., & Wu, J. C. (2020) · Nature Reviews Cardiology · doi:10.1038/s41569-020-0359-y · Cited by 314
CellTalkDB: a manually curated database of ligand–receptor interactions in humans and mice
Shao, X., Liao, J., Li, C., Lu, X., Cheng, J., & Fan, X. (2020) · Briefings in Bioinformatics · doi:10.1093/bib/bbaa269 · Cited by 296
Single-cell analysis of the cellular heterogeneity and interactions in the injured mouse spinal cord
Milich, L. M., Choi, J. S., Ryan, C. B., Cerqueira, S. R., Benavides, S., Yahn, S. L., Tsoulfas, P., & Lee, J. K. (2021) · The Journal of Experimental Medicine · doi:10.1084/jem.20210040 · Cited by 289
Temporal Dynamics and Heterogeneity of Cell Populations during Skeletal Muscle Regeneration
Oprescu, S. N., Yue, F., Qiu, J., Brito, L. F., & Kuang, S. (2020) · iScience · doi:10.1016/j.isci.2020.100993 · Cited by 298
McLellan, M. A., Skelly, D. A., Dona, M. S. I., Squiers, G. T., Farrugia, G. E., Gaynor, T. L., Cohen, C. D., Pandey, R., Diep, H., Vinh, A., et al. (2020) · Circulation · doi:10.1161/circulationaha.119.045115 · Cited by 289
Regenerative potential of prostate luminal cells revealed by single-cell analysis
Karthaus, W. R., Hofree, M., Choi, D., Linton, E. L., Turkekul, M., Bejnood, A., Carver, B., Gopalan, A., Abida, W. M., Laudone, V. P., et al. (2020) · Science · doi:10.1126/science.aay0267 · Cited by 285
Predicting cell-to-cell communication networks using NATMI
Hou, R., Denisenko, E., Ong, H. T., Ramilowski, J. A., & Forrest, A. R. R. (2020) · Nature Communications · doi:10.1038/s41467-020-18873-z · Cited by 285
Self-citationPaik, D. T., Tian, L., Williams, I. M., Rhee, S., Zhang, H., Liu, C., Mishra, R., Wu, S. M., Red‐Horse, K., & Wu, J. C. (2020) · Circulation · doi:10.1161/circulationaha.119.041433 · Cited by 291
Shami, A. N., Zheng, X., Munyoki, S. K., Ma, Q., Manske, G. L., Green, C. D., Sukhwani, M., Orwig, K. E., Li, J. Z., & Hammoud, S. S. (2020) · Developmental Cell · doi:10.1016/j.devcel.2020.05.010 · Cited by 283
Self-renewing endometrial epithelial organoids of the human uterus
Fitzgerald, H. C., Dhakal, P., Behura, S. K., Schust, D. J., & Spencer, T. E. (2019) · Proceedings of the National Academy of Sciences · doi:10.1073/pnas.1915389116 · Cited by 253
Korsunsky, I., Wei, K., Pohin, M., Kim, E. Y., Barone, F., Major, T., Taylor, E., Ravindran, R. P., Kemble, S., Watts, G. F. M., et al. (2022) · Med · doi:10.1016/j.medj.2022.05.002 · Cited by 249
Zhang, Y., Liu, T., Hu, X., Wang, M., Wang, J., Zou, B., Tan, P., Cui, T., Dou, Y., Lin, N., et al. (2021) · Nucleic Acids Research · doi:10.1093/nar/gkab638 · Cited by 254
Ren, Z., Peng, Y., Li, D., Li, Z., Liao, Y., Wang, Y., Zhou, B., & Wang, L. (2020) · Circulation · doi:10.1161/circulationaha.119.043053 · Cited by 247
Jin, S., Li, R., Chen, M., Chao, Y., Tang, L., Liu, Y.-M., Li, J.-P., Liu, Y.-N., Luo, Y., Zhao, Y., et al. (2020) · Cell Research · doi:10.1038/s41422-020-00402-8 · Cited by 244
Brain Endothelial Cells Are Exquisite Sensors of Age-Related Circulatory Cues
Chen, M. B., Yang, A. C., Yousef, H., Lee, D., Chen, W., Schaum, N., Lehallier, B., Quake, S. R., & Wyss-Coray, T. (2020) · Cell Reports · doi:10.1016/j.celrep.2020.03.012 · Cited by 233
“We then matched the resulting 15 BEC external membrane proteins with putative plasma ligands using a published database of receptor-ligand pairs (Ramilowski et al., 2015), highlighting the ligands we detected in mouse plasma.”
A Review of Single-Cell RNA-Seq Annotation, Integration, and Cell–Cell Communication
Cheng, C., Chen, W., Jin, H., & Chen, X. '. (2023) · Cells · doi:10.3390/cells12151970 · Cited by 253
Wang, C., Yu, Q., Song, T., Wang, Z., Song, L., Yang, Y., Shao, J., Li, J., Ni, Y., Chao, N., et al. (2022) · Signal Transduction and Targeted Therapy · doi:10.1038/s41392-022-01130-8 · Cited by 255
Artificial Intelligence for Drug Discovery: Are We There Yet?
Hasselgren, C., & Oprea, T. I. (2024) · Annual Review of Pharmacology and Toxicology · doi:10.1146/annurev-pharmtox-040323-040828 · Cited by 236
“is increasing (71), a systematic experimental method for identifying ATG-related genes has yet to be established (72).”
MethodLymph nodes are innervated by a unique population of sensory neurons with immunomodulatory potential
Huang, S., Ziegler, C. G. K., Austin, J., Mannoun, N., Vukovic, M., Ordovás-Montañés, J., Shalek, A. K., & von Andrian, U. H. (2020) · Cell · doi:10.1016/j.cell.2020.11.028 · Cited by 234
Single-cell connectomic analysis of adult mammalian lungs
Raredon, M. S. B., Adams, T. S., Suhail, Y., Schupp, J. C., Poli, S., Neumark, N., Leiby, K. L., Greaney, A. M., Yuan, Y., Horien, C. L., et al. (2019) · Science Advances · doi:10.1126/sciadv.aaw3851 · Cited by 221
The spatiotemporal program of zonal liver regeneration following acute injury
Ben-Moshe, S., Veg, T., Manco, R., Dan, S., Papinutti, D., Lifshitz, A., Kolodziejczyk, A. A., Bahar Halpern, K., Elinav, E., & Itzkovitz, S. (2022) · Cell Stem Cell · doi:10.1016/j.stem.2022.04.008 · Cited by 224
Single cell transcriptomics of human epidermis identifies basal stem cell transition states
Wang, S., Drummond, M. L., Guerrero-Juarez, C. F., Tarapore, E., MacLean, A. L., Stabell, A. R., Wu, S. C., Gutierrez, G., That, B. T., Benavente, C. A., et al. (2020) · Nature Communications · doi:10.1038/s41467-020-18075-7 · Cited by 218
Camell, C. D., Günther, P. S., Lee, A., Goldberg, E. L., Spadaro, O., Youm, Y., Bartke, A., Hubbard, G. B., Ikeno, Y., Ruddle, N. H., et al. (2019) · Cell Metabolism · doi:10.1016/j.cmet.2019.10.006 · Cited by 216
Micheli, A. J. D., Spector, J. A., Elemento, O., & Cosgrove, B. D. (2020) · Skeletal Muscle · doi:10.1186/s13395-020-00236-3 · Cited by 218
CXCR6 orchestrates brain CD8+ T cell residency and limits mouse Alzheimer’s disease pathology
Su, W., Saravia, J., Risch, I., Rankin, S. L., Guy, C. S., Chapman, N. M., Shi, H., Sun, Y., Anil, K. C., Li, W., et al. (2023) · Nature Immunology · doi:10.1038/s41590-023-01604-z · Cited by 222
Dissection of intercellular communication using the transcriptome-based framework ICELLNET
Noël, F., Massenet-Regad, L., Carmi-Levy, I., Cappuccio, A., Grandclaudon, M., Trichot, C., Kieffer, Y., Mechta‐Grigoriou, F., & Soumelis, V. (2021) · Nature Communications · doi:10.1038/s41467-021-21244-x · Cited by 217
Xing, X., Yang, F., Huang, Q., Guo, H., Li, J., Qiu, M., Bai, F., & Wang, J. (2021) · Science Advances · doi:10.1126/sciadv.abd9738 · Cited by 204
Wang, X., Tokheim, C. J., Gu, S. S., Wang, B., Tang, Q., Li, Y., Traugh, N. C., Zeng, Z., Zhang, Y., Li, Z., et al. (2021) · Cell · doi:10.1016/j.cell.2021.09.006 · Cited by 208
Joost, S., Jacob, T., Sun, X., Annusver, K., Manno, G. L., Sur, I., & Kasper, M. (2018) · Cell Reports · doi:10.1016/j.celrep.2018.09.059 · Cited by 189
GCNG: graph convolutional networks for inferring gene interaction from spatial transcriptomics data
Yuan, Y., & Bar-Joseph, Z. (2020) · Genome Biology · doi:10.1186/s13059-020-02214-w · Cited by 194
Rare variant associations with plasma protein levels in the UK Biobank
Dhindsa, R. S., Burren, O. S., Sun, B. B., Prins, B. P., Matelska, D., Wheeler, E., Mitchell, J., Oerton, E., Hristova, V. A., Smith, K. R., et al. (2023) · Nature · doi:10.1038/s41586-023-06547-x · Cited by 193
Communication in the Cancer Microenvironment as a Target for Therapeutic Interventions
Dominiak, A., Chełstowska, B., Olejarz, W., & Nowicka, G. (2020) · Cancers · doi:10.3390/cancers12051232 · Cited by 201
Single-cell transcriptomics in cancer: computational challenges and opportunities
Fan, J., Slowikowski, K., & Zhang, F. (2020) · Experimental & Molecular Medicine · doi:10.1038/s12276-020-0422-0 · Cited by 195
Kelleher, A. M., Milano-Foster, J., Behura, S. K., & Spencer, T. E. (2018) · Nature Communications · doi:10.1038/s41467-018-04848-8 · Cited by 194
Statistical and machine learning methods for spatially resolved transcriptomics data analysis
Zeng, Z., Li, Y., Li, Y., & Luo, Y. (2022) · Genome Biology · doi:10.1186/s13059-022-02653-7 · Cited by 186
Lee, H. W., Chung, W., Lee, H., Jeong, D. E., Jo, A., Lim, J. E., Hong, J. H., Nam, D., Jeong, B. C., Park, S. H., et al. (2020) · Genome Medicine · doi:10.1186/s13073-020-00741-6 · Cited by 192
Genomic, epigenomic, and biophysical cues controlling the emergence of the lung alveolus
Zepp, J. A., Morley, M. P., Loebel, C., Kremp, M. M., Chaudhry, F. N., Basil, M. C., Leach, J. P., Liberti, D. C., Niethamer, T. K., Ying, Y., et al. (2021) · Science · doi:10.1126/science.abc3172 · Cited by 184
Metadata
- Authors
- Ramilowski, J. A., Goldberg, T., Harshbarger, J., Kloppmann, E., Lizio, M., Satagopam, V. P., Itoh, M., Kawaji, H., Carninci, P., Rost, B., & Forrest, A. R. R.
- Affiliations
- RIKEN (JP)
- Technical University of Munich (DE)
- Luxembourg Centre for Systems Biomedicine (LU)
- The University of Western Australia (AU)
- Corresponding author
- Ramilowski, Jordan A.
- Forrest, Alistair R. R.
- ORCID
- Venue
- Nature Communications
- Published
- 2015-07-22
- Volume
- 6
- Issue
- 1
- Pages
- 7866-7866
- ISSN
- 2041-1723 (ISSN-L)
- PMC
- PMC4525178
- OpenAlex
- W1016059894
- Cited by
- 887
- References
- 62
- Citations by year
- 2026: 58 · 2025: 92 · 2024: 78 · 2023: 120 · 2022: 132 · 2021: 154 · 2020: 122 · 2019: 67 · 2018: 37 · 2017: 20 · 2016: 3 · 2015: 1
- FWCI
- 8.83
- Type
- journal article
- Language
- en
- Update notices
- correction (2016-02-10)
- Open access
- gold
- doi.org
- Locations
- Nature Communications (publishedVersion, cc-by)
- Europe PMC (PubMed Central) (publishedVersion, cc-by)
- PubMed Central (publishedVersion, cc-by)
- UWA Profiles and Research Repository (UWA) (publishedVersion, other-oa)
- PubMed (publishedVersion)
- Open Repository and Bibliography (University of Luxembourg) (submittedVersion, cc-by-nc-sa)
- RePEc: Research Papers in Economics (submittedVersion)
- Funders
- Conquer Cancer Foundation
- Alexander von Humboldt-Stiftung
- Ministry of Education, Culture, Sports, Science and Technology
- National Institutes of Health (GM095315)
- RIKEN
- National Institute of General Medical Sciences (U54GM095315)
- Topics
- Life Sciences › Biochemistry, Genetics and Molecular Biology › Molecular Biology › Bioinformatics and Genomic Networks
- Life Sciences › Biochemistry, Genetics and Molecular Biology › Molecular Biology › Gene Regulatory Network Analysis
- Life Sciences › Biochemistry, Genetics and Molecular Biology › Molecular Biology › Receptor Mechanisms and Signaling
- Keywords
- cell-to-cell communication, ligand-receptor interactions, autocrine signaling, secreted proteins, plasma membrane proteins, protein evolution, mast cells, network visualization tools
- MeSH terms
- Animals, Cell Communication, Humans, Ligands, Receptors, Cell Surface, Software, Evolution, Molecular
About these checks
Registry, retraction, Cites and statistics results are computed, not judged, with one exception: a printed reference that no index lists is read once by a model before it counts as a citation error. Claims are extracted by a model and kept only when their quote appears verbatim in the text; each cited source is then checked, with a model’s help, for whether it says what the claim relies on. Those verdicts can be wrong — read the claim’s quote and the cited source before relying on one.
Statistics and arithmetic are recomputed, not judged.
Confidence bands are shown only for fields calibrated on our annotated test set. None is calibrated yet, so no band is shown.
What counts as a claim ›How we measure confidence ›How we check this ›
Are you an author, or do you see a problem with this page? Request a review
