Cited by 118Neuroinflammation and Neurodegeneration MechanismsPharmacological Receptor Mechanisms and EffectsNeuroscience and Neuropharmacology Research

The DOI matches its Crossref record; 63 of the 65 references it cites were found in a registry or an index.

Neuronal activity increases translocator protein (TSPO) levels

Open access

Abstract

The mitochondrial protein, translocator protein (TSPO), is a widely used biomarker of neuroinflammation, but its non-selective cellular expression pattern implies roles beyond inflammatory processes. In the present study, we investigated whether neuronal activity modifies TSPO levels in the adult central nervous system. First, we used single-cell RNA sequencing to generate a cellular landscape of basal TSPO gene expression in the hippocampus of adult (12 weeks old) C57BL6/N mice, followed by confocal laser scanning microscopy to verify TSPO protein in neuronal and non-neuronal cell populations. We then quantified TSPO mRNA and protein levels after stimulating neuronal activity with distinct stimuli, including designer receptors exclusively activated by designer drugs (DREADDs), exposure to a novel environment and acute treatment with the psychostimulant drug, amphetamine. Single-cell RNA sequencing demonstrated a non-selective and multi-cellular gene expression pattern of TSPO at basal conditions in the adult mouse hippocampus. Confocal laser scanning microscopy confirmed that TSPO protein is present in neuronal and non-neuronal (astrocytes, microglia, vascular endothelial cells) cells of cortical (medial prefrontal cortex) and subcortical (hippocampus) brain regions. Stimulating neuronal activity through chemogenetic (DREADDs), physiological (novel environment exposure) or psychopharmacological (amphetamine treatment) approaches led to consistent increases in TSPO gene and protein levels in neurons, but not in microglia or astrocytes. Taken together, our findings show that neuronal activity has the potential to modify TSPO levels in the adult central nervous system. These findings challenge the general assumption that altered TSPO expression or binding unequivocally mirrors ongoing neuroinflammation and emphasize the need to consider non-inflammatory interpretations in some physiological or pathological contexts.

Overview

The claims and statistics of this paper haven’t been checked yet.

Run the check — free, no account needed. It reads the open-access text and checks the sources it cites.

A few free checks a day · papers already verified open instantly · results are public

Integrity signals

Registry

Crossref · 10.1038/s41380-020-0745-1

Cites

63 of 63 references verified0 citation errors · 0 not checkable

Statistics

Figures

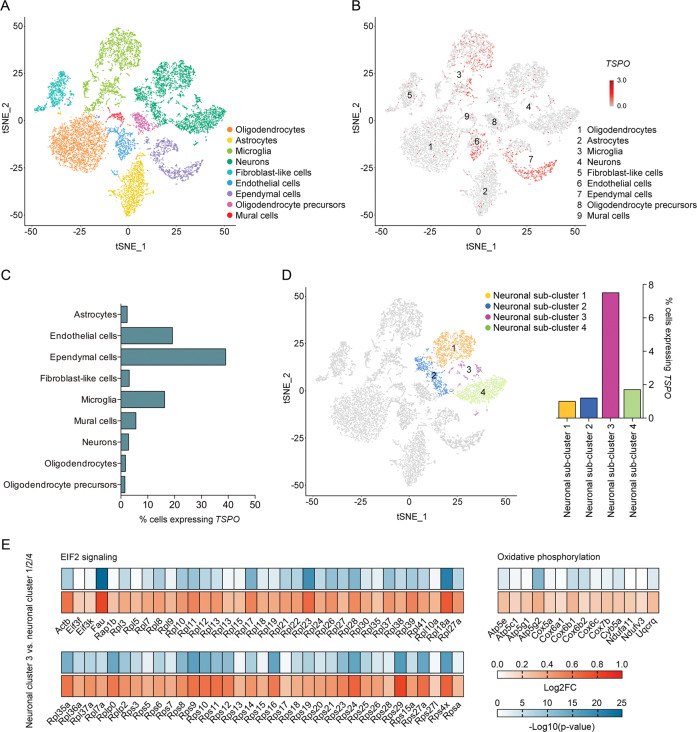
Fig. 1 Cellular landscape of basal TSPO expression in the hippocampus of adult mice. a Visualization of single-cell RNA-sequencing (scRNA-seq) data using t-distributed stochastic neighbor embedding (tSNE), showing the clustering of 9 main cell populations. Cellular sub-clusters are provided in Fig. S3 (Supplementary Information). Corresponding uniform manifold approximation and projection (UMAP) scores are shown in Figure S2 (Supplementary Information). b TSPO expression (in red) in individual clusters of cells as detected by scRNA-seq. c Percentage of cells expressing TSPO in each of the 9 main cell populations, as measured by scRNA-seq. d tSNE scores of neuronal sub-clusters (neuronal clusters 1–4) and percentage of cells expressing TSPO in each of the 4 neuronal sub-clusters. e Differential gene expression (indexed as average log2 fold change, Log2FC) between neuronal cluster 3 and neuronal cluster 1/2/4, showing differentially expressed genes included in the eukaryotic initiation factor 2 (EIF2) signaling pathway and oxidative phosphorylation as identified by Ingenuity Pathway Analysis (IPA). The significance of differential gene expression is given as –Log10(p-value).
Fig. 1 Cellular landscape of basal TSPO expression in the hippocampus of adult mice. a Visualization of single-cell RNA-sequencing (scRNA-seq) data using t-distributed stochastic neighbor embedding (tSNE), showing the clustering of 9 main cell populations. Cellular sub-clusters are provided in Fig. S3 (Supplementary Information). Corresponding uniform manifold approximation and projection (UMAP) scores are shown in Figure S2 (Supplementary Information). b TSPO expression (in red) in individual clusters of cells as detected by scRNA-seq. c Percentage of cells expressing TSPO in each of the 9 main cell populations, as measured by scRNA-seq. d tSNE scores of neuronal sub-clusters (neuronal clusters 1–4) and percentage of cells expressing TSPO in each of the 4 neuronal sub-clusters. e Differential gene expression (indexed as average log2 fold change, Log2FC) between neuronal cluster 3 and neuronal cluster 1/2/4, showing differentially expressed genes included in the eukaryotic initiation factor 2 (EIF2) signaling pathway and oxidative phosphorylation as identified by Ingenuity Pathway Analysis (IPA). The significance of differential gene expression is given as –Log10(p-value).CC BY · PubMed Central
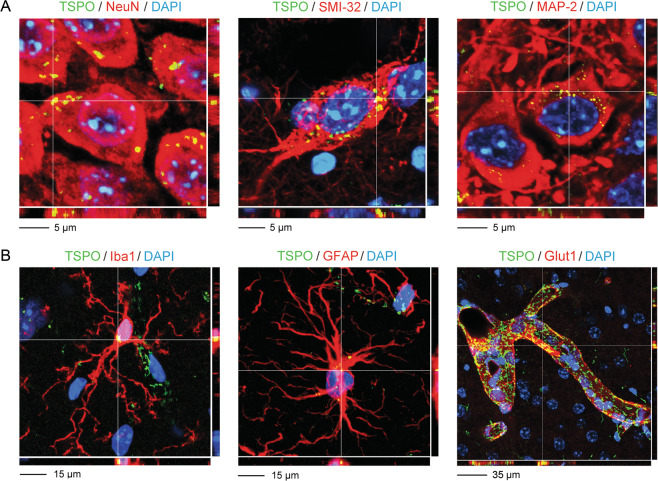
Fig. 2 Immunohistochemical localization of TSPO protein in neuronal and non-neuronal hippocampal cells of adult mice using immunofluorescence staining analyzed by confocal laser scanning microscopy. The photomicrographs show representative Z-stack images acquired through confocal microscopy, with nuclear staining (DAPI) in blue, TSPO in green and various CNS cells of interest in red. TSPO co-localizing with the cellular markers of interest appears in yellow. Examples of co-localization areas are highlighted by the crosshair. a Examples of neuronal TSPO protein expression, as evaluated using the post-mitotic neuronal markers NeuN, SMI-32 and MAP-2. b Examples of non-neuronal TSPO protein expression, including expression in Iba1-positive microglia, GFAP-positive astrocytes and Glut1-positive vascular endothelial cells.
Fig. 2 Immunohistochemical localization of TSPO protein in neuronal and non-neuronal hippocampal cells of adult mice using immunofluorescence staining analyzed by confocal laser scanning microscopy. The photomicrographs show representative Z-stack images acquired through confocal microscopy, with nuclear staining (DAPI) in blue, TSPO in green and various CNS cells of interest in red. TSPO co-localizing with the cellular markers of interest appears in yellow. Examples of co-localization areas are highlighted by the crosshair. a Examples of neuronal TSPO protein expression, as evaluated using the post-mitotic neuronal markers NeuN, SMI-32 and MAP-2. b Examples of non-neuronal TSPO protein expression, including expression in Iba1-positive microglia, GFAP-positive astrocytes and Glut1-positive vascular endothelial cells.CC BY · PubMed Central
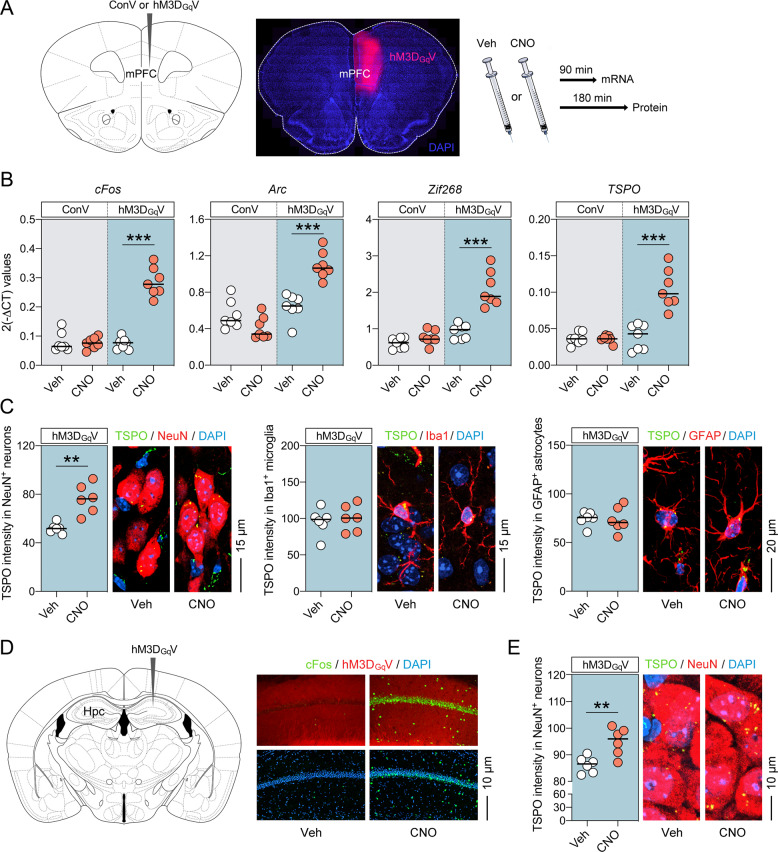
Fig. 3 Increased TSPO levels following selective neuronal activation using the DREADD system in adult mice. a Schematic illustration and verification of the experimental approach. Mice were subjected to unilateral stereotactic injections of recombinant AAV expressing the modified human muscarinic M3 G-protein-coupled receptor under the control of the human synapsin-1 promoter (hM3DGqV), or recombinant control AAV expressing a reporter gene under the same synapsin-1 promoter (ConV), into the medial prefrontal cortex (mPFC). Gene expression was assessed 90 min after vehicle (Veh) or clozapine-N-oxide (CNO, 1 mg/kg, i.p.) treatment, whereas protein expression was assessed 180 min post-treatment. The photomicrograph shows representative hM3DGqV expression in the injected mPFC hemisphere. b mRNA levels of cFos, Arc, Zif268 and TSPO (as measured by quantitative polymerase chain reaction) in the mPFC of ConV- or hM3DGqV-injected mice 90 min after treatment with Veh or CNO. c Intensity (relative optical density) of TSPO protein co-localizing with NeuN-positive neurons (left), Iba1-positive microglia (middle) and GFAP-positive astrocytes in the mPFC of hM3DGqV-injected mice 180 min after treatment with Veh or CNO (1 mg/kg, i.p.). The photomicrographs show representative images acquired through confocal microscopy, with nuclear staining (DAPI) in blue, TSPO in green and cell types of interest (neurons, microglia and astrocytes) in red. TSPO co-localizing with the cellular markers of interest appears in yellow. d Schematic illustration and immunohistochemical verification of unilateral, stereotactic injections of recombinant AAV expressing hM3DGqV into the hippocampus (Hpc). The photomicrographs show representative confocal images of hM3DGqV-injected mice at the level of the CA1 region of the Hpc, 180 min after treatment with Veh or CNO. Note the induction of cFos protein levels (in green) in CNO-treated relative to Veh-treated mice. e Intensity (relative optical density) of TSPO protein co-localizing with NeuN-positive neurons in the Hpc of hM3DGqV-injected mice 3 h after treatment with Veh or CNO (1 mg/kg, i.p.). The photomicrographs show representative images acquired through confocal microscopy, with nuclear staining (DAPI) in blue, TSPO in green and NeuN in red. TSPO co-localizing with the cellular markers of interest appears in yellow. For all data, **P < 0.01 and ***P < 0.001; each dot in the scatter plot represents an individual animal.
Fig. 3 Increased TSPO levels following selective neuronal activation using the DREADD system in adult mice. a Schematic illustration and verification of the experimental approach. Mice were subjected to unilateral stereotactic injections of recombinant AAV expressing the modified human muscarinic M3 G-protein-coupled receptor under the control of the human synapsin-1 promoter (hM3DGqV), or recombinant control AAV expressing a reporter gene under the same synapsin-1 promoter (ConV), into the medial prefrontal cortex (mPFC). Gene expression was assessed 90 min after vehicle (Veh) or clozapine-N-oxide (CNO, 1 mg/kg, i.p.) treatment, whereas protein expression was assessed 180 min post-treatment. The photomicrograph shows representative hM3DGqV expression in the injected mPFC hemisphere. b mRNA levels of cFos, Arc, Zif268 and TSPO (as measured by quantitative polymerase chain reaction) in the mPFC of ConV- or hM3DGqV-injected mice 90 min after treatment with Veh or CNO. c Intensity (relative optical density) of TSPO protein co-localizing with NeuN-positive neurons (left), Iba1-positive microglia (middle) and GFAP-positive astrocytes in the mPFC of hM3DGqV-injected mice 180 min after treatment with Veh or CNO (1 mg/kg, i.p.). The photomicrographs show representative images acquired through confocal microscopy, with nuclear staining (DAPI) in blue, TSPO in green and cell types of interest (neurons, microglia and astrocytes) in red. TSPO co-localizing with the cellular markers of interest appears in yellow. d Schematic illustration and immunohistochemical verification of unilateral, stereotactic injections of recombinant AAV expressing hM3DGqV into the hippocampus (Hpc). The photomicrographs show representative confocal images of hM3DGqV-injected mice at the level of the CA1 region of the Hpc, 180 min after treatment with Veh or CNO. Note the induction of cFos protein levels (in green) in CNO-treated relative to Veh-treated mice. e Intensity (relative optical density) of TSPO protein co-localizing with NeuN-positive neurons in the Hpc of hM3DGqV-injected mice 3 h after treatment with Veh or CNO (1 mg/kg, i.p.). The photomicrographs show representative images acquired through confocal microscopy, with nuclear staining (DAPI) in blue, TSPO in green and NeuN in red. TSPO co-localizing with the cellular markers of interest appears in yellow. For all data, **P < 0.01 and ***P < 0.001; each dot in the scatter plot represents an individual animal.CC BY · PubMed Central
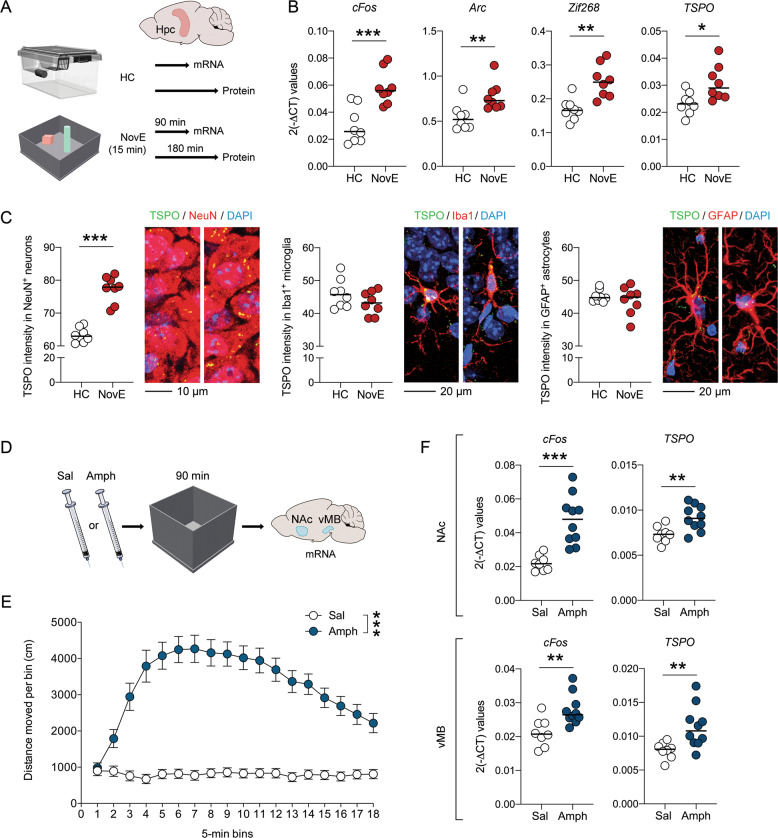
Fig. 4 Increased TSPO levels following neuronal activation under physiological and psychopharmacological conditions in adult mice. a Schematic illustration of the experimental design used to assess TSPO levels after neuronal activation under physiological conditions. Mice were exposed to a novel environment (NovE) for 15 min. Gene expression was then assessed 90 min after NovE exposure, whereas protein expression was assessed 180 min post-exposure. Control mice were kept in their familiar home cage (HC) environment. b mRNA levels of cFos, Arc, Zif268 and TSPO (as measured by quantitative polymerase chain reaction) in the hippocampus 90 min after NovE exposure, relative to mice kept in the HC environment. c Intensity (relative optical density) of TSPO protein co-localizing with NeuN-positive neurons (left), Iba1-positive microglia (middle) and GFAP-positive astrocytes in the Hpc 180 min after NovE exposure, relative to mice kept in the HC. The photomicrographs show representative images acquired through confocal microscopy, with nuclear staining (DAPI) in blue, TSPO in green and cell types of interest (neurons, microglia and astrocytes) in red. TSPO co-localizing with the cellular markers of interest appears in yellow. d Schematic illustration of the experimental design used to assess TSPO expression after neuronal activation under psychopharmacological conditions. Mice were injected with saline (Sal) or amphetamine (Amph, 2.5 mg/kg, i.p.) and then placed into an open field to verify Amph-induced hyperlocomotion. Gene expression was evaluated in the nucleus accumbens (NAc) and ventral midbrain (vMB) 90 min after Sal or Amph administration. e Distances moved after Sal or Amph administration as a function of 5-min bins. ***P < 0.001, based on repeated-measures ANOVA. f mRNA levels of cFos and TSPO (as measured by quantitative polymerase chain reaction) in the NAc and vMB 90 min after administration of Sal or Amph. *P < 0.05, **P < 0.01 and ***P < 0.001, based on two-tailed Student’s t-test; each dot in the scatter plot represents an individual animal.
Fig. 4 Increased TSPO levels following neuronal activation under physiological and psychopharmacological conditions in adult mice. a Schematic illustration of the experimental design used to assess TSPO levels after neuronal activation under physiological conditions. Mice were exposed to a novel environment (NovE) for 15 min. Gene expression was then assessed 90 min after NovE exposure, whereas protein expression was assessed 180 min post-exposure. Control mice were kept in their familiar home cage (HC) environment. b mRNA levels of cFos, Arc, Zif268 and TSPO (as measured by quantitative polymerase chain reaction) in the hippocampus 90 min after NovE exposure, relative to mice kept in the HC environment. c Intensity (relative optical density) of TSPO protein co-localizing with NeuN-positive neurons (left), Iba1-positive microglia (middle) and GFAP-positive astrocytes in the Hpc 180 min after NovE exposure, relative to mice kept in the HC. The photomicrographs show representative images acquired through confocal microscopy, with nuclear staining (DAPI) in blue, TSPO in green and cell types of interest (neurons, microglia and astrocytes) in red. TSPO co-localizing with the cellular markers of interest appears in yellow. d Schematic illustration of the experimental design used to assess TSPO expression after neuronal activation under psychopharmacological conditions. Mice were injected with saline (Sal) or amphetamine (Amph, 2.5 mg/kg, i.p.) and then placed into an open field to verify Amph-induced hyperlocomotion. Gene expression was evaluated in the nucleus accumbens (NAc) and ventral midbrain (vMB) 90 min after Sal or Amph administration. e Distances moved after Sal or Amph administration as a function of 5-min bins. ***P < 0.001, based on repeated-measures ANOVA. f mRNA levels of cFos and TSPO (as measured by quantitative polymerase chain reaction) in the NAc and vMB 90 min after administration of Sal or Amph. *P < 0.05, **P < 0.01 and ***P < 0.001, based on two-tailed Student’s t-test; each dot in the scatter plot represents an individual animal.CC BY · PubMed Central

Verification

Claims the paper makes

The claims and statistics of this paper haven’t been checked yet.

Run the check — free, no account needed. It reads the open-access text and checks the sources it cites.

A few free checks a day · papers already verified open instantly · results are public

Claims other papers make about this one

Each is checked against this paper’s own text: does it say what the citing paper says it does?

Self-check

Percentages, sums and reported differences re-computed from the paper’s own numbers.

The self-check needs the paper’s full text.

Citations

Cites

Show all 65 references

Cited by

Sorted by citations

See all 118

Metadata

Authors
Notter, T., Schalbetter, S. M., Clifton, N. E., Mattei, D., Richetto, J., Thomas, K., Meyer, U., & Hall, J.
Affiliations
  • Cardiff University (GB)
  • University of Zurich (CH)
Corresponding author
Notter, Tina
Venue
Molecular Psychiatry
Published
2020-05-12
Volume
26
Issue
6
Pages
2025-2037
ISSN
  • 1359-4184 (ISSN-L)
  • 1476-5578
OpenAlex
W3016299128
Cited by
118
References
65
Citations by year
2026: 9 · 2025: 13 · 2024: 24 · 2023: 20 · 2022: 20 · 2021: 24 · 2020: 8
FWCI
6.97
Type
journal article
Language
en
Open access
Locations
  • Molecular Psychiatry (publishedVersion, cc-by)
  • Europe PMC (PubMed Central) (publishedVersion, other-oa)
  • PubMed Central (publishedVersion, cc-by)
  • PubMed (publishedVersion)
  • ORCA Online Research @Cardiff (Cardiff University) (acceptedVersion)
  • Zurich Open Repository and Archive (University of Zurich) (acceptedVersion, cc-by)
  • Zurich Open Repository and Archive (University of Zurich) (submittedVersion, cc-by)
  • Zurich Open Repository and Archive (University of Zurich)
Funders
  • National Science Foundation
  • Schweizerischer Nationalfonds zur Förderung der Wissenschaftlichen Forschung (PZ00P3_18009/1, 188524, 174868, 310030)
  • Universität Zürich
  • Medical Research Council (MR/L010305/1)
Topics
  • Life Sciences › Neuroscience › Neurology › Neuroinflammation and Neurodegeneration Mechanisms
  • Life Sciences › Pharmacology, Toxicology and Pharmaceutics › Pharmacology › Pharmacological Receptor Mechanisms and Effects
  • Life Sciences › Neuroscience › Cellular and Molecular Neuroscience › Neuroscience and Neuropharmacology Research
Keywords
translocator protein (TSPO), neuronal activity, neuroinflammation biomarkers, hippocampus, medial prefrontal cortex, amphetamine, astrocytes, microglia, vascular endothelial cells, single-cell RNA sequencing
MeSH terms
Animals, Neurons, Microglia, Receptors, GABA, Endothelial Cells, Positron-Emission Tomography, Mice

About these checks

Registry, retraction, Cites and statistics results are computed, not judged, with one exception: a printed reference that no index lists is read once by a model before it counts as a citation error. Claims are extracted by a model and kept only when their quote appears verbatim in the text; each cited source is then checked, with a model’s help, for whether it says what the claim relies on. Those verdicts can be wrong — read the claim’s quote and the cited source before relying on one.

Statistics and arithmetic are recomputed, not judged.

Confidence bands are shown only for fields calibrated on our annotated test set. None is calibrated yet, so no band is shown.

What counts as a claim ›How we measure confidence ›How we check this ›

Are you an author, or do you see a problem with this page? Request a review