

The DOI matches its Crossref record; 74 of the 74 references it cites were found in a registry or an index.
Nucleolar expansion and elevated protein translation in premature aging
Open accessAbstract
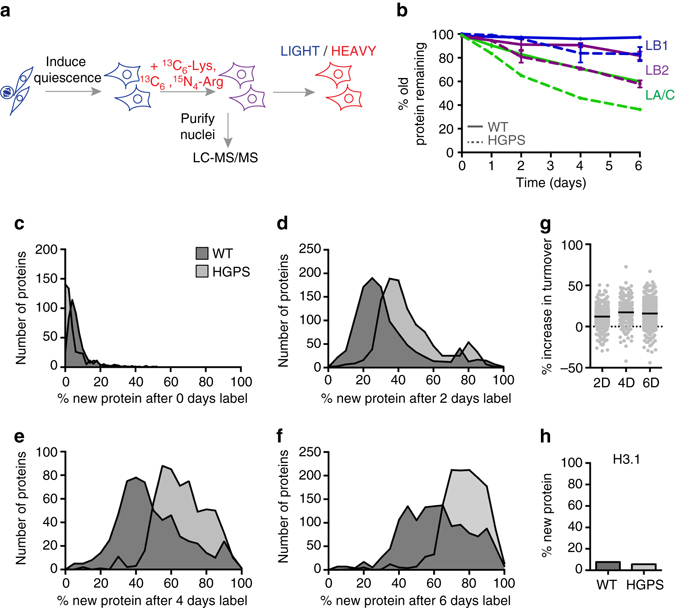
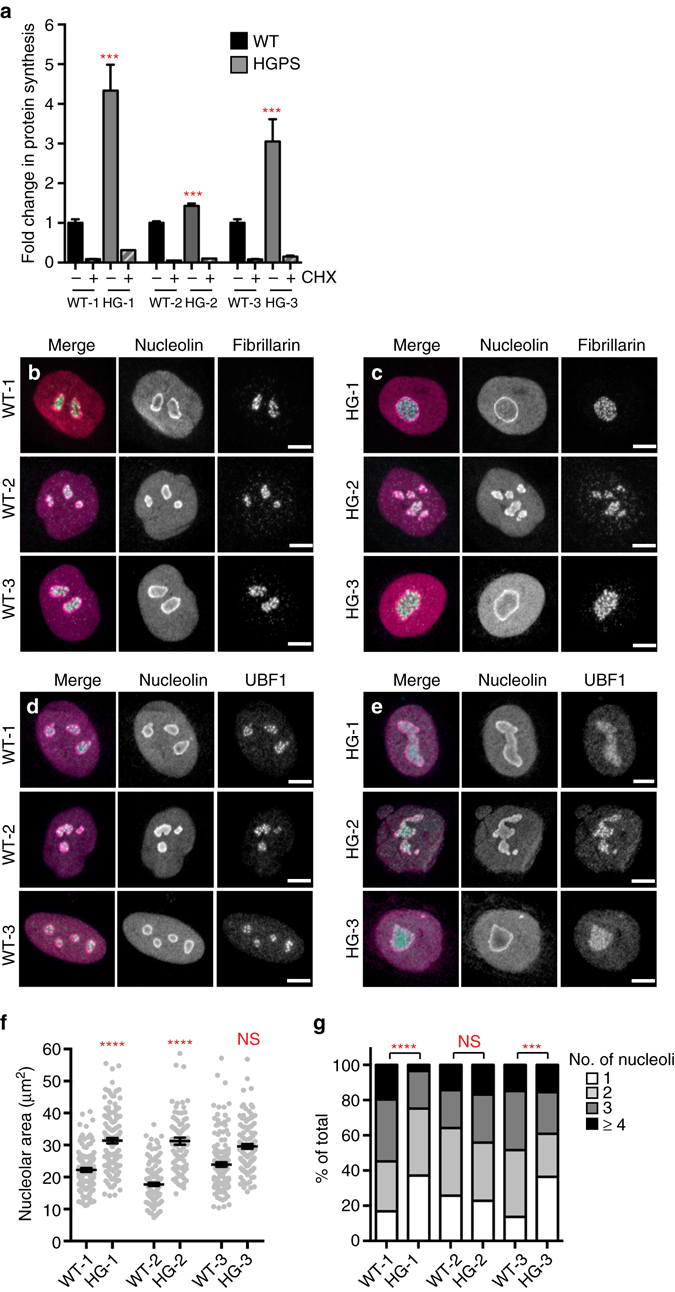
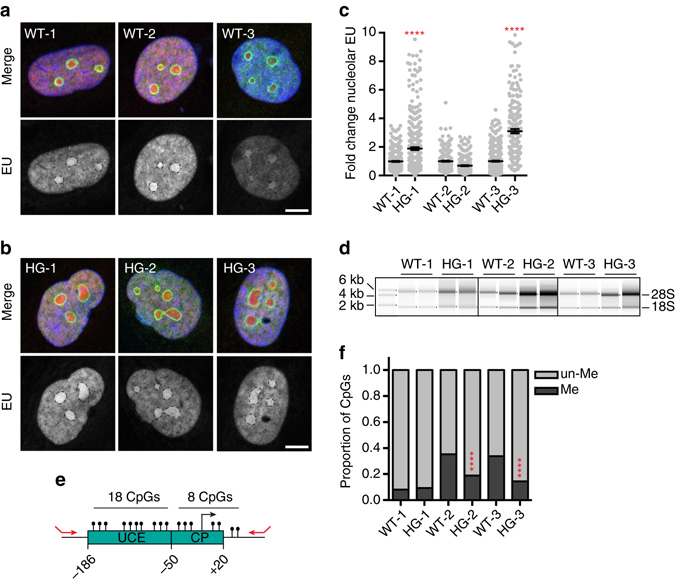
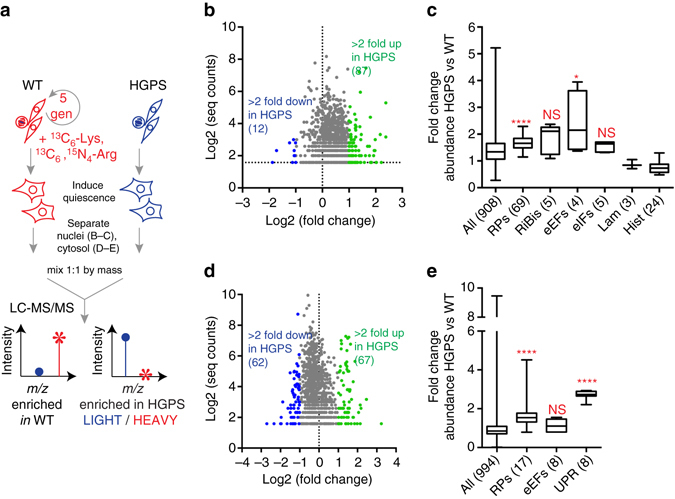
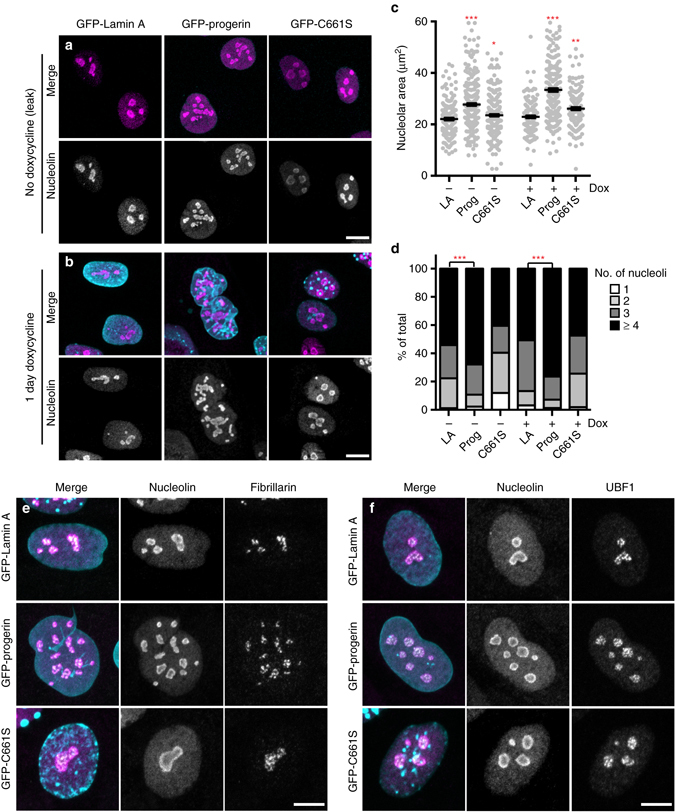
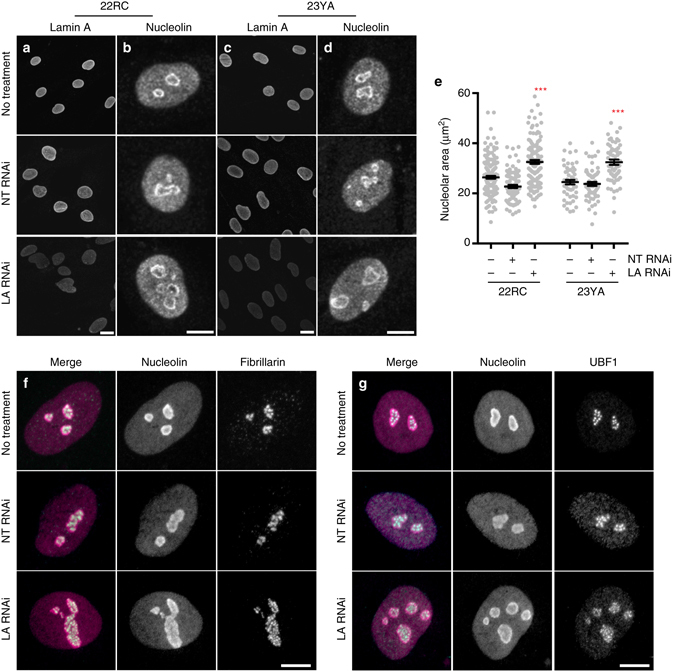
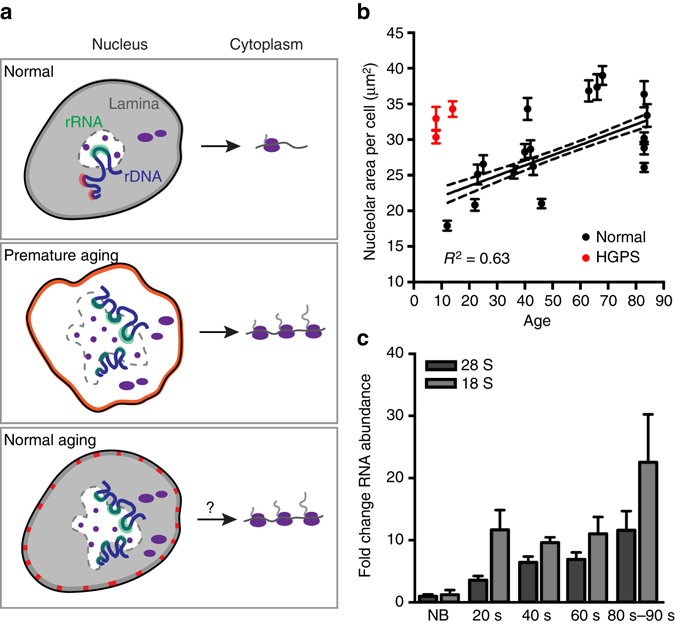
Premature aging disorders provide an opportunity to study the mechanisms that drive aging. In Hutchinson-Gilford progeria syndrome (HGPS), a mutant form of the nuclear scaffold protein lamin A distorts nuclei and sequesters nuclear proteins. We sought to investigate protein homeostasis in this disease. Here, we report a widespread increase in protein turnover in HGPS-derived cells compared to normal cells. We determine that global protein synthesis is elevated as a consequence of activated nucleoli and enhanced ribosome biogenesis in HGPS-derived fibroblasts. Depleting normal lamin A or inducing mutant lamin A expression are each sufficient to drive nucleolar expansion. We further show that nucleolar size correlates with donor age in primary fibroblasts derived from healthy individuals and that ribosomal RNA production increases with age, indicating that nucleolar size and activity can serve as aging biomarkers. While limiting ribosome biogenesis extends lifespan in several systems, we show that increased ribosome biogenesis and activity are a hallmark of premature aging.HGPS is a premature aging disease caused by mutations in the nuclear protein lamin A. Here, the authors show that cells from patients with HGPS have expanded nucleoli and increased protein synthesis, and report that nucleoli also expand as aging progresses in cells derived from healthy individuals.
Overview
The claims and statistics of this paper haven’t been checked yet.
Run the check — free, no account needed. It reads the open-access text and checks the sources it cites.
Integrity signals
Registry
Cites
Statistics
Figures
Verification
Claims the paper makes
The claims and statistics of this paper haven’t been checked yet.
Run the check — free, no account needed. It reads the open-access text and checks the sources it cites.
Claims other papers make about this one
Each is checked against this paper’s own text: does it say what the citing paper says it does?
The cited source says what the claim attributes to it.
In the citing paper
“A previous study also observed that ribosomal protein levels and overall translation were elevated in premature aging (Buchwalter and Hetzer, 2017).”
From Single-Cell Transcriptome Analysis Reveals Six Subpopulations Reflecting Distinct Cellular Fates in Senescent Mouse Embryonic Fibroblasts (2020) · cites this paper as Buchwalter and Hetzer, 2017
In the citing paper
“Senescent cells generally demonstrate an enlarged and flattened cell morphology [27] and expanded nucleoli [28,29], enhanced senescence-associated beta-galactosidase (SA-β-gal) activity [30], telomere shortening, elevation of the cyclin-dependent kinase inhibitor p16 [11,31] or p21 [32], macromolecular damage and metabolism dysfunction [1].”
From Immune Clearance of Senescent Cells to Combat Ageing and Chronic Diseases (2020) · cites this paper as [28]
Self-check
Percentages, sums and reported differences re-computed from the paper’s own numbers.
The self-check needs the paper’s full text.
Citations
Cites
López-Otín, C., Blasco, M. A., Partridge, L., Serrano, M., & Kroemer, G. (2013) · Cell · doi:10.1016/j.cell.2013.05.039 · Cited by 14,982
Rapamycin fed late in life extends lifespan in genetically heterogeneous mice
Harrison, D. E., Strong, R., Sharp, Z. D., Nelson, J. F., Astle, C. M., Flurkey, K., Nadon, N. L., Wilkinson, J. E., Frenkel, K., Carter, C. S., et al. (2009) · Nature · doi:10.1038/nature08221 · Cited by 3,766
Aging, Cellular Senescence, and Cancer
Campisi, J. (2013) · Annual Review of Physiology · doi:10.1146/annurev-physiol-030212-183653 · Cited by 2,954
Recurrent de novo point mutations in lamin A cause Hutchinson-Gilford progeria syndrome
Eriksson, M., Brown, W. T., Gordon, L. B., Glynn, M. W., Singer, J., Scott, L., Erdos, M. R., Robbins, C. M., Moses, T. Y., Berglund, P., et al. (2003) · Nature · doi:10.1038/nature01629 · Cited by 1,990
Extrachromosomal rDNA circles—a cause of aging in yeast
Sinclair, D. A., & Guarente, L. (1997) · Cell · doi:10.1016/s0092-8674(00)80493-6 · Cited by 1,500
A unifying model for mTORC1-mediated regulation of mRNA translation
Thoreen, C. C., Chantranupong, L., Keys, H. R., Wang, T., Gray, N. S., & Sabatini, D. M. (2012) · Nature · doi:10.1038/nature11083 · Cited by 1,477
Tabb, D. L., McDonald, W. H., & Yates, J. R. (2002) · Journal of Proteome Research · doi:10.1021/pr015504q · Cited by 1,369
International trade drives biodiversity threats in developing nations
Lenzen, M., Moran, D. D., Kanemoto, K., Foran, B. D., Lobefaro, L., & Geschke, A. (2012) · Nature · doi:10.1038/nature11145 · Cited by 1,299
Lamin A-dependent nuclear defects in human aging
Scaffidi, P., & Misteli, T. (2006) · Science · doi:10.1126/science.1127168 · Cited by 1,125
Goldman, R. D., Shumaker, D. K., Erdos, M. R., Eriksson, M., Goldman, A. E., Gordon, L. B., Gruenbaum, Y., Khuon, S., Mendez, M., Varga, R., et al. (2004) · Proceedings of the National Academy of Sciences · doi:10.1073/pnas.0402943101 · Cited by 1,103
Research works printed but not linked: 2
- Gesson, K. et al. A-type lamins bind both hetero- and euchromatin, the latter being regulated by lamina-associated polypeptide 2 alpha. Genome Res. 26, 462–473 (2016). · DOI
- Scaffidi, P. & Misteli, T. Lamin A-dependent nuclear defects in human aging. Science 312, 1059–1063 (2006). · DOI · Paper page
Cited by
Sorted by citations
Single-cell transcriptomic profiling of the aging mouse brain
Ximerakis, M., Lipnick, S. L., Innes, B. T., Simmons, S. K., Adiconis, X., Dionne, D., Mayweather, B. A., Nguyen, L., Niziolek, Z., Ozek, C., et al. (2019) · Nature Neuroscience · doi:10.1038/s41593-019-0491-3 · Cited by 736
Bao, H., Cao, J., Chen, M., Min, C., Chen, W., Chen, X., Chen, Y., Chen, Y., Chen, Y., Chen, Z., et al. (2023) · Science China Life Sciences · doi:10.1007/s11427-023-2305-0 · Cited by 402
Small nucleoli are a cellular hallmark of longevity
Tiku, V., Jain, C., Raz, Y., Nakamura, S., Heestand, B., Liu, W., Späth, M., Suchiman, H. E. D., Müller, R.-U., Slagboom, P. E., et al. (2017) · Nature Communications · doi:10.1038/ncomms16083 · Cited by 287
Cellular and epigenetic drivers of stem cell ageing
Ermolaeva, M., Neri, F., Ori, A., & Rudolph, K. L. (2018) · Nature Reviews Molecular Cell Biology · doi:10.1038/s41580-018-0020-3 · Cited by 272
Lamina-associated domains: peripheral matters and internal affairs
Briand, N., & Collas, P. (2020) · Genome biology · doi:10.1186/s13059-020-02003-5 · Cited by 269
The Dual Role of Cellular Senescence in Developing Tumors and Their Response to Cancer Therapy
Schosserer, M., Grillari, J., & Breitenbach, M. (2017) · Frontiers in Oncology · doi:10.3389/fonc.2017.00278 · Cited by 270
Impaired ribosome biogenesis: mechanisms and relevance to cancer and aging
Turi, Z., Lacey, M., Mistrík, M., & Moudrý, P. (2019) · Aging · doi:10.18632/aging.101922 · Cited by 220
Coaching from the sidelines: the nuclear periphery in genome regulation
Buchwalter, A. L., Kaneshiro, J. M., & Hetzer, M. W. (2018) · Nature Reviews Genetics · doi:10.1038/s41576-018-0063-5 · Cited by 213
Self-citationImmune Clearance of Senescent Cells to Combat Ageing and Chronic Diseases
Song, P., An, J., & Zou, M.-H. (2020) · Cells · doi:10.3390/cells9030671 · Cited by 198
“Senescent cells generally demonstrate an enlarged and flattened cell morphology [27] and expanded nucleoli [28,29], enhanced senescence-associated betagalactosidase (SA-β-gal) activity [30], telomere shortening, elevation of the cyclin-dependent kinase inhibitor p16 [11,31] or p21 [32], macromolecular damage and metab…”
BackgroundMETTL3 counteracts premature aging via m6A-dependent stabilization of MIS12 mRNA
Wu, Z., Shi, Y. X., Lu, M., Song, M., Yu, Z., Wang, J., Wang, S., Ren, J., Yang, Y., Liu, G., et al. (2020) · Nucleic Acids Research · doi:10.1093/nar/gkaa816 · Cited by 190
Ribosomopathies: Old Concepts, New Controversies
Farley‐Barnes, K. I., Ogawa, L. M., & Baserga, S. J. (2019) · Trends in Genetics · doi:10.1016/j.tig.2019.07.004 · Cited by 193
Gene expression hallmarks of cellular ageing
Frenk, S., & Houseley, J. (2018) · Biogerontology · doi:10.1007/s10522-018-9750-z · Cited by 181
Nucleolar Function in Lifespan Regulation
Tiku, V., & Antebi, A. (2018) · Trends in Cell Biology · doi:10.1016/j.tcb.2018.03.007 · Cited by 184
Protein synthesis and quality control in aging
Anisimova, A. S., Alexandrov, A. I., Makarova, N. E., Gladyshev, V. N., & Dmitriev, S. E. (2018) · Aging · doi:10.18632/aging.101721 · Cited by 172
Single-dose CRISPR–Cas9 therapy extends lifespan of mice with Hutchinson–Gilford progeria syndrome
Beyret, E., Liao, H., Yamamoto, M., Hernández‐Benítez, R., Fu, Y., Erikson, G. A., Reddy, P., & Belmonte, J. C. I. (2019) · Nature Medicine · doi:10.1038/s41591-019-0343-4 · Cited by 163
Ribosomal DNA harbors an evolutionarily conserved clock of biological aging
Wang, M., & Lemos, B. (2019) · Genome Research · doi:10.1101/gr.241745.118 · Cited by 131
Maintenance of Nucleolar Homeostasis by CBX4 Alleviates Senescence and Osteoarthritis
Ren, X., Hu, B., Song, M., Ding, Z., Dang, Y., Liu, Z., Zhang, W., Ji, Q., Ren, R., Ding, J., et al. (2019) · Cell Reports · doi:10.1016/j.celrep.2019.02.088 · Cited by 139
Phase-to-Phase With Nucleoli – Stress Responses, Protein Aggregation and Novel Roles of RNA
Latonen, L. (2019) · Frontiers in Cellular Neuroscience · doi:10.3389/fncel.2019.00151 · Cited by 134
Correll, C. C., Bártek, J., & Dundr, M. (2019) · Cells · doi:10.3390/cells8080869 · Cited by 126
The Multifaceted Role of Nutrient Sensing and mTORC1 Signaling in Physiology and Aging
Fernandes, S., & Demetriades, C. (2021) · Frontiers in Aging · doi:10.3389/fragi.2021.707372 · Cited by 131
Deterioration of nuclear morphology and architecture: A hallmark of senescence and aging
Pathak, R. U., Soujanya, M., & Mishra, R. K. (2021) · Ageing Research Reviews · doi:10.1016/j.arr.2021.101264 · Cited by 126
Close to the edge: Heterochromatin at the nucleolar and nuclear peripheries
Bizhanova, A., & Kaufman, P. D. (2020) · Biochimica et Biophysica Acta (BBA) - Gene Regulatory Mechanisms · doi:10.1016/j.bbagrm.2020.194666 · Cited by 112
Ribosomal DNA and the nucleolus in the context of genome organization
Potapova, T., & Gerton, J. L. (2019) · Chromosome Research · doi:10.1007/s10577-018-9600-5 · Cited by 103
Nucleophagy: from homeostasis to disease
Papandreou, M., & Tavernarakis, N. (2019) · Cell Death and Differentiation · doi:10.1038/s41418-018-0266-5 · Cited by 107
Ribosome biogenesis restricts innate immune responses to virus infection and DNA
Bianco, C., & Mohr, I. (2019) · eLife · doi:10.7554/elife.49551 · Cited by 103
Lee, D. S. W., Choi, C.-H., Sanders, D. W., Beckers, L., Riback, J. A., Brangwynne, C. P., & Wingreen, N. S. (2023) · Nature Physics · doi:10.1038/s41567-022-01917-0 · Cited by 99
Downregulation of ribosome biogenesis during early forebrain development
Chau, K. F., Shannon, M. L., Fame, R. M., Fonseca, E., Mullan, H., Johnson, M. B., Sendamarai, A. K., Springel, M. W., Laurent, B., & Lehtinen, M. K. (2018) · eLife · doi:10.7554/elife.36998 · Cited by 95
Controlling the material properties and rRNA processing function of the nucleolus using light
Zhu, L., Richardson, T. M., Wacheul, L., Wei, M.-T., Feric, M., Whitney, G., Lafontaine, D. L. J., & Brangwynne, C. P. (2019) · Proceedings of the National Academy of Sciences · doi:10.1073/pnas.1903870116 · Cited by 94
Ribosomal DNA and the Nucleolus as Keystones of Nuclear Architecture, Organization, and Function
Cerqueira, A. V., & Lemos, B. (2019) · Trends in Genetics · doi:10.1016/j.tig.2019.07.011 · Cited by 94
Differential stem cell aging kinetics in Hutchinson-Gilford progeria syndrome and Werner syndrome
Wu, Z., Zhang, W., Song, M., Wang, W., Wei, G., Li, W., Lei, J., Huang, Y., Sang, Y., Chan, P., et al. (2018) · Protein & Cell · doi:10.1007/s13238-018-0517-8 · Cited by 89
Targeting the nucleolus as a therapeutic strategy in human disease
Corman, A., Sirozh, O., Lafarga, V., & Fernández-Capetillo, Ó. (2022) · Trends in Biochemical Sciences · doi:10.1016/j.tibs.2022.09.006 · Cited by 89
mTORC Inhibitors as Broad-Spectrum Therapeutics for Age-Related Diseases
Walters, H. E., & Cox, L. S. (2018) · International Journal of Molecular Sciences · doi:10.3390/ijms19082325 · Cited by 85
Genome-wide maps of nucleolus interactions reveal distinct layers of repressive chromatin domains
Bersaglieri, C., Kresoja‐Rakic, J., Gupta, S., Bär, D., Kuzyakiv, R., Panatta, M., & Santoro, R. (2022) · Nature Communications · doi:10.1038/s41467-022-29146-2 · Cited by 81
Shrestha, S., Erikson, G. A., Lyon, J. G., Spigelman, A. F., Bautista, A., Fox, J. E. M., dos Santos, C., Shokhirev, M. N., Cartailler, J., Hetzer, M. W., et al. (2022) · Science Advances · doi:10.1126/sciadv.abo3932 · Cited by 86
Self-citationHu, Z., Xia, B., Postnikoff, S. D. L., Shen, Z.-J., Tomoiaga, A. S., Harkness, T. A. A., Seol, J. H., Li, W., Chen, K., & Tyler, J. K. (2018) · eLife · doi:10.7554/elife.35551 · Cited by 83
Emerging Role of the Nucleolar Stress Response in Autophagy
Pfister, A. S. (2019) · Frontiers in Cellular Neuroscience · doi:10.3389/fncel.2019.00156 · Cited by 83
Genetic regulation of gene expression and splicing during a 10-year period of human aging
Balliu, B., Durrant, M. G., de Goede, O. M., Abell, N. S., Li, X., Liu, B., Gloudemans, M. J., Cook, N. L., Smith, K. S., Knowles, D. A., et al. (2019) · Genome biology · doi:10.1186/s13059-019-1840-y · Cited by 86
The Y chromosome may contribute to sex-specific ageing in Drosophila
Brown, E. J., Nguyen, A. H., & Bachtrog, D. (2020) · Nature Ecology & Evolution · doi:10.1038/s41559-020-1179-5 · Cited by 84
Targeting senescent cells to attenuate cardiovascular disease progression
Song, P., Zhao, Q., & Zou, M. (2020) · Ageing Research Reviews · doi:10.1016/j.arr.2020.101072 · Cited by 81
Shah, P. P., Keough, K. C., Gjoni, K., Santini, G. T., Abdill, R. J., Wickramasinghe, N. M., Dundes, C. E., Karnay, A. M., Chen, A. C., Salomon, R. E. A., et al. (2023) · Genome biology · doi:10.1186/s13059-023-02849-5 · Cited by 74
Puttaraju, M., Jackson, M., Klein, S., Shilo, A., Bennett, C. F., Gordon, L. B., Rigo, F., & Misteli, T. (2021) · Nature Medicine · doi:10.1038/s41591-021-01262-4 · Cited by 72
Nucleolus and Nucleolar Stress: From Cell Fate Decision to Disease Development
Hua, L., Yan, D., Wan, C., & Hu, B. (2022) · Cells · doi:10.3390/cells11193017 · Cited by 74
Malinovskaya, E. M., Ershova, E. S., Голимбет, В. Е., Porokhovnik, L. N., Lyapunova, N. A., Kutsev, S. I., Veiko, N. N., & Kostyuk, S. V. (2018) · Frontiers in Genetics · doi:10.3389/fgene.2018.00306 · Cited by 79
Recent Advances on the Structure and Function of RNA Acetyltransferase Kre33/NAT10
Sleiman, S., & Dragon, F. (2019) · Cells · doi:10.3390/cells8091035 · Cited by 66
Nucleolar-based Dux repression is essential for embryonic two-cell stage exitPreprint
Xie, S. Q., Leeke, B. J., Whilding, C., Wagner, R. T., Garcia-Llagostera, F., Low, Y., Chammas, P., Cheung, N. T.-F., Dormann, D., McManus, M. T., et al. (2022) · Genes & Development · doi:10.1101/gad.349172.121 · Cited by 60
Perovskite‐Solar‐Cell‐Powered Integrated Fuel Conversion and Energy‐Storage Devices
Yang, G., Yang, W., Gu, H., Fu, Y., Wang, B., Cai, H., Xia, J., Zhang, N., Liang, C., Xing, G., et al. (2023) · Advanced Materials · doi:10.1002/adma.202300383 · Cited by 62
Nucleolar fibrillarin is an evolutionarily conserved regulator of bacterial pathogen resistance
Tiku, V., Kew, C., Mehrotra, P., Ganesan, R., Robinson, N., & Antebi, A. (2018) · Nature Communications · doi:10.1038/s41467-018-06051-1 · Cited by 60
Lamin B2 Modulates Nucleolar Morphology, Dynamics, and Function
Gupta, A. S., & Sengupta, K. (2017) · Molecular and Cellular Biology · doi:10.1128/mcb.00274-17 · Cited by 55
Molecular Mechanism of Nuclear Tau Accumulation and its Role in Protein Synthesis
Portillo, M., Eremenko, E., Kaluski, S., García-Venzor, A., Onn, L., Stein, D., Slobodnik, Z., Zaretsky, A., Ueberham, U., Einav, M., et al. (2020) · Cell Reports · doi:10.1016/j.celrep.2021.109035 · Cited by 61
Nuclear Periphery Takes Center Stage: The Role of Nuclear Pore Complexes in Cell Identity and Aging
Cho, U. H., & Hetzer, M. W. (2020) · Neuron · doi:10.1016/j.neuron.2020.05.031 · Cited by 54
Self-citationActive phase separation: new phenomenology from non-equilibrium physics
Cates, M. E., & Nardini, C. (2025) · Reports on Progress in Physics · doi:10.1088/1361-6633/add278 · Cited by 63
Anzi, S., Stolovich-Rain, M., Klochendler, A., Fridlich, O., Helman, A., Paz, A., Avni‐Magen, N., Kaufman, E. A., Ginzberg, M. B., Snider, D., et al. (2018) · Developmental Cell · doi:10.1016/j.devcel.2018.05.024 · Cited by 55
Nucleolar and Ribosomal DNA Structure under Stress: Yeast Lessons for Aging and Cancer
Matos‐Perdomo, E., & Machín, F. (2019) · Cells · doi:10.3390/cells8080779 · Cited by 53
Healthy ageing and spermatogenesis
Pohl, E., Gromoll, J., Wistuba, J., & Laurentino, S. (2021) · Reproduction · doi:10.1530/rep-20-0633 · Cited by 50
Hutchinson-Gilford Progeria Syndrome: Cellular Mechanisms and Therapeutic Perspectives
Cisneros, B., García‐Aguirre, I., Ita, M. D., Arrieta‐Cruz, I., & Rosas‐Vargas, H. (2023) · Archives of Medical Research · doi:10.1016/j.arcmed.2023.06.002 · Cited by 55
Ribosomal DNA and the nucleolus at the heart of aging
Kasselimi, E., Pefani, D., Taraviras, S. L., & Lygerou, Z. (2022) · Trends in Biochemical Sciences · doi:10.1016/j.tibs.2021.12.007 · Cited by 53
The mechanobiology of nuclear phase separation
Lee, D. S. W., Strom, A. R., & Brangwynne, C. P. (2022) · APL Bioengineering · doi:10.1063/5.0083286 · Cited by 47
Buchwalter, A. L., Schulte, R. J., Tsai, H., Capitanio, J. S., & Hetzer, M. W. (2019) · eLife · doi:10.7554/elife.49796 · Cited by 46
Self-citationSirozh, O., Sáez-Mas, A., Jung, B., Sanchez‐Burgos, L., Zarzuela, E., Rodrigo-Perez, S., Ventoso, I., Lafarga, V., & Fernández-Capetillo, Ó. (2024) · Molecular Cell · doi:10.1016/j.molcel.2024.02.031 · Cited by 50
Metabolic Dysfunction in Hutchinson–Gilford Progeria Syndrome
Kreienkamp, R., & Gonzalo, S. (2020) · Cells · doi:10.3390/cells9020395 · Cited by 45
Pohl, E., Höffken, V., Schlatt, S., Kliesch, S., Gromoll, J., & Wistuba, J. (2019) · Andrology · doi:10.1111/andr.12665 · Cited by 43
Shrimp, J. H., Jing, Y., Gamage, S. T., Nelson, K. M., Han, J., Bryson, K. M., Montgomery, D. C., Thomas, J. M., Nance, K. D., Sharma, S., et al. (2020) · ACS Medicinal Chemistry Letters · doi:10.1021/acsmedchemlett.0c00193 · Cited by 43
Biomarkers of ageing of humans and non-human primates
Wu, Z., Qu, J. T., Zhang, W., Bao, Z., Bi, Y., Cai, J.-P., Cai, S.-Q., Cao, C.-M., Cao, F., Cao, Z., et al. (2025) · Nature Reviews Molecular Cell Biology · doi:10.1038/s41580-025-00883-8 · Cited by 52
Insights into the Relationship between Nucleolar Stress and the NF-κB Pathway
Chen, J., & Stark, L. A. (2019) · Trends in Genetics · doi:10.1016/j.tig.2019.07.009 · Cited by 43
Spaulding, E. L., Feidler, A. M., Cook, L. A., & Updike, D. L. (2022) · Nature Communications · doi:10.1038/s41467-022-34225-5 · Cited by 39
Mammalian oogenesis and female reproductive aging
Duncan, F. E., & Gerton, J. L. (2018) · Aging · doi:10.18632/aging.101381 · Cited by 39
Translational control in aging and neurodegeneration
Skariah, G., & Todd, P. K. (2020) · Wiley Interdisciplinary Reviews - RNA · doi:10.1002/wrna.1628 · Cited by 42
Pfister, A. S., & Kühl, M. (2017) · Progress in molecular biology and translational science · doi:10.1016/bs.pmbts.2017.11.006 · Cited by 39
Protein translation paradox: Implications in translational regulation of aging
Kim, H. S., & Pickering, A. M. (2023) · Frontiers in Cell and Developmental Biology · doi:10.3389/fcell.2023.1129281 · Cited by 43
Histone malonylation is regulated by SIRT5 and KAT2A
Zhang, R., Bons, J., Scheidemantle, G. M., Liu, X., Bielska, O., Carrico, C., Rose, J., Heckenbach, I., Scheibye‐Knudsen, M., Schilling, B., et al. (2023) · iScience · doi:10.1016/j.isci.2023.106193 · Cited by 40
The nucleolus: Coordinating stress response and genomic stability
González‐Arzola, K. (2024) · Biochimica et Biophysica Acta (BBA) - Gene Regulatory Mechanisms · doi:10.1016/j.bbagrm.2024.195029 · Cited by 38
Stamatopoulou, V., Parisot, P., Vleeschouwer, C. D., & Lafontaine, D. L. J. (2018) · Nature Protocols · doi:10.1038/s41596-018-0044-3 · Cited by 38
Crosstalk between NF-κB and Nucleoli in the Regulation of Cellular Homeostasis
Chen, J., & Stark, L. A. (2018) · Cells · doi:10.3390/cells7100157 · Cited by 37
Acetylation-mediated remodeling of the nucleolus regulates cellular acetyl-CoA responses
Houston, R., Sekine, S., Calderon, M. J., Seifuddin, F., Wang, G., Kawagishi, H., Malide, D. A., Li, Y., Guček, M., Pirooznia, M., et al. (2020) · PLoS Biology · doi:10.1371/journal.pbio.3000981 · Cited by 37
The central role of DNA damage in immunosenescence
Kell, L., Simon, A. K., Alsaleh, G., & Cox, L. S. (2023) · Frontiers in Aging · doi:10.3389/fragi.2023.1202152 · Cited by 44
Veith, S., Schink, A., Engbrecht, M., Mack, M., Rank, L., Rossatti, P., Hakobyan, M., Goly, D., Hefele, T., Frensch, M., et al. (2019) · Scientific Reports · doi:10.1038/s41598-019-46358-7 · Cited by 37
Extreme disruption of heterochromatin is required for accelerated hematopoietic aging
Keenan, C. R., Iannarella, N., Naselli, G., Bediaga, N. G., Johanson, T. M., Harrison, L. C., & Allan, R. S. (2020) · Blood · doi:10.1182/blood.2019002990 · Cited by 34
García‐Aguirre, I., Alamillo‐Iniesta, A., Rodríguez‐Pérez, R., Vélez‐Aguilera, G., Amaro‐Encarnación, E., Jiménez-Gutiérrez, G. E., Vásquez‐Limeta, A., Laredo-Cisneros, M. S., Morales‐Lázaro, S. L., Tiburcio‐Félix, R., et al. (2019) · Aging Cell · doi:10.1111/acel.13002 · Cited by 34
PARP1 at the crossroad of cellular senescence and nucleolar processes
Kołacz-Milewska, K., & Robaszkiewicz, A. (2024) · Ageing Research Reviews · doi:10.1016/j.arr.2024.102206 · Cited by 34
Alzheimer’s in a dish – induced pluripotent stem cell-based disease modeling
de Leeuw, S., & Tackenberg, C. (2019) · Translational Neurodegeneration · doi:10.1186/s40035-019-0161-0 · Cited by 31
DNA methylation and histone variants in aging and cancer
Mangelinck, A., & Mann, C. (2021) · International review of cytology · doi:10.1016/bs.ircmb.2021.06.002 · Cited by 35
SIRT7 Facilitates CENP-A Nucleosome Assembly and Suppresses Intestinal Tumorigenesis
Liu, X., Li, C., Li, Q., Chang, H.-C., & Tang, Y. (2020) · iScience · doi:10.1016/j.isci.2020.101461 · Cited by 33
Nucleophagy delays aging and preserves germline immortality
Papandreou, M., Konstantinidis, G., & Tavernarakis, N. (2022) · Nature Aging · doi:10.1038/s43587-022-00327-4 · Cited by 32
Proliferation, cancer, and aging—novel functions of the nucleolar methyltransferase fibrillarin?
Shubina, M. Y., Musinova, Y. R., & Sheval, E. V. (2018) · Cell Biology International · doi:10.1002/cbin.11044 · Cited by 35
Identification of a novel TIF-IA–NF-κB nucleolar stress response pathway
Chen, J., Lobb, I. T., Morin, P., Novo, S. M., Simpson, J., Kennerknecht, K., von Kriegsheim, A., Batchelor, E. E., Oakley, F., & Stark, L. A. (2018) · Nucleic Acids Research · doi:10.1093/nar/gky455 · Cited by 28
Basisty, N., Holtz, A. N., & Schilling, B. (2019) · PROTEOMICS · doi:10.1002/pmic.201800403 · Cited by 29
Long lifetime and tissue-specific accumulation of lamin A/C in Hutchinson–Gilford progeria syndrome
Hasper, J., Welle, K. A., Swovick, K., Hryhorenko, J. R., Ghaemmaghami, S., & Buchwalter, A. L. (2023) · The Journal of Cell Biology · doi:10.1083/jcb.202307049 · Cited by 29
Self-citationBurnaevskiy, N., Chen, S., Mailig, M., Reynolds, A., Karanth, S., Mendenhall, A., Gilst, M. R. V., & Kaeberlein, M. R. (2018) · eLife · doi:10.7554/elife.36194 · Cited by 28
Nucleophagy—Implications for Microautophagy and Health
Otto, F. B., & Thumm, M. (2020) · International Journal of Molecular Sciences · doi:10.3390/ijms21124506 · Cited by 27
Chen, W., Wang, X., Wei, G., Huang, Y., Shi, Y., Li, D., Qiu, S., Zhou, B., Cao, J., Chen, M., et al. (2020) · Frontiers in Genetics · doi:10.3389/fgene.2020.00867 · Cited by 26
Organelle size scaling over embryonic development
Wesley, C. C., Mishra, S., & Levy, D. L. (2020) · Wiley Interdisciplinary Reviews Developmental Biology · doi:10.1002/wdev.376 · Cited by 27
New Insights into the Functions of Nucleic Acids Controlled by Cellular Microenvironments
Matsumoto, S., & Sugimoto, N. (2021) · Topics in Current Chemistry · doi:10.1007/s41061-021-00329-7 · Cited by 28
Blockage of lamin-A/C loss diminishes the pro-inflammatory macrophage response
Mehl, J. L., Earle, A., Lammerding, J., Mhlanga, M. M., Viola Vogel, B., & Jain, N. (2022) · iScience · doi:10.1016/j.isci.2022.105528 · Cited by 25
The role of cardiomyocyte senescence in cardiovascular diseases: A molecular biology update
He, S., Li, Y., Yuan, C., Li, W., Tian, W., Chen, S., Li, N., Wu, M., & Jiang, J. (2024) · European Journal of Pharmacology · doi:10.1016/j.ejphar.2024.176961 · Cited by 24
Emerging role of N-acetyltransferase 10 in diseases: RNA ac4C modification and beyond
Jiao, L., Si, Y., Yuan, Y., Lei, X., Jiang, Q., Yang, L., Mao, W., Ying, B., Ma, L., & Sun, T. (2025) · Molecular Biomedicine · doi:10.1186/s43556-025-00286-3 · Cited by 23
Reducing the metabolic burden of rRNA synthesis promotes healthy longevity in Caenorhabditis elegans
Sharifi, S., Chaudhari, P., Martirosyan, A., Eberhardt, A. O., Witt, F., Gollowitzer, A., Lange, L. D., Woitzat, Y., Okoli, E. M., Li, H., et al. (2024) · Nature Communications · doi:10.1038/s41467-024-46037-w · Cited by 27
Báez-Becerra, C. T., Valencia-Rincón, E., Velásquez-Méndez, K. L., Ramírez-Suárez, N. J., Guevara, C., Sandoval-Hernández, A. G., Bustos, C., Olivos-Cisneros, L., Gutiérrez‐Ospina, G., Arboleda, H., et al. (2020) · Mechanisms of Ageing and Development · doi:10.1016/j.mad.2020.111360 · Cited by 24
No Time to Age: Uncoupling Aging from Chronological Time
Larocca, D., Lee, J., West, M. D., Labat, I., & Sternberg, H. (2021) · Genes · doi:10.3390/genes12050611 · Cited by 22
The NF-κB Nucleolar Stress Response Pathway
Thoms, H. C., & Stark, L. A. (2021) · Biomedicines · doi:10.3390/biomedicines9091082 · Cited by 24
Hu, Q., Zhang, N., Sui, T., Li, G., Wang, Z., Liu, M., Zhu, X., Huang, B., Lü, J., Li, Z., et al. (2022) · The EMBO Journal · doi:10.15252/embj.2022110937 · Cited by 22
Metadata
- Authors
- Buchwalter, A., & Hetzer, M. W.
- Affiliations
- Salk Institute for Biological Studies (US)
- Corresponding author
- Hetzer, Martin W.
- Venue
- Nature Communications
- Published
- 2017-08-30
- Volume
- 8
- Issue
- 1
- Pages
- 328-328
- ISSN
- 2041-1723 (ISSN-L)
- PMC
- PMC5577202
- OpenAlex
- W2749445972
- Cited by
- 263
- References
- 74
- Citations by year
- 2026: 24 · 2025: 35 · 2024: 34 · 2023: 25 · 2022: 32 · 2021: 19 · 2020: 27 · 2019: 35 · 2018: 24 · 2017: 8
- FWCI
- 10.45
- Type
- journal article
- Language
- en
- Open access
- gold
- doi.org
- Locations
- Nature Communications (publishedVersion, cc-by)
- PubMed Central (publishedVersion, cc-by)
- PubMed (publishedVersion)
- RePEc: Research Papers in Economics (submittedVersion)
- DOAJ (DOAJ: Directory of Open Access Journals) (submittedVersion, cc-by-sa)
- Funders
- Leona M. and Harry B. Helmsley Charitable Trust
- NOMIS Stiftung
- National Institutes of Health (NCI CCSG: P30 014195, P30 014195)
- National Cancer Institute (CCSG:P30 014195, NIH-NCI CCSG: P30 014195, P30014195)
- National Institute of Neurological Disorders and Stroke (R01NS096786)
- Topics
- Life Sciences › Biochemistry, Genetics and Molecular Biology › Molecular Biology › Nuclear Structure and Function
- Life Sciences › Biochemistry, Genetics and Molecular Biology › Aging › Genetics, Aging, and Longevity in Model Organisms
- Life Sciences › Biochemistry, Genetics and Molecular Biology › Molecular Biology › RNA and protein synthesis mechanisms
- Keywords
- Hutchinson-Gilford progeria syndrome, premature aging, lamin A, ribosome biogenesis, protein synthesis, protein turnover, aging biomarkers, fibroblasts, lifespan
- MeSH terms
- Aging, Cell Line, Cell Nucleolus, Cells, Cultured, Humans, Mutation, Progeria, Protein Biosynthesis, Microscopy, Confocal, Aging, Premature, RNA Interference, Lamin Type A
About these checks
Registry, retraction, Cites and statistics results are computed, not judged, with one exception: a printed reference that no index lists is read once by a model before it counts as a citation error. Claims are extracted by a model and kept only when their quote appears verbatim in the text; each cited source is then checked, with a model’s help, for whether it says what the claim relies on. Those verdicts can be wrong — read the claim’s quote and the cited source before relying on one.
Statistics and arithmetic are recomputed, not judged.
Confidence bands are shown only for fields calibrated on our annotated test set. None is calibrated yet, so no band is shown.
What counts as a claim ›How we measure confidence ›How we check this ›
Are you an author, or do you see a problem with this page? Request a review
