

The DOI matches its Crossref record; 82 of the 82 references it cites were found in a registry or an index.
Arsenic targets Pin1 and cooperates with retinoic acid to inhibit cancer-driving pathways and tumor-initiating cells
Open accessAbstract
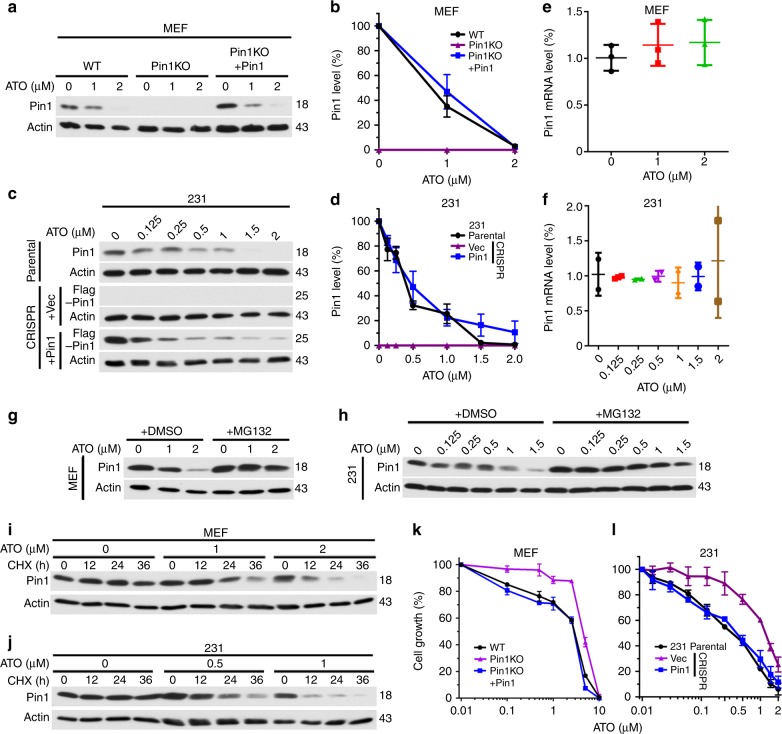
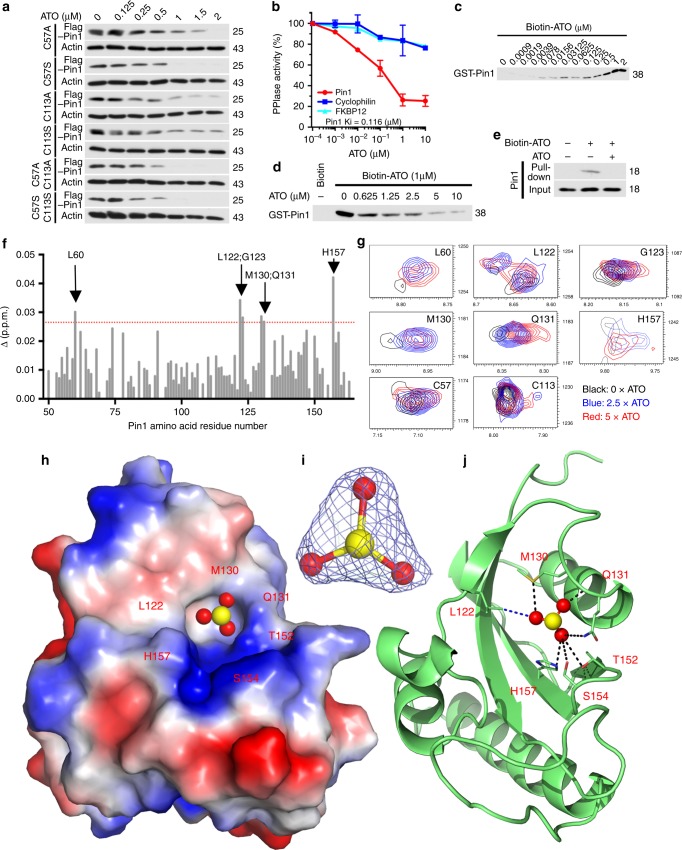
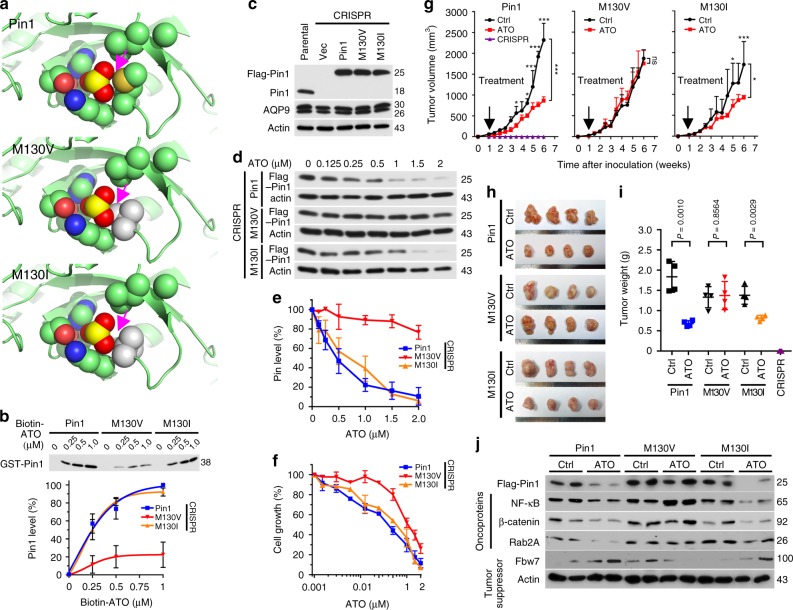
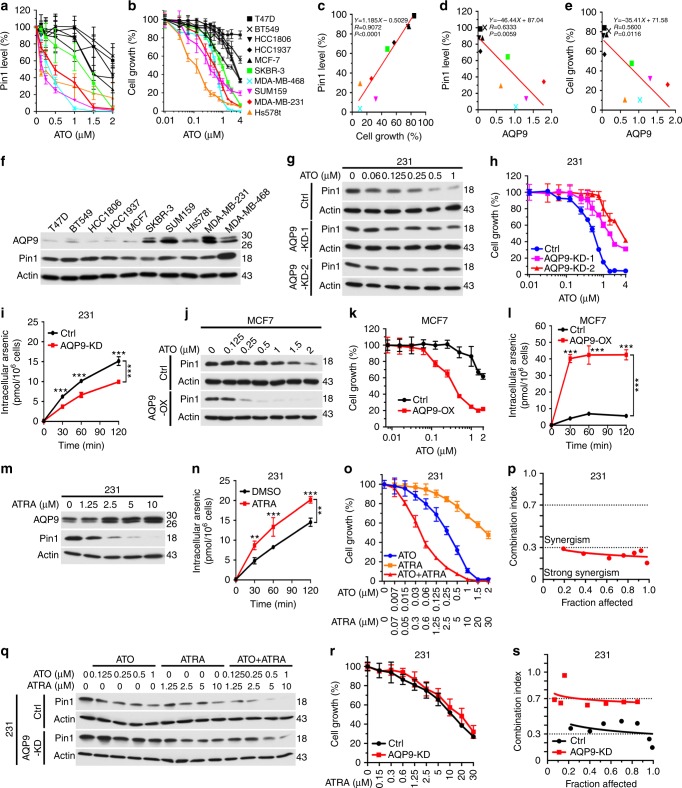
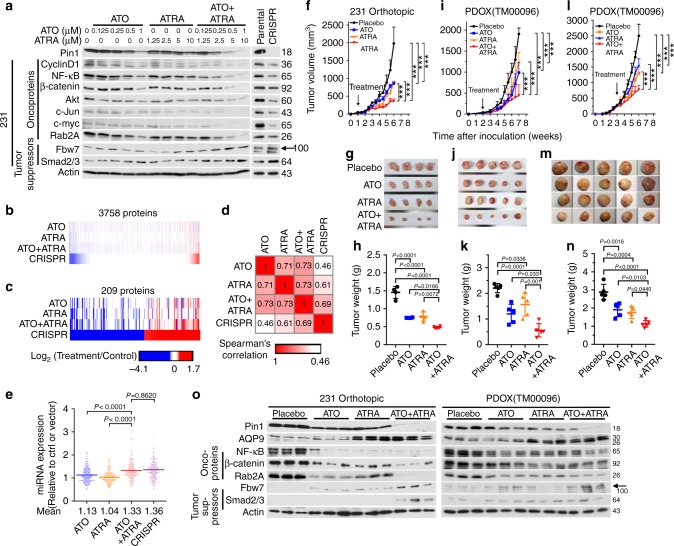
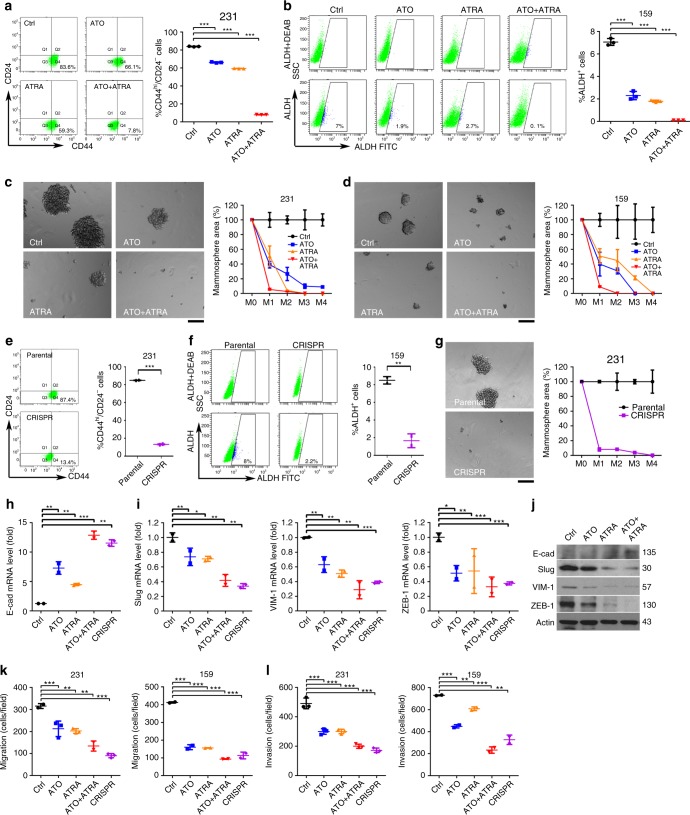
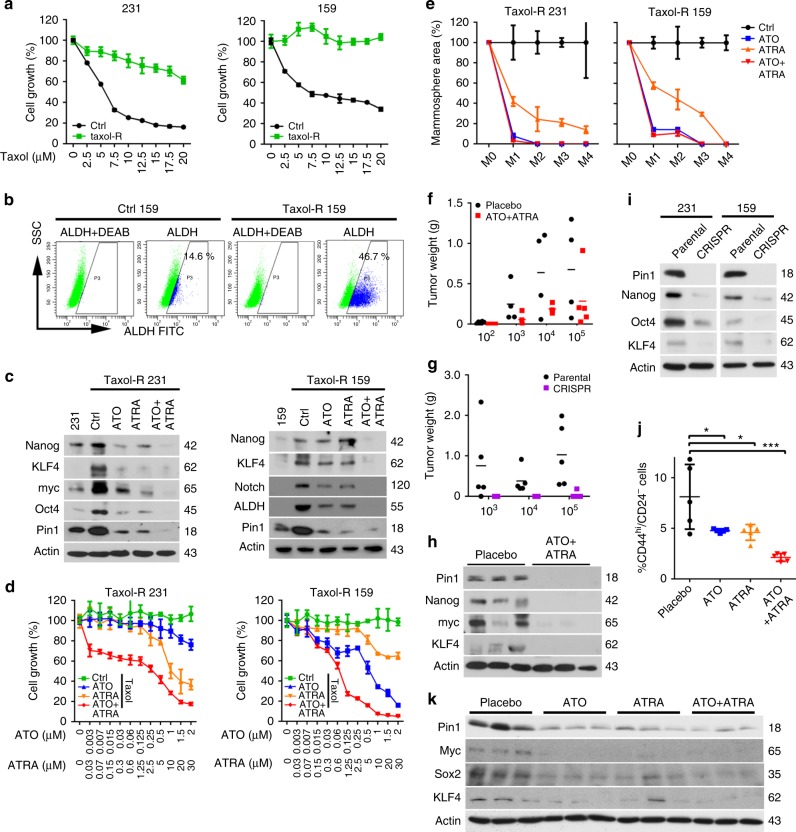
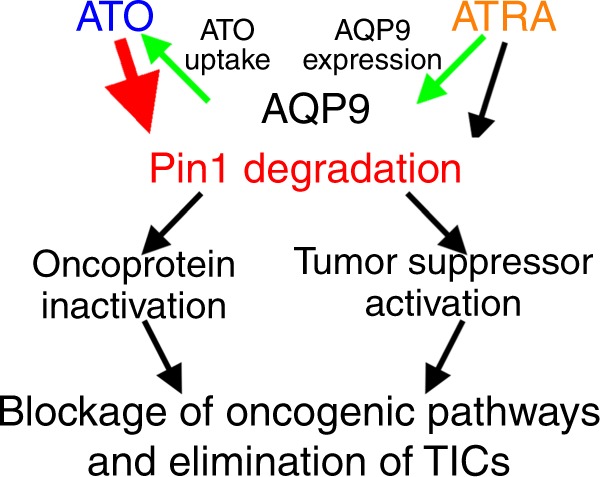
Arsenic trioxide (ATO) and all-trans retinoic acid (ATRA) combination safely cures fatal acute promyelocytic leukemia, but their mechanisms of action and efficacy are not fully understood. ATRA inhibits leukemia, breast, and liver cancer by targeting isomerase Pin1, a master regulator of oncogenic signaling networks. Here we show that ATO targets Pin1 and cooperates with ATRA to exert potent anticancer activity. ATO inhibits and degrades Pin1, and suppresses its oncogenic function by noncovalent binding to Pin1’s active site. ATRA increases cellular ATO uptake through upregulating aquaporin-9. ATO and ATRA, at clinically safe doses, cooperatively ablate Pin1 to block numerous cancer-driving pathways and inhibit the growth of triple-negative breast cancer cells and tumor-initiating cells in cell and animal models including patient-derived orthotopic xenografts, like Pin1 knockout, which is substantiated by comprehensive protein and microRNA analyses. Thus, synergistic targeting of Pin1 by ATO and ATRA offers an attractive approach to combating breast and other cancers.
Overview
The claims and statistics of this paper haven’t been checked yet.
Run the check — free, no account needed. It reads the open-access text and checks the sources it cites.
Integrity signals
Registry
Cites
Statistics
Figures
Verification
Claims the paper makes
The claims and statistics of this paper haven’t been checked yet.
Run the check — free, no account needed. It reads the open-access text and checks the sources it cites.
Claims other papers make about this one
Each is checked against this paper’s own text: does it say what the citing paper says it does?
The cited source says what the claim attributes to it.
In the citing paper
“The antitumoral activity of RA (enhanced by cooperation with arsenic trioxide)11 was due to inhibition and degradation of prolyl isomerase Pin1, which has a critical role in coordinating multiple phosphorylation events during oncogenesis12.”
From Advances and challenges in retinoid delivery systems in regenerative and therapeutic medicine (2020) · cites this paper as [11]
In the citing paper
“RA promoted terminal differentiation of leukemic cells while reducing their proliferation.”
From Advances and challenges in retinoid delivery systems in regenerative and therapeutic medicine (2020) · cites this paper as [11]
Self-check
Percentages, sums and reported differences re-computed from the paper’s own numbers.
The self-check needs the paper’s full text.
Citations
Cites
Hallmarks of Cancer: The Next Generation
Hanahan, D., & Weinberg, R. A. (2011) · Cell · doi:10.1016/j.cell.2011.02.013 · Cited by 66,590
Phaser crystallographic software
McCoy, A. J., Grosse-Kunstleve, R. W., Adams, P. D., Winn, M. D., Storoni, L. C., & Read, R. J. (2007) · Journal of Applied Crystallography · doi:10.1107/s0021889807021206 · Cited by 20,612
MicroRNA expression profiles classify human cancers
Lü, J., Getz, G. A., Miska, E. A., Alvarez-Saavedra, E., Lamb, J., Peck, D., Sweet-Cordero, A., Ebert, B. L., Mak, R. H., Ferrando, A. A., et al. (2005) · Nature · doi:10.1038/nature03702 · Cited by 9,637
The Epithelial-Mesenchymal Transition Generates Cells with Properties of Stem Cells
Mani, S. A., Guo, W., Liao, M.-J., Eaton, E. N., Ayyanan, A., Zhou, A. Y., Brooks, M. W., Reinhard, F., Zhang, C. C., Shipitsin, M. V., et al. (2008) · Cell · doi:10.1016/j.cell.2008.03.027 · Cited by 8,839
Chou, T.-C., & Talalay, P. (1984) · Advances in Enzyme Regulation · doi:10.1016/0065-2571(84)90007-4 · Cited by 7,178
DNA targeting specificity of RNA-guided Cas9 nucleases
Hsu, P. D., Scott, D. A., Weinstein, J. A., Ran, F. A., Konermann, S., Agarwala, V., Li, Y., Fine, E. J., Wu, X., Shalem, O., et al. (2013) · Nature Biotechnology · doi:10.1038/nbt.2647 · Cited by 4,741
Foulkes, W. D., Smith, I. E., & Reis-Filho, J. S. (2010) · New England Journal of Medicine · doi:10.1056/nejmra1001389 · Cited by 4,719
Tumour stem cells and drug resistance
Dean, M., Fojo, T., & Bates, S. (2005) · Nature reviews. Cancer · doi:10.1038/nrc1590 · Cited by 3,668
Transitions between epithelial and mesenchymal states: acquisition of malignant and stem cell traits
Polyak, K., & Weinberg, R. A. (2009) · Nature Reviews Cancer · doi:10.1038/nrc2620 · Cited by 3,302
The CCPN data model for NMR spectroscopy: Development of a software pipeline
Vranken, W., Boucher, W., Stevens, T. J., Fogh, R. H., Pajon, A., Llinás, M., Ulrich, E. L., Markley, J. L., Ionides, J., & Laue, E. D. (2005) · Proteins Structure Function and Bioinformatics · doi:10.1002/prot.20449 · Cited by 3,222
Integration, scaling, space-group assignment and post-refinement
Kabsch, W. (2010) · Acta Crystallographica Section D Biological Crystallography · doi:10.1107/s0907444909047374 · Cited by 2,564
Principles of cancer therapy: oncogene and non-oncogene addiction
Luo, J., Solimini, N. L., & Elledge, S. J. (2009) · Cell · doi:10.1016/j.cell.2009.02.024 · Cited by 1,765
Jordan, C. T., Guzmán, M. L., & Noble, M. (2006) · New England Journal of Medicine · doi:10.1056/nejmra061808 · Cited by 1,748
Mechanisms of specificity in protein phosphorylation
Ubersax, J. A., & Ferrell Jr, J. E. (2007) · Nature Reviews Molecular Cell Biology · doi:10.1038/nrm2203 · Cited by 1,451
Acute promyelocytic leukemia: from highly fatal to highly curable
Wang, Z., & Chen, Z. (2008) · Blood · doi:10.1182/blood-2007-07-102798 · Cited by 1,282
Triple-negative breast cancer: therapeutic options
Cleator, S. J., Heller, W., & Coombes, R. C. (2007) · The Lancet Oncology · doi:10.1016/s1470-2045(07)70074-8 · Cited by 887
Chen, G.-Q., Zhu, J., Shi, X., Ni, J., Zhong, H., Si, G., Jin, X., Tang, W., Li, X., Xong, S., et al. (1996) · Blood · doi:10.1182/blood.v88.3.1052.1052 · Cited by 870
Shen, S., Li, X., Cullen, W., Weinfeld, M., & Le, X. C. (2013) · Chemical Reviews · doi:10.1021/cr300015c · Cited by 843
Arsenic Trioxide Controls the Fate of the PML-RARα Oncoprotein by Directly Binding PML
Zhang, X., Yan, X.-J., Zhou, Z., Yang, F., Wu, Z., Sun, H., Liang, W., Song, A., Lallemand-Breitenbach, V., Jeanne, M., et al. (2010) · Science · doi:10.1126/science.1183424 · Cited by 785
Yaffe, M. B., Schutkowski, M., Shen, M., Zhou, X. Z., Stukenberg, P. T., Rahfeld, J., Xu, J., Kuang, J., Kirschner, M. W., Fischer, G. S., et al. (1997) · Science · doi:10.1126/science.278.5345.1957 · Cited by 770
Self-citationRanganathan, R., Lu, K. P., Hunter, T. R., & Noel, J. P. (1997) · Cell · doi:10.1016/s0092-8674(00)80273-1 · Cited by 703
Self-citationProlyl cis-trans isomerization as a molecular timer
Lu, K. P., Finn, G., Lee, T. H., & Nicholson, L. K. (2007) · Nature Chemical Biology · doi:10.1038/nchembio.2007.35 · Cited by 655
Self-citationRyo, A., Suizu, F., Yoshida, Y., Perrem, K., Liou, Y., Wulf, G. M., Rottapel, R. K., Yamaoka, S., & Lu, K. P. (2003) · Molecular Cell · doi:10.1016/s1097-2765(03)00490-8 · Cited by 636
Self-citationWulf, G. M., Ryo, A., Wulf, G. G., Lee, S. W., Niu, T., Petkova, V., & Lu, K. P. (2001) · The EMBO Journal · doi:10.1093/emboj/20.13.3459 · Cited by 529
Self-citationArsenite transport by mammalian aquaglyceroporins AQP7 and AQP9
Liu, Z., Shen, J., Carbrey, J. M., Mukhopadhyay, R., Agre, P., & Rosen, B. P. (2002) · Proceedings of the National Academy of Sciences · doi:10.1073/pnas.092131899 · Cited by 505
Acute promyelocytic leukaemia: novel insights into the mechanisms of cure
de Thé, H., & Zhu, C. (2010) · Nature reviews. Cancer · doi:10.1038/nrc2943 · Cited by 490
Ryo, A., Nakamura, M., Wulf, G. M., Liou, Y.-C., & Lu, K. P. (2001) · Nature Cell Biology · doi:10.1038/ncb0901-793 · Cited by 470
Self-citationAntibody against early driver of neurodegeneration cis P-tau blocks brain injury and tauopathy
Kondo, A., Shahpasand, K., Mannix, R., Qiu, J., Moncaster, J., Chen, C.-H., Yao, Y., Lin, Y.-M., Driver, J. A., Sun, Y., et al. (2015) · Nature · doi:10.1038/nature14658 · Cited by 445
Self-citationRole of the prolyl isomerase Pin1 in protecting against age-dependent neurodegeneration
Liou, Y., Sun, A., Ryo, A., Zhou, X. Z., Yu, Z.-X., Huang, H.-K., Uchida, T., Bronson, R. T., Bing, G., Li, X., et al. (2003) · Nature · doi:10.1038/nature01832 · Cited by 432
Self-citationDilda, P. J., & Hogg, P. J. (2007) · Cancer Treatment Reviews · doi:10.1016/j.ctrv.2007.05.001 · Cited by 397
Eradication of acute promyelocytic leukemia-initiating cells through PML-RARA degradation
Nasr, R., Guillemin, M.-C., Ferhi, O., Soilihi, H., Pérès, L., Berthier, C., Rousselot, P. H., Robledo-Sarmiento, M., Lallemand-Breitenbach, V., Gourmel, B., et al. (2008) · Nature Medicine · doi:10.1038/nm.1891 · Cited by 354
Loss of Pin1 function in the mouse causes phenotypes resembling cyclin D1-null phenotypes
Liou, Y.-C., Ryo, A., Huang, H.-K., Lu, P., Bronson, R. T., Fujimori, F., Uchida, T., Hunter, T. R., & Lu, K. P. (2002) · Proceedings of the National Academy of Sciences · doi:10.1073/pnas.032404099 · Cited by 341
Self-citationPML/RARA Oxidation and Arsenic Binding Initiate the Antileukemia Response of As2O3
Jeanne, M., Lallemand-Breitenbach, V., Ferhi, O., Koken, M. H. M., Bras, M. L., Duffort, S., Pérès, L., Berthier, C., Soilihi, H., Raught, B., et al. (2010) · Cancer Cell · doi:10.1016/j.ccr.2010.06.003 · Cited by 332
How acute promyelocytic leukaemia revived arsenic
Zhu, J., Chen, Z., Lallemand-Breitenbach, V., & de Thé, H. (2002) · Nature reviews. Cancer · doi:10.1038/nrc887 · Cited by 324
Cancer genomics: one cell at a time
Navin, N. E. (2014) · Genome biology · doi:10.1186/s13059-014-0452-9 · Cited by 318
Lallemand-Breitenbach, V., Guillemin, M.-C., Janin, A., Daniel, M., Degos, L., Kogan, S. C., Bishop, J. M., & de Thé, H. (1999) · The Journal of Experimental Medicine · doi:10.1084/jem.189.7.1043 · Cited by 306
A Pin1/Mutant p53 Axis Promotes Aggressiveness in Breast Cancer
Girardini, J. E., Napoli, M., Piazza, S., Rustighi, A., Marotta, C., Radaelli, E., Capaci, V., Jordan, L. B., Quinlan, P., Thompson, A., et al. (2011) · Cancer Cell · doi:10.1016/j.ccr.2011.06.004 · Cited by 290
The isomerase PIN1 controls numerous cancer-driving pathways and is a unique drug target
Zhou, X. Z., & Lu, K. P. (2016) · Nature reviews. Cancer · doi:10.1038/nrc.2016.49 · Cited by 275
Self-citationWei, S., Kozono, S., Kats, L., Nechama, M., Li, W., Guarnerio, J., Luo, M., You, M.-H., Yao, Y., Kondo, A., et al. (2015) · Nature Medicine · doi:10.1038/nm.3839 · Cited by 272
Self-citationNakamura, K., Greenwood, A., Binder, L. I., Bigio, E. H., Denial, S., Nicholson, L. K., Zhou, X. Z., & Lu, K. P. (2012) · Cell · doi:10.1016/j.cell.2012.02.016 · Cited by 260
Self-citationPIN1 Is an E2F Target Gene Essential for Neu/Ras-Induced Transformation of Mammary Epithelial Cells
Ryo, A., Liou, Y.-C., Wulf, G. M., Nakamura, M., Lee, S. W., & Lu, K. P. (2002) · Molecular and Cellular Biology · doi:10.1128/mcb.22.15.5281-5295.2002 · Cited by 254
Self-citationArsenic trioxide, a therapeutic agent for APL
Zhang, T.-D., Chen, G., Wang, Z., Wang, Z., Chen, S., & Chen, Z. (2001) · Oncogene · doi:10.1038/sj.onc.1204762 · Cited by 231
DeRose, Y. S., Gligorich, K. M., Wang, G., Georgelas, A., Bowman, P., Courdy, S., Welm, A. L., & Welm, B. E. (2013) · Current Protocols in Pharmacology · doi:10.1002/0471141755.ph1423s60 · Cited by 228
Connolly, R. M., Nguyen, N. K., & Sukumar, S. V. (2013) · Clinical Cancer Research · doi:10.1158/1078-0432.ccr-12-3175 · Cited by 217
Prolyl isomerase Pin1 in cancer
Lu, Z., & Hunter, T. R. (2014) · Cell Research · doi:10.1038/cr.2014.109 · Cited by 205
Posttranslational regulation of cyclin D1 by retinoic acid: A chemoprevention mechanism
Langenfeld, J. E., Kiyokawa, H., Sekula, D., Boyle, J., & Dmitrovsky, E. (1997) · Proceedings of the National Academy of Sciences · doi:10.1073/pnas.94.22.12070 · Cited by 202
Modeling breast cancer in vivo and ex vivo reveals an essential role of Pin1 in tumorigenesis
Wulf, G. M., Garg, P., Liou, Y., Iglehart, D., & Lu, K. P. (2004) · The EMBO Journal · doi:10.1038/sj.emboj.7600323 · Cited by 201
Self-citationProlyl‐isomerase Pin1 controls normal and cancer stem cells of the breast
Rustighi, A., Zannini, A., Tiberi, L., Sommaggio, R., Piazza, S., Sorrentino, G., Nuzzo, S., Tuscano, A., Eterno, V., Benvenuti, F., et al. (2013) · EMBO Molecular Medicine · doi:10.1002/emmm.201302909 · Cited by 161
A covalent PIN1 inhibitor selectively targets cancer cells by a dual mechanism of action
Campaner, E., Rustighi, A., Zannini, A., Cristiani, A., Piazza, S., Ciani, Y., Kalid, O., Golan, G., Baloglu, E., Shacham, S., et al. (2017) · Nature Communications · doi:10.1038/ncomms15772 · Cited by 155
Phase I and pharmacokinetic evaluation of all-trans-retinoic acid in pediatric patients with cancer.
Smith, M. A., Adamson, P. C., Balis, F. M., Feusner, J. H., Aronson, L., Murphy, R. F., Horowitz, M. E., Reaman, G. H., Hammond, G. D., & FENTON, R. M. (1992) · Journal of Clinical Oncology · doi:10.1200/jco.1992.10.11.1666 · Cited by 151
dos Santos, G. A., Kats, L. M., & Pandolfi, P. P. (2013) · The Journal of Experimental Medicine · doi:10.1084/jem.20131121 · Cited by 147
Min, S. H., Lau, A. W., Lee, T. H., Inuzuka, H., Wei, S., Huang, P., Shaik, S., Lee, D. Y., Finn, G., Balaštík, M., et al. (2012) · Molecular Cell · doi:10.1016/j.molcel.2012.04.012 · Cited by 146
Self-citationERK Activation Globally Downregulates miRNAs through Phosphorylating Exportin-5
Sun, H., Cui, R., Zhou, J., Teng, K., Hsiao, Y., Nakanishi, K., Fassan, M., Luo, Z., Shi, G., Tili, E., et al. (2016) · Cancer Cell · doi:10.1016/j.ccell.2016.10.001 · Cited by 143
Epidemiology of chronic disease related to arsenic in Argentina: A systematic review
Bardach, A. E., Ciapponi, A., Soto, N., Chaparro, M., Calderón, M., Briatore, A., Cadoppi, N., Tassara, R., & Litter, M. I. (2015) · The Science of The Total Environment · doi:10.1016/j.scitotenv.2015.08.070 · Cited by 140
Farrell, A. S., Pelz, C., Wang, X., Daniel, C. J., Wang, Z., Su, Y., Janghorban, M., Zhang, X., Morgan, C. W., Impey, S., et al. (2013) · Molecular and Cellular Biology · doi:10.1128/mcb.01455-12 · Cited by 140
Leung, J., Pang, A. W. K., Yuen, W.-H., Kwong, Y., & Tse, E. (2006) · Blood · doi:10.1182/blood-2006-04-019588 · Cited by 131
Arrieta, O. G., la Rosa, C. H. G.-D., Aréchaga-Ocampo, E., Villanueva-Rodríguez, G., Cerón-Lizárraga, T., Martínez-Barrera, L. M., Vázquez-Manríquez, M. E., Ríos-Trejo, M. Á., Álvarez-Avitia, M. Á., Hernández‐Pedro, N., et al. (2010) · Journal of Clinical Oncology · doi:10.1200/jco.2009.26.6452 · Cited by 128
Prolyl isomerase Pin1 as a molecular target for cancer diagnostics and therapeutics
Lu, K. P. (2003) · Cancer Cell · doi:10.1016/s1535-6108(03)00218-6 · Cited by 123
Self-citationSuizu, F., Ryo, A., Wulf, G. M., Lim, J., & Lu, K. P. (2006) · Molecular and Cellular Biology · doi:10.1128/mcb.26.4.1463-1479.2006 · Cited by 120
Self-citationFox, E., Razzouk, B. I., Widemann, B. C., Xiao, S., O'Brien, M., Goodspeed, W. J., Reaman, G. H., Blaney, S. M., Murgo, A. J., Balis, F. M., et al. (2007) · Blood · doi:10.1182/blood-2007-08-107839 · Cited by 119
Sheng, N., Xie, Z., Wang, C., Bai, G., Zhang, K., Zhu, Q., Song, J., Guillemot, F., Chen, Y., Lin, A., et al. (2010) · Proceedings of the National Academy of Sciences · doi:10.1073/pnas.1009244107 · Cited by 106
Self-citationPin1 inhibitors: Pitfalls, progress and cellular pharmacology
Moore, J. D., & Potter, A. J. (2013) · Bioorganic & Medicinal Chemistry Letters · doi:10.1016/j.bmcl.2013.05.088 · Cited by 105
Nakano, A., Koinuma, D., Miyazawa, K., Uchida, T., Saitoh, M., Kawabata, M., Hanai, J.-I., Akiyama, H., Abe, M., Miyazono, K., et al. (2009) · Journal of Biological Chemistry · doi:10.1074/jbc.m804659200 · Cited by 103
Liao, Y., Wei, Y., Zhou, X., Yang, J. Y., Dai, C., Chen, Y. J., Agarwal, N., Sarbassov, D. D., Shi, D., Yu, D., et al. (2009) · Oncogene · doi:10.1038/onc.2009.98 · Cited by 94
Self-citationThe Rab2A GTPase Promotes Breast Cancer Stem Cells and Tumorigenesis via Erk Signaling Activation
Luo, M., Gong, C., Chen, C.-H., Hu, H., Huang, P., Zheng, M., Yao, Y., Wei, S., Wulf, G. M., Lieberman, J., et al. (2015) · Cell Reports · doi:10.1016/j.celrep.2015.03.002 · Cited by 91
Self-citationLuo, M.-L., Gong, C., Chen, C.-H., Lee, D. Y., Hu, H., Huang, P., Yao, Y., Guo, W., Reinhardt, F., Wulf, G. M., et al. (2014) · Cancer Research · doi:10.1158/0008-5472.can-13-2785 · Cited by 87
Self-citationAblain, J., Leiva, M., Pérès, L., Fonsart, J., Anthony, E., & de Thé, H. (2013) · The Journal of Experimental Medicine · doi:10.1084/jem.20122337 · Cited by 87
Nechama, M., Kwon, J., Wei, S., Tun-Kyi, A., Welner, R. S., Ben‐Dov, I. Z., Arredouani, M. S., Asara, J. M., Chen, C.-H., Tsai, C.-Y., et al. (2018) · Nature Communications · doi:10.1038/s41467-018-03886-6 · Cited by 86
Self-citationPhase I/II trial of all-trans retinoic acid and tamoxifen in patients with advanced breast cancer.
Budd, G. T., Adamson, P. C., Gupta, M. K., Homayoun, P., Sandstrom, S. K., Murphy, R. F., McLain, D., Tuason, L. J., Peereboom, D. M., Bukowski, R. M., et al. (1998) · PubMed · Cited by 84
Arsenic compounds: revived ancient remedies in the fight against human malignancies
Liu, J., Zhou, G., Chen, S., & Zhu, C. H. (2012) · Current Opinion in Chemical Biology · doi:10.1016/j.cbpa.2012.01.015 · Cited by 78
Yang, D., Luo, W., Wang, J., Zheng, M., Liao, X., Zhang, N., Lu, W., Wang, L., Chen, A., Wu, W., et al. (2017) · Journal of Controlled Release · doi:10.1016/j.jconrel.2017.11.031 · Cited by 69
Self-citationTakahashi, K., Akiyama, H., Shimazaki, K. I., Uchida, C., Akiyama-Okunuki, H., Tomita, M., Fukumoto, M., & Uchida, T. (2006) · Oncogene · doi:10.1038/sj.onc.1210153 · Cited by 63
Paulo, J. A., Gaun, A., & Gygi, S. P. (2015) · Journal of Proteome Research · doi:10.1021/acs.jproteome.5b00398 · Cited by 59
NMR Methods for Studying Protein–Protein Interactions Involved in Translation Initiation
Marintchev, A., Frueh, D. P., & Wagner, G. (2007) · Methods in enzymology on CD-ROM/Methods in enzymology · doi:10.1016/s0076-6879(07)30012-8 · Cited by 57
Liao, X.-H., Zhang, A. L., Zheng, M., Li, M.-Q., Chen, C. P., Xu, H., Chu, Q., Yang, D., Lu, W., Tsai, T., et al. (2017) · Scientific Reports · doi:10.1038/srep43639 · Cited by 48
Self-citationRapid Reduction in Breast Cancer Mortality With Inorganic Arsenic in Drinking Water
Smith, A. H., Marshall, G., Yuan, Y., Steinmaus, C., Liaw, J., Smith, M. T., Wood, L., Heirich, M. S., Fritzemeier, R., Pegram, M. D., et al. (2014) · EBioMedicine · doi:10.1016/j.ebiom.2014.10.005 · Cited by 46
Pin1 is required for sustained B cell proliferation upon oncogenic activation of Myc
D’Artista, L., Bisso, A., Piontini, A., Doni, M., Verrecchia, A., Kress, T. R., Morelli, M. J., Sal, G. D., Amati, B. B., & Campaner, S. (2016) · Oncotarget · doi:10.18632/oncotarget.7846 · Cited by 40
Zheng, M., Xu, H., Liao, X., Chen, C. P., Zhang, A. L., Lu, W., Wang, L., Yang, D., Wang, J., Liu, H., et al. (2017) · Oncotarget · doi:10.18632/oncotarget.15967 · Cited by 40
Self-citationLian, X., Lin, Y., Kozono, S., Herbert, M. K., Li, X., Yuan, X., Guo, J., Guo, Y., Tang, M., Lin, J. L., et al. (2018) · Journal of Hematology & Oncology · doi:10.1186/s13045-018-0611-7 · Cited by 33
Self-citationPin1‐Targeted Therapy for Systemic Lupus Erythematosus
Wei, S., Yoshida, N., Finn, G., Kozono, S., Nechama, M., Kyttaris, V. C., Zhou, X. Z., Tsokos, G. C., & Lu, K. P. (2016) · Arthritis & Rheumatology · doi:10.1002/art.39741 · Cited by 31
Self-citationCribbes, S., Kessel, S. L., McMenemy, S., Qiu, J., & Chan, L. L. (2017) · SLAS DISCOVERY · doi:10.1177/2472555217689884 · Cited by 30
The Roles of the Unique Prolyl Isomerase Pin1 in Cancer-Related Viral and Bacterial Infections
Wang, J., Liao, X., Zheng, M., Yang, D., Zhou, X. Z. T., Liu, H.-H., & Lu, K. P. (2016) · Current Molecular Medicine · doi:10.2174/1566524016666161124103654 · Cited by 6
Self-citation
Cited by
Sorted by citations
Mutant p53 as a guardian of the cancer cell
Mantovani, F., Collavin, L., & Sal, G. D. (2018) · Cell Death and Differentiation · doi:10.1038/s41418-018-0246-9 · Cited by 820
Targeting Pin1 renders pancreatic cancer eradicable by synergizing with immunochemotherapy
Koikawa, K., Kibe, S., Suizu, F., Sekino, N., Kim, N., Manz, T. D., Pinch, B. J., Akshinthala, D., Verma, A., Gaglia, G., et al. (2021) · Cell · doi:10.1016/j.cell.2021.07.020 · Cited by 243
Self-citationSulfopin is a covalent inhibitor of Pin1 that blocks Myc-driven tumors in vivo
Dubiella, C., Pinch, B. J., Koikawa, K., Zaidman, D., Poon, E., Manz, T. D., Nabet, B., He, S., Resnick, E., Rogel, A., et al. (2021) · Nature Chemical Biology · doi:10.1038/s41589-021-00786-7 · Cited by 163
Self-citationChuang, L. I. U., Sun, S., Feng, Q., Wu, G., Wu, Y., Kong, N., Yu, Z., Yao, J., Zhang, X., Chen, W., et al. (2021) · Advanced Materials · doi:10.1002/adma.202102054 · Cited by 147
Role of Hedgehog Signaling in Breast Cancer: Pathogenesis and Therapeutics
Galdo, N. A. R., Montero, Á. L., & Wertheimer, E. V. (2019) · Cells · doi:10.3390/cells8040375 · Cited by 145
Metadata
- Authors
- Kozono, S., Lin, Y.-M., Seo, H.-S., Pinch, B., Lian, X., Qiu, C., Herbert, M. K., Chen, C.-H., Tan, L., Gao, Z. J., Massefski, W., Doctor, Z. M., Jackson, B. P., Chen, Y., Dhe-Paganon, S., Lu, K. P., & Zhou, X. Z.
- Affiliations
- Beth Israel Deaconess Medical Center (US)
- Dana-Farber Cancer Institute (US)
- Harvard University (US)
- Fujian Medical University (CN)
- Broad Institute (US)
- Dartmouth College (US)
- Corresponding author
- Lu, Kun Ping
- Zhou, Xiao Zhen
- ORCID
- Venue
- Nature Communications
- Published
- 2018-08-09
- Volume
- 9
- Issue
- 1
- Pages
- 3069-3069
- ISSN
- 2041-1723 (ISSN-L)
- PMC
- PMC6085299
- OpenAlex
- W2886147882
- Cited by
- 168
- References
- 82
- Citations by year
- 2026: 8 · 2025: 16 · 2024: 23 · 2023: 28 · 2022: 20 · 2021: 22 · 2020: 28 · 2019: 18 · 2018: 5
- FWCI
- 6.49
- Type
- journal article
- Language
- en
- Open access
- gold
- doi.org
- Locations
- Nature Communications (publishedVersion, cc-by)
- Europe PMC (PubMed Central) (publishedVersion, other-oa)
- PubMed Central (publishedVersion, cc-by)
- PubMed (publishedVersion)
- RePEc: Research Papers in Economics (submittedVersion)
- DOAJ (DOAJ: Directory of Open Access Journals) (submittedVersion, cc-by-sa)
- DOAJ (DOAJ: Directory of Open Access Journals) (submittedVersion)
- Funders
- U.S. Department of Health & Human Services | National Institutes of Health (R01CA167677, R01CA205153)
- Topics
- Life Sciences › Biochemistry, Genetics and Molecular Biology › Molecular Biology › Signaling Pathways in Disease
- Life Sciences › Biochemistry, Genetics and Molecular Biology › Molecular Biology › Retinoids in leukemia and cellular processes
- Health Sciences › Medicine › Oncology › Cancer-related Molecular Pathways
- Keywords
- arsenic trioxide, all-trans retinoic acid, Pin1, isomerase, drug synergy, AQP9, triple-negative breast cancer, cancer stem cells, acute promyelocytic leukemia, protein degradation, microRNA, patient-derived xenografts
- MeSH terms
- NIMA-Interacting Peptidylprolyl Isomerase, Arsenic Trioxide, Animals, Antineoplastic Agents, Female, Fibroblasts, Humans, Mice, Inbred BALB C, Neoplasm Transplantation, Neoplasms, Magnetic Resonance Spectroscopy, Tretinoin, Signal Transduction, Leukemia, Promyelocytic, Acute, Gene Expression Regulation, Neoplastic, Mice, Knockout, Gene Expression Profiling, Proteomics, Cell Proliferation, Mice
About these checks
Registry, retraction, Cites and statistics results are computed, not judged, with one exception: a printed reference that no index lists is read once by a model before it counts as a citation error. Claims are extracted by a model and kept only when their quote appears verbatim in the text; each cited source is then checked, with a model’s help, for whether it says what the claim relies on. Those verdicts can be wrong — read the claim’s quote and the cited source before relying on one.
Statistics and arithmetic are recomputed, not judged.
Confidence bands are shown only for fields calibrated on our annotated test set. None is calibrated yet, so no band is shown.
What counts as a claim ›How we measure confidence ›How we check this ›
Are you an author, or do you see a problem with this page? Request a review
