

The DOI matches its Crossref record; 78 of the 78 references it cites were found in a registry or an index; 3 of the 71 sources its claims cite were checked for support.
Large-scale proteomic analysis of human brain identifies proteins associated with cognitive trajectory in advanced age
Open accessPublished version of a preprint
Abstract
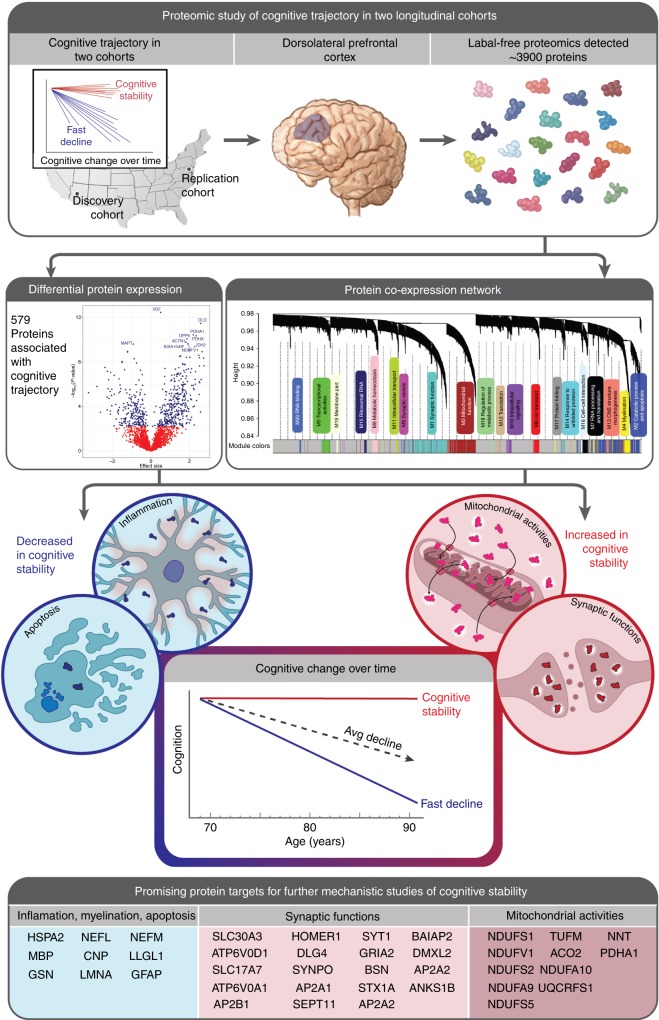
In advanced age, some individuals maintain a stable cognitive trajectory while others experience a rapid decline. Such variation in cognitive trajectory is only partially explained by traditional neurodegenerative pathologies. Hence, to identify new processes underlying variation in cognitive trajectory, we perform an unbiased proteome-wide association study of cognitive trajectory in a discovery ( n = 104) and replication cohort ( n = 39) of initially cognitively unimpaired, longitudinally assessed older-adult brain donors. We find 579 proteins associated with cognitive trajectory after meta-analysis. Notably, we present evidence for increased neuronal mitochondrial activities in cognitive stability regardless of the burden of traditional neuropathologies. Furthermore, we provide additional evidence for increased synaptic abundance and decreased inflammation and apoptosis in cognitive stability. Importantly, we nominate proteins associated with cognitive trajectory, particularly the 38 proteins that act independently of neuropathologies and are also hub proteins of protein co-expression networks, as promising targets for future mechanistic studies of cognitive trajectory.
Overview
AI snapshot
Written from the paper’s full text.
TL;DR
This study performed an unbiased proteome-wide association study of cognitive trajectory in discovery (n = 104) and replication (n = 39) cohorts of initially cognitively unimpaired older-adult brain donors. Meta-analysis identified 579 proteins associated with cognitive trajectory, with cognitive stability linked to increased neuronal mitochondrial and synaptic proteins and decreased inflammation/apoptosis proteins.
Key findings
- Meta-analysis found 579 proteins associated with cognitive trajectory at FDR < 0.05 among 2,752 protein isoforms detected in both cohorts; 350 had increased abundance and 229 had decreased abundance in cognitive stability.
- Higher-abundance proteins in cognitive stability were enriched for mitochondrial function and synaptic transmission, and for neurons; lower-abundance proteins were enriched for inflammatory response, apoptosis, endothelial function, and RNA processing, and for oligodendrocyte, astrocyte, and microglia.
- After adjusting for β-amyloid plaques and neurofibrillary tangles, 232 proteins remained associated with cognitive trajectory; higher-abundance proteins were still enriched for mitochondrial activities and synaptic transmission, while lower-abundance proteins changed to processes including glycolysis and neurofilament bundle assembly.
- 38 proteins were associated with cognitive trajectory independently of β-amyloid plaques and neurofibrillary tangles and were hub proteins in both cohorts; the top protein was DLG4/PSD95, and the first principal component of the PSD95 interactome was associated with cognitive trajectory (β = 0.016; p = 0.0001; N = 104).
Methods
- Discovery cohort: Banner Sun Health Research Institute participants (n = 104), non-demented at baseline, followed up to 14 years; replication cohort: Baltimore Longitudinal Study of Aging participants (n = 39), followed up to 20 years. Dorsolateral prefrontal cortex was analyzed by label-free proteomics; 3,710 proteins in Banner and 3,933 in BLSA were detected with 10% or fewer missing values, with 2,752 isoforms common to both.
- Person-specific cognitive trajectory was estimated using a linear mixed model of annual MMSE score with random intercept and random slope per subject. Proteome-wide association used linear regression per cohort followed by METAL meta-analysis, adjusting for sex, age at enrollment, education, age at death, PMI, and batch; a secondary analysis additionally adjusted for β-amyloid plaques and neurofibrillary tangles.
- Protein co-expression networks were constructed with WGCNA in Banner, and published BLSA networks were used; hub proteins were defined as those with intramodular kME in the top 90th percentile. GO and brain cell-type enrichment used Fisher’s exact test with FDR correction.
Limitations
- The paper states that this is an association study and precludes causal inference; label-free proteomics yielded approximately 3,900 proteins, which is not as comprehensive as ideal; MMSE is a coarse screening tool; and sample sizes were relatively small (n = 104 and n = 39) and exclusively Caucasian, limiting generalizability and power.
- The paper notes that BLSA protein co-expression modules were previously built using dorsolateral prefrontal cortex and precuneus, so module memberships might differ from those based on dorsolateral prefrontal cortex alone.
- The paper notes that in BLSA only one module remained significantly associated with cognitive trajectory after multiple testing adjustment, likely due to small sample size and lower power.
Model-written summary. Check it against the paper before relying on it.
Integrity signals
Registry
Cites
Statistics
Figures
Verification
Claims the paper makes
71 Own result · 49 Not checked yet · 19 Own interpretation · 12 Own method · 1 Partly supported · 1 Couldn’t confirm · 1 No basis given · accuracy not yet measured
The cited sources support only part of this claim — read each source’s verdict below.
In the paper
“However, pathologies such as β-amyloid plaques, neurofibrillary tangles, microinfarct, macroinfarct, and Lewy bodies together capture only about 41% of the variance in cognitive trajectory, leaving 59% unexplained5,7.”
§ Large-scale proteomic analysis of human brain identifies proteins associated with cognitive trajectory in advanced age > Introduction
What the sources say
- Partly supportedcites [5] Boyle, P. A. et al. Person-specific contribution of neuropathologies to cognitive loss in old age. Ann. Neurol. 83, 74–83 (2018). sourceExperimental — accuracy not yet measured
The Discussion states that common age-related neuropathologies together account for less than half of the between-person variability in cognitive decline, leaving considerable variability unexplained. It does not give the claimed 41% explained or 59% unexplained figures; its separate 41% result concerns the average contribution of Lewy bodies to cognitive loss when present, not variance in cognitive trajectory. (LLM, conf=0.85)
- Supportedcites [7] Boyle, P. A. et al. Much of late life cognitive decline is not due to common neurodegenerative pathologies. Ann. Neurol. 74, 10.1002/ana.23964 (2013). source
The Results section lists amyloid, tangles, macroscopic infarcts, microinfarcts, and neocortical Lewy bodies among the indices analyzed together. It reports that the combined indices accounted for 41% of the variation in cognitive decline, leaving 59% unexplained. (LLM, conf=0.95)
plaincorrelational- Asserted: passes — The authors put it forward as true.
- Checkable: passes — It can be checked against evidence.
- Load-bearing: passes — The paper’s conclusions depend on it.
- Based: passes — The paper gives a reason why it holds.
- Partly supported
The cited sources that could be checked couldn’t confirm or dispute this claim.
In the paper
“Of note, our group previously performed a detailed co-expression network analysis for the BLSA cohort and identified 16 networks of co-expressed proteins23.”
§ Large-scale proteomic analysis of human brain identifies proteins associated with cognitive trajectory in advanced age > Results > Protein co-expression network construction
What the sources say
- Could not verifycites [23] Wingo, T. S. et al. Integrating next-generation genomic sequencing and mass spectrometry to estimate allele-specific protein abundance in human brain. J. Proteome. Res. 16, 3336–3347 (2017). sourceExperimental — accuracy not yet measured
The Abstract and Introduction describe allele-specific protein abundance analysis, not a BLSA co-expression network analysis. Searches for BLSA and 16 co-expressed protein networks found no passage reporting the claimed result; the References list a related co-expression paper but do not state this finding. (LLM, conf=0.76)
plain- Asserted: passes — The authors put it forward as true.
- Checkable: passes — It can be checked against evidence.
- Load-bearing: passes — The paper’s conclusions depend on it.
- Based: passes — The paper gives a reason why it holds.
- Could not verify
A result the paper reports from its own data — it cites no other source for it, so there is none to check. The quote shows it is in the paper.
In the paper
“Interestingly, mitochondrial proteins were featured prominently among cognitive trajectory-associated proteins, and more findings about mitochondrial proteins are followed.”
§ Large-scale proteomic analysis of human brain identifies proteins associated with cognitive trajectory in advanced age > Results > Proteome-wide association study of cognitive trajectory
plaincorrelational- Asserted: passes — The authors put it forward as true.
- Checkable: passes — It can be checked against evidence.
- Load-bearing: unclear — It is unclear whether the paper’s conclusions depend on it.
- Based: passes — The paper gives a reason why it holds.
A result the paper reports from its own data — it cites no other source for it, so there is none to check. The quote shows it is in the paper.
In the paper
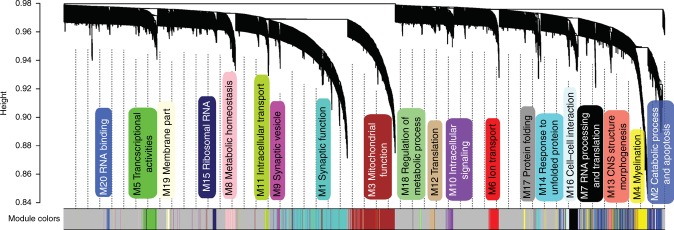
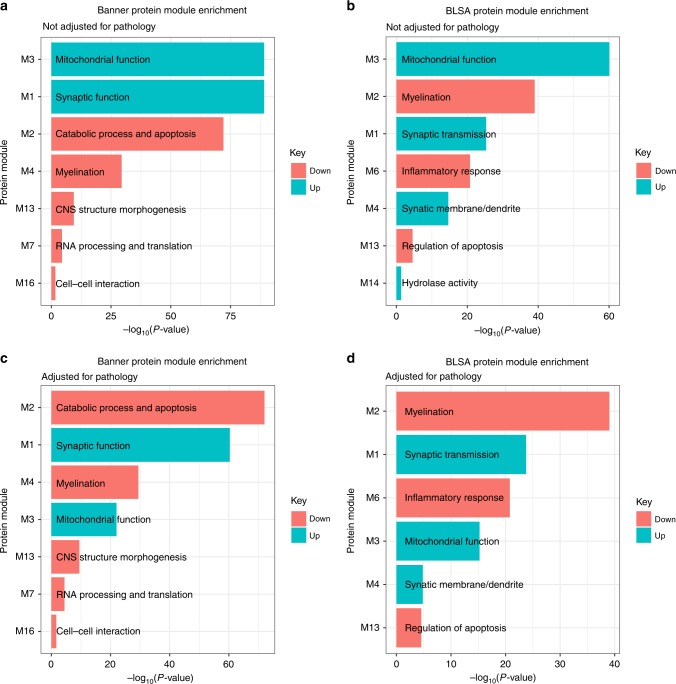
“The higher-abundance proteins in cognitive stability were enriched in modules involved in synaptic function (Banner M1, BLSA M1, and M4) and mitochondrial function (Banner M3 and BLSA M3) in both cohorts at adjusted p < 0.05 by Fisher’s exact test (Fig. 5a).”
§ Large-scale proteomic analysis of human brain identifies proteins associated with cognitive trajectory in advanced age > Results > Cognitive trajectory proteins and protein networks
plaincorrelational- Asserted: passes — The authors put it forward as true.
- Checkable: passes — It can be checked against evidence.
- Load-bearing: passes — The paper’s conclusions depend on it.
- Based: passes — The paper gives a reason why it holds.
A result the paper reports from its own data — it cites no other source for it, so there is none to check. The quote shows it is in the paper.
In the paper
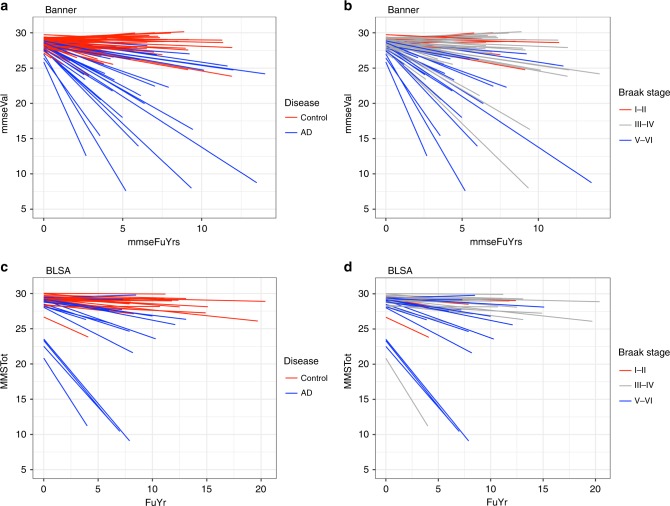
“These data reveal that (i) cognitive trajectory varied within a given clinical diagnosis or Braak stage;”
§ Large-scale proteomic analysis of human brain identifies proteins associated with cognitive trajectory in advanced age > Results > Personalized cognitive trajectories
plaincorrelational- Asserted: passes — The authors put it forward as true.
- Checkable: passes — It can be checked against evidence.
- Load-bearing: passes — The paper’s conclusions depend on it.
- Based: passes — The paper gives a reason why it holds.
A result the paper reports from its own data — it cites no other source for it, so there is none to check. The quote shows it is in the paper.
In the paper
“and between cognitive trajectory and Braak stage was −0.39 (95% CI of −0.51 to −0.24, p-value of 1.5 × 10⁻⁶).”
§ Large-scale proteomic analysis of human brain identifies proteins associated with cognitive trajectory in advanced age > Results > Personalized cognitive trajectories
plaincorrelational- Asserted: passes — The authors put it forward as true.
- Checkable: passes — It can be checked against evidence.
- Load-bearing: passes — The paper’s conclusions depend on it.
- Based: passes — The paper gives a reason why it holds.
A result the paper reports from its own data — it cites no other source for it, so there is none to check. The quote shows it is in the paper.
In the paper
“The higher-abundance proteins were strongly enriched for neurons and mildly enriched for astrocytes at adjusted p-value < 0.05 by Fisher’s exact test (Table 2, Supplementary Data 4).”
§ Large-scale proteomic analysis of human brain identifies proteins associated with cognitive trajectory in advanced age > Results > Enrichment analysis of cognitive trajectory proteins
boostedcorrelational- Asserted: passes — The authors put it forward as true.
- Checkable: passes — It can be checked against evidence.
- Load-bearing: passes — The paper’s conclusions depend on it.
- Based: passes — The paper gives a reason why it holds.
A result the paper reports from its own data — it cites no other source for it, so there is none to check. The quote shows it is in the paper.
In the paper
“The lower-abundance proteins in cognitive stability were significantly enriched for signatures of oligodendrocyte, astrocyte, and microglia after multiple testing correction (Table 2, Supplementary Data 4).”
§ Large-scale proteomic analysis of human brain identifies proteins associated with cognitive trajectory in advanced age > Results > Enrichment analysis of cognitive trajectory proteins
plaincorrelational- Asserted: passes — The authors put it forward as true.
- Checkable: passes — It can be checked against evidence.
- Load-bearing: passes — The paper’s conclusions depend on it.
- Based: passes — The paper gives a reason why it holds.
A result the paper reports from its own data — it cites no other source for it, so there is none to check. The quote shows it is in the paper.
In the paper
“The lower-abundance proteins were enriched for inflammatory response, apoptosis, endothelial function, and RNA processing at adjusted p-value < 0.05 by Fisher’s exact test (Table 2, Supplementary Data 4).”
§ Large-scale proteomic analysis of human brain identifies proteins associated with cognitive trajectory in advanced age > Results > Enrichment analysis of cognitive trajectory proteins
plaincorrelational- Asserted: passes — The authors put it forward as true.
- Checkable: passes — It can be checked against evidence.
- Load-bearing: passes — The paper’s conclusions depend on it.
- Based: passes — The paper gives a reason why it holds.
A result the paper reports from its own data — it cites no other source for it, so there is none to check. The quote shows it is in the paper.
In the paper
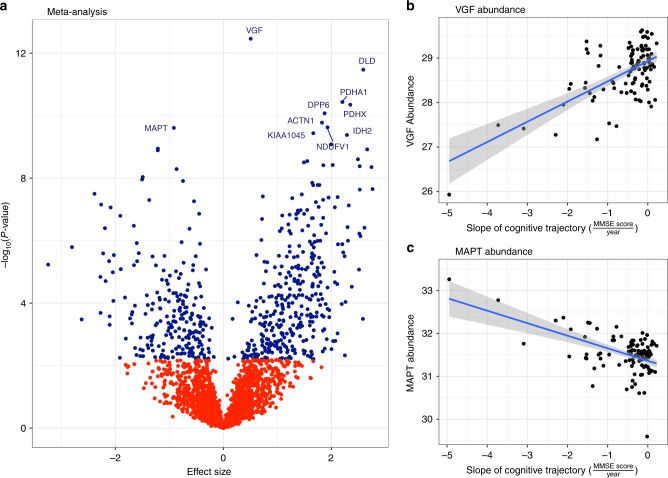
“For instance, VGF protein had increased abundance and MAPT protein had decreased abundance in cognitive stability (Fig. 3b, c).”
§ Large-scale proteomic analysis of human brain identifies proteins associated with cognitive trajectory in advanced age > Results > Proteome-wide association study of cognitive trajectory
plaincorrelationaln = 143- Asserted: passes — The authors put it forward as true.
- Checkable: passes — It can be checked against evidence.
- Load-bearing: unclear — It is unclear whether the paper’s conclusions depend on it.
- Based: passes — The paper gives a reason why it holds.
- Probably not a substantial claim. 51
- It may state two separate claims as one. 51
A result the paper reports from its own data — it cites no other source for it, so there is none to check. The quote shows it is in the paper.
In the paper
“For instance, of the 157 proteins designated as mitochondrial, 112 were presynaptic, 10 postsynaptic, and 35 were other (Supplementary Data 3).”
§ Large-scale proteomic analysis of human brain identifies proteins associated with cognitive trajectory in advanced age > Results > Proteome-wide association study of cognitive trajectory
plain- Asserted: passes — The authors put it forward as true.
- Checkable: passes — It can be checked against evidence.
- Load-bearing: fails — The paper’s conclusions may not depend on it.
- Based: passes — The paper gives a reason why it holds.
Probably not a substantial claim. The paper’s conclusions may not depend on it.
A result the paper reports from its own data — it cites no other source for it, so there is none to check. The quote shows it is in the paper.
In the paper
“For the 569 unique proteins, 484 had at least one PPI, and there were a total of 2587 PPIs among these 484 proteins (Supplementary Data 3; Supplementary Fig. 4).”
§ Large-scale proteomic analysis of human brain identifies proteins associated with cognitive trajectory in advanced age > Results > Proteome-wide association study of cognitive trajectory
plain- Asserted: passes — The authors put it forward as true.
- Checkable: passes — It can be checked against evidence.
- Load-bearing: unclear — It is unclear whether the paper’s conclusions depend on it.
- Based: passes — The paper gives a reason why it holds.
It may state two separate claims as one.
A result the paper reports from its own data — it cites no other source for it, so there is none to check. The quote shows it is in the paper.
In the paper
“Regarding the direction of association, 350 proteins had increased abundance while 229 had decreased abundance in cognitive stability.”
§ Large-scale proteomic analysis of human brain identifies proteins associated with cognitive trajectory in advanced age > Results > Proteome-wide association study of cognitive trajectory
plaincorrelationaln = 143- Asserted: passes — The authors put it forward as true.
- Checkable: passes — It can be checked against evidence.
- Load-bearing: unclear — It is unclear whether the paper’s conclusions depend on it.
- Based: passes — The paper gives a reason why it holds.
It may state two separate claims as one.
None of the sources cited for this claim have been checked yet.
In the paper
“The 569 unique proteins among these 579 proteins (10 had isoforms) were categorized into presynaptic (N = 159), postsynaptic (N = 150), both (present in both presynaptic and postsynaptic density; N = 20), or other (N = 240) using Boyken et. al. presynaptic list16 and Bayes et. al. postsynaptic density list17 (Supplementary Data 3).”
§ Large-scale proteomic analysis of human brain identifies proteins associated with cognitive trajectory in advanced age > Results > Proteome-wide association study of cognitive trajectory
What the sources say
- Not checked yetcites [16] Boyken, J. et al. Molecular profiling of synaptic vesicle docking sites reveals novel proteins but few differences between glutamatergic and GABAergic synapses. Neuron 78, 285–297 (2013). source
- Not checked yetcites [17] Bayes, A. et al. Characterization of the proteome, diseases and evolution of the human postsynaptic density. Nat. Neurosci. 14, 19–21 (2011). source
plain- Asserted: passes — The authors put it forward as true.
- Checkable: passes — It can be checked against evidence.
- Load-bearing: fails — The paper’s conclusions may not depend on it.
- Based: passes — The paper gives a reason why it holds.
Probably not a substantial claim. The paper’s conclusions may not depend on it.
A result the paper reports from its own data — it cites no other source for it, so there is none to check. The quote shows it is in the paper.
In the paper
“The median rate of cognitive change was −0.3 unit of MMSE score per year for Banner participants and −0.1 unit of MMSE per year for BLSA participants (Table 1).”
§ Large-scale proteomic analysis of human brain identifies proteins associated with cognitive trajectory in advanced age > Results > Personalized cognitive trajectories
plain- Asserted: passes — The authors put it forward as true.
- Checkable: passes — It can be checked against evidence.
- Load-bearing: unclear — It is unclear whether the paper’s conclusions depend on it.
- Based: passes — The paper gives a reason why it holds.
It may state two separate claims as one.
A result the paper reports from its own data — it cites no other source for it, so there is none to check. The quote shows it is in the paper.
In the paper
“The meta-analysis showed 579 proteins associated with cognitive trajectory in the same directions in both the discovery and replication cohorts and at FDR < 0.05 among the 2752 protein isoforms commonly detected in both cohorts (N = 143 individuals; Fig. 3a, Supplementary Data 2).”
- Also stated in: § Abstract · plain
“We find 579 proteins associated with cognitive trajectory after meta-analysis.”
§ Large-scale proteomic analysis of human brain identifies proteins associated with cognitive trajectory in advanced age > Results > Proteome-wide association study of cognitive trajectory
plaincorrelationaln = 143- Asserted: passes — The authors put it forward as true.
- Checkable: passes — It can be checked against evidence.
- Load-bearing: passes — The paper’s conclusions depend on it.
- Based: passes — The paper gives a reason why it holds.
It may state two separate claims as one.
- Also stated in: § Abstract · plain
A result the paper reports from its own data — it cites no other source for it, so there is none to check. The quote shows it is in the paper.
In the paper
“Focusing on PPIs emanating from presynaptic proteins, we found 374 proteins with interactions (nodes) and 1745 PPIs (edges) (Supplementary Fig. 5A).”
§ Large-scale proteomic analysis of human brain identifies proteins associated with cognitive trajectory in advanced age > Results > Proteome-wide association study of cognitive trajectory
plain- Asserted: passes — The authors put it forward as true.
- Checkable: passes — It can be checked against evidence.
- Load-bearing: unclear — It is unclear whether the paper’s conclusions depend on it.
- Based: passes — The paper gives a reason why it holds.
It may state two separate claims as one.
A result the paper reports from its own data — it cites no other source for it, so there is none to check. The quote shows it is in the paper.
In the paper
“Lower-abundance proteins were enriched for the processes of glycolysis, assembly of neurofilament bundle, cell–cell adhesion, and RNA binding, and for oligodendrocyte, astrocyte, and microglia (Table 3; Supplementary Data 6).”
§ Large-scale proteomic analysis of human brain identifies proteins associated with cognitive trajectory in advanced age > Results > Proteins in cognitive trajectory adjusted for neuropathology
plaincorrelational- Asserted: passes — The authors put it forward as true.
- Checkable: passes — It can be checked against evidence.
- Load-bearing: passes — The paper’s conclusions depend on it.
- Based: passes — The paper gives a reason why it holds.
It may state two separate claims as one.
A result the paper reports from its own data — it cites no other source for it, so there is none to check. The quote shows it is in the paper.
In the paper
“In Banner, these seven modules had 123 hub proteins, of which 102 (83%) were associated with cognitive trajectory (Supplementary Data 8).”
§ Large-scale proteomic analysis of human brain identifies proteins associated with cognitive trajectory in advanced age > Results > Cognitive trajectory-associated proteins and hub proteins
plaincorrelational- Asserted: passes — The authors put it forward as true.
- Checkable: passes — It can be checked against evidence.
- Load-bearing: passes — The paper’s conclusions depend on it.
- Based: passes — The paper gives a reason why it holds.
It may state two separate claims as one.
A result the paper reports from its own data — it cites no other source for it, so there is none to check. The quote shows it is in the paper.
In the paper
“After adjusting for β-amyloid plaques and neurofibrillary tangles, there were 232 cognitive trajectory-associated proteins, and enrichment was performed separately for lower-abundance proteins in cognitive stability (81 proteins, colored in salmon) and higher-abundance proteins in cognitive stability (151 proteins, colored in turquoise), respectively.”
§ Large-scale proteomic analysis of human brain identifies proteins associated with cognitive trajectory in advanced age > Results > Cognitive trajectory proteins and protein networks
plaincorrelational- Asserted: passes — The authors put it forward as true.
- Checkable: passes — It can be checked against evidence.
- Load-bearing: passes — The paper’s conclusions depend on it.
- Based: passes — The paper gives a reason why it holds.
It may state two separate claims as one.
A result the paper reports from its own data — it cites no other source for it, so there is none to check. The quote shows it is in the paper.
In the paper
“Notably, these 38 proteins were associated with cognitive trajectory independently of β-amyloid plaques and neurofibrillary tangles in both Banner and BLSA, and were also hub”
- Also stated in: § Discussion · plain
“The next notable finding is the 38 proteins that were associated with cognitive trajectory independently of typical AD neuropathologies and were also hub proteins in both Banner and BLSA protein networks.”
§ Large-scale proteomic analysis of human brain identifies proteins associated with cognitive trajectory in advanced age > Results > Cognitive trajectory-associated proteins and hub proteins
plaincorrelational- Asserted: passes — The authors put it forward as true.
- Checkable: passes — It can be checked against evidence.
- Load-bearing: passes — The paper’s conclusions depend on it.
- Based: passes — The paper gives a reason why it holds.
It may state two separate claims as one.
- Also stated in: § Discussion · plain
A result the paper reports from its own data — it cites no other source for it, so there is none to check. The quote shows it is in the paper.
In the paper
“There are 579 cognitive trajectory-associated proteins in Banner and BLSA cohorts, which were divided into lower-abundance proteins in cognitive stability (229 proteins, colored in salmon) and higher-abundance proteins in cognitive stability (350 proteins, colored in turquoise), respectively.”
§ Large-scale proteomic analysis of human brain identifies proteins associated with cognitive trajectory in advanced age > Results > Cognitive trajectory proteins and protein networks
plaincorrelational- Asserted: passes — The authors put it forward as true.
- Checkable: passes — It can be checked against evidence.
- Load-bearing: passes — The paper’s conclusions depend on it.
- Based: passes — The paper gives a reason why it holds.
It may state two separate claims as one.
A result the paper reports from its own data — it cites no other source for it, so there is none to check. The quote shows it is in the paper.
In the paper
“particularly the 38 proteins that act independently of neuropathologies and are also hub proteins of protein co-expression networks”
§ Large-scale proteomic analysis of human brain identifies proteins associated with cognitive trajectory in advanced age > Abstract
plaincorrelational- Asserted: passes — The authors put it forward as true.
- Checkable: passes — It can be checked against evidence.
- Load-bearing: passes — The paper’s conclusions depend on it.
- Based: passes — The paper gives a reason why it holds.
It may state two separate claims as one.
A result the paper reports from its own data — it cites no other source for it, so there is none to check. The quote shows it is in the paper.
In the paper
“This is consistent with our finding that 157 proteins of the 579 cognitive trajectory-associated proteins are mitochondrial proteins and of these, 122 are located in the mitochondria either in the pre- or postsynaptic density.”
§ Large-scale proteomic analysis of human brain identifies proteins associated with cognitive trajectory in advanced age > Discussion
plaincorrelational- Asserted: passes — The authors put it forward as true.
- Checkable: passes — It can be checked against evidence.
- Load-bearing: passes — The paper’s conclusions depend on it.
- Based: passes — The paper gives a reason why it holds.
It may state two separate claims as one.
A result the paper reports from its own data — it cites no other source for it, so there is none to check. The quote shows it is in the paper.
In the paper
“Among these proteins, only GRIA3 was detected in our datasets and had lower-abundance in faster cognitive decline in both Banner and BLSA, consistent with Bereczki and colleagues’ finding.”
§ Large-scale proteomic analysis of human brain identifies proteins associated with cognitive trajectory in advanced age > Discussion
plaincorrelational- Asserted: passes — The authors put it forward as true.
- Checkable: passes — It can be checked against evidence.
- Load-bearing: unclear — It is unclear whether the paper’s conclusions depend on it.
- Based: passes — The paper gives a reason why it holds.
It may state two separate claims as one.
A result the paper reports from its own data — it cites no other source for it, so there is none to check. The quote shows it is in the paper.
In the paper
“Among these 38 proteins, those that are higher-abundance in cognitive stability are involved in either mitochondrial activities or synaptic function, and those with lower-abundance in cognitive stability are involved in myelination or apoptosis.”
§ Large-scale proteomic analysis of human brain identifies proteins associated with cognitive trajectory in advanced age > Discussion
plaincorrelational- Asserted: passes — The authors put it forward as true.
- Checkable: passes — It can be checked against evidence.
- Load-bearing: passes — The paper’s conclusions depend on it.
- Based: passes — The paper gives a reason why it holds.
It may state two separate claims as one.
A result the paper reports from its own data — it cites no other source for it, so there is none to check. The quote shows it is in the paper.
In the paper
“After label-free quantification, 3710 protein groups in Banner and 3933 protein groups in BLSA cohorts were detected, and 2752 protein isoforms were detected in both Banner and BLSA cohorts.”
§ Large-scale proteomic analysis of human brain identifies proteins associated with cognitive trajectory in advanced age > Methods > Proteomic measurements
plain- Asserted: passes — The authors put it forward as true.
- Checkable: passes — It can be checked against evidence.
- Load-bearing: unclear — It is unclear whether the paper’s conclusions depend on it.
- Based: passes — The paper gives a reason why it holds.
It may state two separate claims as one.
A result the paper reports from its own data — it cites no other source for it, so there is none to check. The quote shows it is in the paper.
In the paper
“For instance, in the Banner cohort, batch and sex explained substantial proportions while age at death and PMI explained some proportions of variance of the proteomic profile (Supplementary Fig. 2).”
§ Large-scale proteomic analysis of human brain identifies proteins associated with cognitive trajectory in advanced age > Methods > Proteomic quality control
plaincorrelational- Asserted: passes — The authors put it forward as true.
- Checkable: passes — It can be checked against evidence.
- Load-bearing: passes — The paper’s conclusions depend on it.
- Based: passes — The paper gives a reason why it holds.
It may state two separate claims as one.
None of the sources cited for this claim have been checked yet.
In the paper
“A stable cognitive trajectory in advanced age is desirable and may reflect cognitive resilience, while decline in cognitive performance may be the earliest manifestation of a serious neurodegenerative disease1,3.”
§ Large-scale proteomic analysis of human brain identifies proteins associated with cognitive trajectory in advanced age > Introduction
What the sources say
- Not checked yetcites [1] Zaninotto, P., Batty, G. D., Allerhand, M. & Deary, I. J. Cognitive function trajectories and their determinants in older people: 8 years of follow-up in the English Longitudinal Study of Ageing. J. Epidemio.l Community Health 72, 685–694 (2018). source
- Not checked yetcites [3] Rajan, K. B., Wilson, R. S., Weuve, J., Barnes, L. L. & Evans, D. A. Cognitive impairment 18 years before clinical diagnosis of Alzheimer disease dementia. Neurology 85, 898–904 (2015). source
hedgedconditional- Asserted: passes — The authors put it forward as true.
- Checkable: passes — It can be checked against evidence.
- Load-bearing: passes — The paper’s conclusions depend on it.
- Based: passes — The paper gives a reason why it holds.
Probably not a substantial claim. It may state two separate claims as one.
None of the sources cited for this claim have been checked yet.
In the paper
“Like all complex human traits, cognitive trajectory varies from person to person and is determined by a combination of genetic and environmental factors including premorbid cognitive abilities, educational attainment, lifestyle choices, and environmental exposures1,2.”
§ Large-scale proteomic analysis of human brain identifies proteins associated with cognitive trajectory in advanced age > Introduction
What the sources say
- Not checked yetcites [1] Zaninotto, P., Batty, G. D., Allerhand, M. & Deary, I. J. Cognitive function trajectories and their determinants in older people: 8 years of follow-up in the English Longitudinal Study of Ageing. J. Epidemio.l Community Health 72, 685–694 (2018). source
- Not checked yetcites [2] Plassman, B. L., Williams, J. W. Jr., Burke, J. R., Holsinger, T. & Benjamin, S. Systematic review: factors associated with risk for and possible prevention of cognitive decline in later life. Ann. Intern. Med. 153, 182–193 (2010). source
plaindirect- Asserted: passes — The authors put it forward as true.
- Checkable: passes — It can be checked against evidence.
- Load-bearing: fails — The paper’s conclusions may not depend on it.
- Based: passes — The paper gives a reason why it holds.
Probably not a substantial claim. The paper’s conclusions may not depend on it. It may state two separate claims as one.
A conclusion the paper draws from its own results — it cites no other source for it, so there is none to check. The quote shows it is in the paper.
In the paper
“Hence, variation in cognitive trajectory can influence onset age for MCI or dementia.”
§ Large-scale proteomic analysis of human brain identifies proteins associated with cognitive trajectory in advanced age > Introduction
plainconditional- Asserted: passes — The authors put it forward as true.
- Checkable: passes — It can be checked against evidence.
- Load-bearing: passes — The paper’s conclusions depend on it.
- Based: passes — The paper gives a reason why it holds.
Probably not a substantial claim.
In the paper
“and aggregation of hyperphosphorylated tau proteins can lead to the formation of neurofibrillary tangles and Alzheimer’s dementia14.”
§ Large-scale proteomic analysis of human brain identifies proteins associated with cognitive trajectory in advanced age > Results > Proteome-wide association study of cognitive trajectory
What the sources say
- Not checked yetcites [14] Ballatore, C., Lee, V. M. & Trojanowski, J. Q. Tau-mediated neurodegeneration in Alzheimer's disease and related disorders. Nat. Rev. Neurosci. 8, 663–672 (2007). source
plaindirect- Asserted: passes — The authors put it forward as true.
- Checkable: passes — It can be checked against evidence.
- Load-bearing: fails — The paper’s conclusions may not depend on it.
- Based: passes — The paper gives a reason why it holds.
Probably not a substantial claim. The paper’s conclusions may not depend on it.
A conclusion the paper draws from its own results — it cites no other source for it, so there is none to check. The quote shows it is in the paper.
In the paper
“Thus there is ample evidence that the proteins associated with cognitive trajectory interact with each other and reveal many PPIs within and between presynaptic and postsynaptic proteins associated with cognitive trajectory.”
§ Large-scale proteomic analysis of human brain identifies proteins associated with cognitive trajectory in advanced age > Results > Proteome-wide association study of cognitive trajectory
boostedcorrelational- Asserted: passes — The authors put it forward as true.
- Checkable: passes — It can be checked against evidence.
- Load-bearing: unclear — It is unclear whether the paper’s conclusions depend on it.
- Based: passes — The paper gives a reason why it holds.
It may state two separate claims as one.
In the paper
“MAPT (microtubule-associated protein tau) is involved in axonal transport, synaptic plasticity, and synaptic function13,”
§ Large-scale proteomic analysis of human brain identifies proteins associated with cognitive trajectory in advanced age > Results > Proteome-wide association study of cognitive trajectory
What the sources say
- Not checked yetcites [13] Caillet-Boudin, M. L., Buee, L., Sergeant, N. & Lefebvre, B. Regulation of human MAPT gene expression. Mol. Neurodegener. 10, 28 (2015). source
plaindirect- Asserted: passes — The authors put it forward as true.
- Checkable: passes — It can be checked against evidence.
- Load-bearing: fails — The paper’s conclusions may not depend on it.
- Based: passes — The paper gives a reason why it holds.
Probably not a substantial claim. The paper’s conclusions may not depend on it. It may state two separate claims as one.
A conclusion the paper draws from its own results — it cites no other source for it, so there is none to check. The quote shows it is in the paper.
In the paper
“In addition, the proteins with decreased abundance in cognitive stability were involved in inflammatory response, apoptosis, and endothelial function in glial cells, likely acting via β-amyloid plaques and neurofibrillary tangles.”
§ Large-scale proteomic analysis of human brain identifies proteins associated with cognitive trajectory in advanced age > Results > Proteins in cognitive trajectory adjusted for neuropathology
hedgedconditional- Asserted: passes — The authors put it forward as true.
- Checkable: passes — It can be checked against evidence.
- Load-bearing: passes — The paper’s conclusions depend on it.
- Based: passes — The paper gives a reason why it holds.
It may state two separate claims as one.
None of the sources cited for this claim have been checked yet.
In the paper
“VGF is a neuropeptide that regulates synaptic function10, synaptic plasticity11, and hippocampal memory consolidation12.”
§ Large-scale proteomic analysis of human brain identifies proteins associated with cognitive trajectory in advanced age > Results > Proteome-wide association study of cognitive trajectory
What the sources say
- Not checked yetcites [10] Alder, J. et al. Brain-derived neurotrophic factor-induced gene expression reveals novel actions of VGF in hippocampal synaptic plasticity. J. Neurosci. 23, 10800–10808 (2003). source
- Not checked yetcites [11] Bozdagi, O. et al. The neurotrophin-inducible gene Vgf regulates hippocampal function and behavior through a brain-derived neurotrophic factor-dependent mechanism. J. Neurosci. 28, 9857–9869 (2008). source
- Not checked yetcites [12] Lin, W. J. et al. VGF and Its C-terminal peptide TLQP-62 regulate memory formation in hippocampus via a BDNF-TrkB-dependent mechanism. J. Neurosci. 35, 10343–10356 (2015). source
plaindirect- Asserted: passes — The authors put it forward as true.
- Checkable: passes — It can be checked against evidence.
- Load-bearing: fails — The paper’s conclusions may not depend on it.
- Based: passes — The paper gives a reason why it holds.
Probably not a substantial claim. The paper’s conclusions may not depend on it. It may state two separate claims as one.
A conclusion the paper draws from its own results — it cites no other source for it, so there is none to check. The quote shows it is in the paper.
In the paper
“Furthermore, we provide additional evidence for increased synaptic abundance and decreased inflammation and apoptosis in cognitive stability.”
§ Large-scale proteomic analysis of human brain identifies proteins associated with cognitive trajectory in advanced age > Abstract
plaincorrelational- Asserted: passes — The authors put it forward as true.
- Checkable: passes — It can be checked against evidence.
- Load-bearing: passes — The paper’s conclusions depend on it.
- Based: passes — The paper gives a reason why it holds.
It may state two separate claims as one.
In the paper
“Mitochondria in neurons are crucial for maintaining synaptic function, and most of the mitochondrial proteins are encoded in the nuclear genome29.”
§ Large-scale proteomic analysis of human brain identifies proteins associated with cognitive trajectory in advanced age > Discussion
What the sources say
- Not checked yetcites [29] Devine, M. J. & Kittler, J. T. Mitochondria at the neuronal presynapse in health and disease. Nat. Rev. Neurosci. 19, 63–80 (2018). source
plaindirect- Asserted: passes — The authors put it forward as true.
- Checkable: passes — It can be checked against evidence.
- Load-bearing: fails — The paper’s conclusions may not depend on it.
- Based: passes — The paper gives a reason why it holds.
Probably not a substantial claim. The paper’s conclusions may not depend on it. It may state two separate claims as one.
None of the sources cited for this claim have been checked yet.
In the paper
“Synaptic mitochondria, therefore, are vital for the maintenance of synaptic function and transmission29–31.”
§ Large-scale proteomic analysis of human brain identifies proteins associated with cognitive trajectory in advanced age > Discussion
What the sources say
- Not checked yetcites [29] Devine, M. J. & Kittler, J. T. Mitochondria at the neuronal presynapse in health and disease. Nat. Rev. Neurosci. 19, 63–80 (2018). source
- Not checked yetcites [30] Du, H. et al. Early deficits in synaptic mitochondria in an Alzheimer's disease mouse model. Proc. Natl Acad. Sci. USA 107, 18670–18675 (2010). source
- Not checked yetcites [31] Reddy, P. H. et al. Amyloid-beta and mitochondria in aging and Alzheimer's disease: implications for synaptic damage and cognitive decline. J. Alzheimers. Dis. 20(Suppl 2), S499–S512 (2010). source
plaindirect- Asserted: passes — The authors put it forward as true.
- Checkable: passes — It can be checked against evidence.
- Load-bearing: fails — The paper’s conclusions may not depend on it.
- Based: passes — The paper gives a reason why it holds.
Probably not a substantial claim. The paper’s conclusions may not depend on it.
In the paper
“In the brain, mitochondria regulate synaptic transmission by generating ATP to power the process and by modulating presynaptic calcium level, which in turn determines the release of neurotransmitters29.”
§ Large-scale proteomic analysis of human brain identifies proteins associated with cognitive trajectory in advanced age > Discussion
What the sources say
- Not checked yetcites [29] Devine, M. J. & Kittler, J. T. Mitochondria at the neuronal presynapse in health and disease. Nat. Rev. Neurosci. 19, 63–80 (2018). source
plaindirect- Asserted: passes — The authors put it forward as true.
- Checkable: passes — It can be checked against evidence.
- Load-bearing: fails — The paper’s conclusions may not depend on it.
- Based: passes — The paper gives a reason why it holds.
Probably not a substantial claim. The paper’s conclusions may not depend on it. It may state two separate claims as one.
A conclusion the paper draws from its own results — it cites no other source for it, so there is none to check. The quote shows it is in the paper.
In the paper
“likely due to small sample size and thus lower power”
§ Large-scale proteomic analysis of human brain identifies proteins associated with cognitive trajectory in advanced age > Results > Modules of co-expressed proteins and cognitive trajectory
hedgedconditional- Asserted: passes — The authors put it forward as true.
- Checkable: passes — It can be checked against evidence.
- Load-bearing: fails — The paper’s conclusions may not depend on it.
- Based: passes — The paper gives a reason why it holds.
Probably not a substantial claim. The paper’s conclusions may not depend on it.
None of the sources cited for this claim have been checked yet.
In the paper
“Mitochondrial dysfunction has been suggested to occur early in the progression to AD and continues into later stages of AD31–34.”
§ Large-scale proteomic analysis of human brain identifies proteins associated with cognitive trajectory in advanced age > Discussion
What the sources say
- Not checked yetcites [31] Reddy, P. H. et al. Amyloid-beta and mitochondria in aging and Alzheimer's disease: implications for synaptic damage and cognitive decline. J. Alzheimers. Dis. 20(Suppl 2), S499–S512 (2010). source
- Not checked yetcites [32] Valla, J. et al. Reduced posterior cingulate mitochondrial activity in expired young adult carriers of the APOE epsilon4 allele, the major late-onset Alzheimer's susceptibility gene. J. Alzheimers. Dis. 22, 307–313 (2010). source
- Not checked yetcites [33] Liang, W. S. et al. Alzheimer's disease is associated with reduced expression of energy metabolism genes in posterior cingulate neurons. Proc. Natl Acad. Sci. USA 105, 4441–4446 (2008). source
- Not checked yetcites [34] Mastroeni, D. et al. Nuclear but not mitochondrial-encoded oxidative phosphorylation genes are altered in aging, mild cognitive impairment, and Alzheimer's disease. Alzheimers Dement. 13, 510–519 (2017). source
hedgedconditional- Asserted: passes — The authors put it forward as true.
- Checkable: passes — It can be checked against evidence.
- Load-bearing: fails — The paper’s conclusions may not depend on it.
- Based: passes — The paper gives a reason why it holds.
Probably not a substantial claim. The paper’s conclusions may not depend on it. It may state two separate claims as one.
None of the sources cited for this claim have been checked yet.
In the paper
“which is one of the most abundant scaffold proteins at the excitatory brain synapses and known to affect brain development, neuronal plasticity, memory and learning, and overall cognitive function24–28.”
§ Large-scale proteomic analysis of human brain identifies proteins associated with cognitive trajectory in advanced age > Results > Cognitive trajectory-associated proteins and hub proteins
What the sources say
- Not checked yetcites [24] Fernandez, E. et al. Targeted tandem affinity purification of PSD-95 recovers core postsynaptic complexes and schizophrenia susceptibility proteins. Mol. Syst. Biol. 5, 269 (2009). source
- Not checked yetcites [25] Fernandez, E. et al. Arc Requires PSD95 for Assembly into Postsynaptic Complexes Involved with Neural Dysfunction and Intelligence. Cell Rep 21, 679–691 (2017). source
- Not checked yetcites [26] Krishnan, M. L. et al. Integrative genomics of microglia implicates DLG4 (PSD95) in the white matter development of preterm infants. Nat. Commun. 8, 428 (2017). source
- Not checked yetcites [27] Migaud, M. et al. Enhanced long-term potentiation and impaired learning in mice with mutant postsynaptic density-95 protein. Nature 396, 433–439 (1998). source
- Not checked yetcites [28] Nithianantharajah, J. et al. Synaptic scaffold evolution generated components of vertebrate cognitive complexity. Nat. Neurosci. 16, 16–24 (2013). source
boosteddirect- Asserted: passes — The authors put it forward as true.
- Checkable: passes — It can be checked against evidence.
- Load-bearing: fails — The paper’s conclusions may not depend on it.
- Based: passes — The paper gives a reason why it holds.
Probably not a substantial claim. The paper’s conclusions may not depend on it. It may state two separate claims as one.
In the paper
“PSD-95 is a major scaffold protein of the dendritic spines and its expression level has been shown to be altered in aging, AD, and several psychiatric disorders37.”
§ Large-scale proteomic analysis of human brain identifies proteins associated with cognitive trajectory in advanced age > Discussion
What the sources say
- Not checked yetcites [37] Savioz, A., Leuba, G. & Vallet, P. G. A framework to understand the variations of PSD-95 expression in brain aging and in Alzheimer's disease. Ageing Res. Rev. 18, 86–94 (2014). source
plaincorrelational- Asserted: passes — The authors put it forward as true.
- Checkable: passes — It can be checked against evidence.
- Load-bearing: fails — The paper’s conclusions may not depend on it.
- Based: passes — The paper gives a reason why it holds.
Probably not a substantial claim. The paper’s conclusions may not depend on it. It may state two separate claims as one.
A conclusion the paper draws from its own results — it cites no other source for it, so there is none to check. The quote shows it is in the paper.
In the paper
“A notable theme among the proteins participating in synaptic function on this list of 38 proteins is that they are important for neuronal plasticity and memory consolidation and their overexpression is associated with cognitive”
§ Large-scale proteomic analysis of human brain identifies proteins associated with cognitive trajectory in advanced age > Discussion
plaincorrelational- Asserted: passes — The authors put it forward as true.
- Checkable: passes — It can be checked against evidence.
- Load-bearing: passes — The paper’s conclusions depend on it.
- Based: passes — The paper gives a reason why it holds.
It may state two separate claims as one.
In the paper
“Furthermore, a transgenic mouse model showed that amyloid pathology, even at a low level, can induce deficits in the functioning of synaptic mitochondria leading to synaptic degeneration30.”
§ Large-scale proteomic analysis of human brain identifies proteins associated with cognitive trajectory in advanced age > Discussion
What the sources say
- Not checked yetcites [30] Du, H. et al. Early deficits in synaptic mitochondria in an Alzheimer's disease mouse model. Proc. Natl Acad. Sci. USA 107, 18670–18675 (2010). source
plaindirect- Asserted: passes — The authors put it forward as true.
- Checkable: passes — It can be checked against evidence.
- Load-bearing: fails — The paper’s conclusions may not depend on it.
- Based: passes — The paper gives a reason why it holds.
Probably not a substantial claim. The paper’s conclusions may not depend on it.
In the paper
“In that study, young-adult participants in both groups did not have amyloid or tangle deposition in the posterior cingulate cortex (PCC); yet, APOE4 carriers, i.e., those at greater risk for developing AD, showed reduced mitochondrial activity in PCC neurons, as measured by cytochrome oxidase levels”
§ Large-scale proteomic analysis of human brain identifies proteins associated with cognitive trajectory in advanced age > Discussion
What the sources say
- Not checked yetcites [32] Valla, J. et al. Reduced posterior cingulate mitochondrial activity in expired young adult carriers of the APOE epsilon4 allele, the major late-onset Alzheimer's susceptibility gene. J. Alzheimers. Dis. 22, 307–313 (2010). source
plaincorrelational- Asserted: passes — The authors put it forward as true.
- Checkable: passes — It can be checked against evidence.
- Load-bearing: passes — The paper’s conclusions depend on it.
- Based: passes — The paper gives a reason why it holds.
It may state two separate claims as one.
In the paper
“Decreased abundance of this protein can lead to susceptibility to neuroinflammation and disruption of synaptic plasticity42.”
§ Large-scale proteomic analysis of human brain identifies proteins associated with cognitive trajectory in advanced age > Discussion
What the sources say
- Not checked yetcites [42] Rodriguez-Perdigon, M. et al. Down-regulation of glutamatergic terminals (VGLUT1) driven by Abeta in Alzheimer's disease. Hippocampus 26, 1303–1312 (2016). source
plaindirect- Asserted: passes — The authors put it forward as true.
- Checkable: passes — It can be checked against evidence.
- Load-bearing: unclear — It is unclear whether the paper’s conclusions depend on it.
- Based: passes — The paper gives a reason why it holds.
It may state two separate claims as one.
None of the sources cited for this claim have been checked yet.
In the paper
“PSD-95 is important for neuronal plasticity and memory consolidation via its regulation of synaptic glutamate receptors, signaling proteins, adhesion molecules, and cytoskeletal proteins37,38.”
§ Large-scale proteomic analysis of human brain identifies proteins associated with cognitive trajectory in advanced age > Discussion
What the sources say
- Not checked yetcites [37] Savioz, A., Leuba, G. & Vallet, P. G. A framework to understand the variations of PSD-95 expression in brain aging and in Alzheimer's disease. Ageing Res. Rev. 18, 86–94 (2014). source
- Not checked yetcites [38] Bustos, F. J. et al. Epigenetic editing of the Dlg4/PSD95 gene improves cognition in aged and Alzheimer's disease mice. Brain 140, 3252–3268 (2017). source
plaindirect- Asserted: passes — The authors put it forward as true.
- Checkable: passes — It can be checked against evidence.
- Load-bearing: fails — The paper’s conclusions may not depend on it.
- Based: passes — The paper gives a reason why it holds.
Probably not a substantial claim. The paper’s conclusions may not depend on it.
In the paper
“This study found that the nuclear genes encoding the mitochondrial electron transport chain subunits had decreased expression in AD cases compared to controls in PCC and other brain regions33.”
§ Large-scale proteomic analysis of human brain identifies proteins associated with cognitive trajectory in advanced age > Discussion
What the sources say
- Not checked yetcites [33] Liang, W. S. et al. Alzheimer's disease is associated with reduced expression of energy metabolism genes in posterior cingulate neurons. Proc. Natl Acad. Sci. USA 105, 4441–4446 (2008). source
plaincorrelational- Asserted: passes — The authors put it forward as true.
- Checkable: passes — It can be checked against evidence.
- Load-bearing: fails — The paper’s conclusions may not depend on it.
- Based: passes — The paper gives a reason why it holds.
Probably not a substantial claim. The paper’s conclusions may not depend on it.
In the paper
“SLC30A3, aka ZNT3, is a synapse-specific vesicular zinc transporter that is important for zinc homeostasis and required for hippocampus-dependent memory41.”
§ Large-scale proteomic analysis of human brain identifies proteins associated with cognitive trajectory in advanced age > Discussion
What the sources say
- Not checked yetcites [41] Sindreu, C., Palmiter, R. D. & Storm, D. R. Zinc transporter ZnT-3 regulates presynaptic Erk1/2 signaling and hippocampus-dependent memory. Proc. Natl.Acad. Sci. USA 108, 3366–3370 (2011). source
plaindirect- Asserted: passes — The authors put it forward as true.
- Checkable: passes — It can be checked against evidence.
- Load-bearing: fails — The paper’s conclusions may not depend on it.
- Based: passes — The paper gives a reason why it holds.
Probably not a substantial claim. The paper’s conclusions may not depend on it. It may state two separate claims as one.
None of the sources cited for this claim have been checked yet.
In the paper
“Along the same theme, SYNPO has been found to be important for synaptic plasticity43,44.”
§ Large-scale proteomic analysis of human brain identifies proteins associated with cognitive trajectory in advanced age > Discussion
What the sources say
- Not checked yetcites [43] Deller, T. et al. Synaptopodin-deficient mice lack a spine apparatus and show deficits in synaptic plasticity. Proc. Natl Acad. Sci. USA 100, 10494–10499 (2003). source
- Not checked yetcites [44] Vlachos, A. et al. Synaptopodin regulates denervation-induced homeostatic synaptic plasticity. Proc. Natl Acad. Sci. USA 110, 8242–8247 (2013). source
plaindirect- Asserted: passes — The authors put it forward as true.
- Checkable: passes — It can be checked against evidence.
- Load-bearing: fails — The paper’s conclusions may not depend on it.
- Based: passes — The paper gives a reason why it holds.
Probably not a substantial claim. The paper’s conclusions may not depend on it.
In the paper
“Synaptic degeneration has been suggested to be one of the earliest cellular event in AD pathogenesis, and synaptic loss to be the best correlate of cognitive impairment in AD (see review by Reddy et al.31).”
§ Large-scale proteomic analysis of human brain identifies proteins associated with cognitive trajectory in advanced age > Discussion
What the sources say
- Not checked yetcites [31] Reddy, P. H. et al. Amyloid-beta and mitochondria in aging and Alzheimer's disease: implications for synaptic damage and cognitive decline. J. Alzheimers. Dis. 20(Suppl 2), S499–S512 (2010). source
hedgedcorrelational- Asserted: passes — The authors put it forward as true.
- Checkable: passes — It can be checked against evidence.
- Load-bearing: fails — The paper’s conclusions may not depend on it.
- Based: passes — The paper gives a reason why it holds.
Probably not a substantial claim. The paper’s conclusions may not depend on it. It may state two separate claims as one.
In the paper
“Overexpression of Syt1 in mouse hippocampi was found to promote protective presenilin-1 conformation39”
§ Large-scale proteomic analysis of human brain identifies proteins associated with cognitive trajectory in advanced age > Discussion
What the sources say
- Not checked yetcites [39] Zoltowska, K. M. et al. Dynamic presenilin 1 and synaptotagmin 1 interaction modulates exocytosis and amyloid beta production. Mol. Neurodegener. 12, 15 (2017). source
plaindirect- Asserted: passes — The authors put it forward as true.
- Checkable: passes — It can be checked against evidence.
- Load-bearing: fails — The paper’s conclusions may not depend on it.
- Based: passes — The paper gives a reason why it holds.
Probably not a substantial claim. The paper’s conclusions may not depend on it.
In the paper
“SLC17A7, aka VGLUT1, is a sodium-dependent phosphate transporter that is specifically expressed in the neuron-rich regions of the brain and transports glutamate.”
§ Large-scale proteomic analysis of human brain identifies proteins associated with cognitive trajectory in advanced age > Discussion
What the sources say
- Not checked yetcites [42] Rodriguez-Perdigon, M. et al. Down-regulation of glutamatergic terminals (VGLUT1) driven by Abeta in Alzheimer's disease. Hippocampus 26, 1303–1312 (2016). source
plaindirect- Asserted: passes — The authors put it forward as true.
- Checkable: passes — It can be checked against evidence.
- Load-bearing: fails — The paper’s conclusions may not depend on it.
- Based: passes — The paper gives a reason why it holds.
Probably not a substantial claim. The paper’s conclusions may not depend on it. It may state two separate claims as one.
In the paper
“VGF is induced by BDNF and serotonin and is upregulated by antidepressants, exercise, and is reduced in animal models of depression51.”
§ Large-scale proteomic analysis of human brain identifies proteins associated with cognitive trajectory in advanced age > Discussion
What the sources say
- Not checked yetcites [51] Thakker-Varia, S. & Alder, J. Neuropeptides in depression: role of VGF. Behav. Brain. Res. 197, 262–278 (2009). source
plaindirect- Asserted: passes — The authors put it forward as true.
- Checkable: passes — It can be checked against evidence.
- Load-bearing: fails — The paper’s conclusions may not depend on it.
- Based: passes — The paper gives a reason why it holds.
Probably not a substantial claim. The paper’s conclusions may not depend on it. It may state two separate claims as one.
What the paper did — it cites no source for this, so there is none to check. The quote shows it is in the paper.
In the paper
“Second, our label-free proteomic method yielded approximately 3900 proteins in the proteome, which is not as comprehensive of a proteomic profile as would be ideal”
§ Large-scale proteomic analysis of human brain identifies proteins associated with cognitive trajectory in advanced age > Discussion
plain- Asserted: passes — The authors put it forward as true.
- Checkable: passes — It can be checked against evidence.
- Load-bearing: fails — The paper’s conclusions may not depend on it.
- Based: passes — The paper gives a reason why it holds.
Probably not a substantial claim. The paper’s conclusions may not depend on it. It may state two separate claims as one.
What the paper did — it cites no source for this, so there is none to check. The quote shows it is in the paper.
In the paper
“First, this is an association study and thus it precludes causal inference.”
§ Large-scale proteomic analysis of human brain identifies proteins associated with cognitive trajectory in advanced age > Discussion
plain- Asserted: passes — The authors put it forward as true.
- Checkable: passes — It can be checked against evidence.
- Load-bearing: fails — The paper’s conclusions may not depend on it.
- Based: passes — The paper gives a reason why it holds.
Probably not a substantial claim. The paper’s conclusions may not depend on it.
In the paper
“Myelination refers to the formation of a membranous sheath surrounding axons to increase signal transmitting speed between neurons and is not limited to early development but occurs throughout adulthood45.”
§ Large-scale proteomic analysis of human brain identifies proteins associated with cognitive trajectory in advanced age > Discussion
What the sources say
- Not checked yetcites [45] Snaidero, N. & Simons, M. Myelination at a glance. J. Cell Sci. 127, 2999 (2014). source
plaindirect- Asserted: passes — The authors put it forward as true.
- Checkable: passes — It can be checked against evidence.
- Load-bearing: fails — The paper’s conclusions may not depend on it.
- Based: passes — The paper gives a reason why it holds.
Probably not a substantial claim. The paper’s conclusions may not depend on it. It may state two separate claims as one.
In the paper
“Beach et al. described in detail how these measures were derived for the Banner cohort56.”
§ Large-scale proteomic analysis of human brain identifies proteins associated with cognitive trajectory in advanced age > Methods > Pathological assessment of Banner and BLSA cohorts
What the sources say
- Not checked yetcites [56] Beach, T. G. et al. Arizona Study of Aging and Neurodegenerative Disorders and Brain and Body Donation Program. Neuropathology 35, 354–389 (2015). source
plain- Asserted: passes — The authors put it forward as true.
- Checkable: passes — It can be checked against evidence.
- Load-bearing: passes — The paper’s conclusions depend on it.
- Based: passes — The paper gives a reason why it holds.
Probably not a substantial claim.
In the paper
“Our findings may reflect the two types of astrocytes as described in the literature—reactive astrocytes that lose the ability to promote neuronal survival, outgrowth, and synaptogenesis, and induce death of neurons and oligodendrocytes, and homeostatic astrocytes that promote neural functioning54.”
§ Large-scale proteomic analysis of human brain identifies proteins associated with cognitive trajectory in advanced age > Discussion
What the sources say
- Not checked yetcites [54] Liddelow, S. A. et al. Neurotoxic reactive astrocytes are induced by activated microglia. Nature 541, 481–487 (2017). source
hedgedconditional- Asserted: passes — The authors put it forward as true.
- Checkable: passes — It can be checked against evidence.
- Load-bearing: fails — The paper’s conclusions may not depend on it.
- Based: passes — The paper gives a reason why it holds.
Probably not a substantial claim. The paper’s conclusions may not depend on it. It may state two separate claims as one.
A conclusion the paper draws from its own results — it cites no other source for it, so there is none to check. The quote shows it is in the paper.
In the paper
“suggesting that some networks act through pathology while others act independently of pathology to contribute to variation in cognitive trajectory.”
§ Large-scale proteomic analysis of human brain identifies proteins associated with cognitive trajectory in advanced age > Discussion
hedgeddirect- Asserted: passes — The authors put it forward as true.
- Checkable: passes — It can be checked against evidence.
- Load-bearing: passes — The paper’s conclusions depend on it.
- Based: passes — The paper gives a reason why it holds.
It may state two separate claims as one.
In the paper
“Proteomic quantification for both cohorts used the approach described in detail in Seyfried et al.23 and enumerated below.”
§ Large-scale proteomic analysis of human brain identifies proteins associated with cognitive trajectory in advanced age > Methods > Proteomic measurements
What the sources say
- Not checked yetcites [23] Wingo, T. S. et al. Integrating next-generation genomic sequencing and mass spectrometry to estimate allele-specific protein abundance in human brain. J. Proteome. Res. 16, 3336–3347 (2017). source
plain- Asserted: passes — The authors put it forward as true.
- Checkable: passes — It can be checked against evidence.
- Load-bearing: fails — The paper’s conclusions may not depend on it.
- Based: passes — The paper gives a reason why it holds.
Probably not a substantial claim. The paper’s conclusions may not depend on it.
In the paper
“In the BLSA cohort, O'Brien et al. described how estimates of β-amyloid positive plaques and neurofibrillary tangles were derived62.”
§ Large-scale proteomic analysis of human brain identifies proteins associated with cognitive trajectory in advanced age > Methods > Pathological assessment of Banner and BLSA cohorts
What the sources say
- Not checked yetcites [62] O'Brien, R. J. et al. Neuropathologic studies of the Baltimore Longitudinal Study of Aging (BLSA). J Alzheimers Dis 18, 665–675 (2009). source
plain- Asserted: passes — The authors put it forward as true.
- Checkable: passes — It can be checked against evidence.
- Load-bearing: fails — The paper’s conclusions may not depend on it.
- Based: passes — The paper gives a reason why it holds.
Probably not a substantial claim. The paper’s conclusions may not depend on it.
In the paper
“From a genome-wide screen, a prominent observation after genetic ablation of IGF1 receptor in AD mice is the reduction in expression level of NEFM, down to control level, suggesting that lower-abundance of NEFM is protective46.”
§ Large-scale proteomic analysis of human brain identifies proteins associated with cognitive trajectory in advanced age > Discussion
What the sources say
- Not checked yetcites [46] George, C. et al. The Alzheimer's disease transcriptome mimics the neuroprotective signature of IGF-1 receptor-deficient neurons. Brain 140, 2012–2027 (2017). source
hedgeddirect- Asserted: passes — The authors put it forward as true.
- Checkable: passes — It can be checked against evidence.
- Load-bearing: passes — The paper’s conclusions depend on it.
- Based: passes — The paper gives a reason why it holds.
It may state two separate claims as one.
In the paper
“NEFM was shown to accumulate in the hippocampus in the presence of amyloid pathology46.”
§ Large-scale proteomic analysis of human brain identifies proteins associated with cognitive trajectory in advanced age > Discussion
What the sources say
- Not checked yetcites [46] George, C. et al. The Alzheimer's disease transcriptome mimics the neuroprotective signature of IGF-1 receptor-deficient neurons. Brain 140, 2012–2027 (2017). source
plaincorrelational- Asserted: passes — The authors put it forward as true.
- Checkable: passes — It can be checked against evidence.
- Load-bearing: passes — The paper’s conclusions depend on it.
- Based: passes — The paper gives a reason why it holds.
Probably not a substantial claim.
What the paper did — it cites no source for this, so there is none to check. The quote shows it is in the paper.
In the paper
“We also note that the published BLSA protein co-expression modules used here were constructed using the protein expression levels from both the dorsolateral prefrontal cortex (dPFC) and precuneus so the module memberships might be slightly different than those from the dPFC alone.”
§ Large-scale proteomic analysis of human brain identifies proteins associated with cognitive trajectory in advanced age > Discussion
hedgedconditional- Asserted: passes — The authors put it forward as true.
- Checkable: passes — It can be checked against evidence.
- Load-bearing: fails — The paper’s conclusions may not depend on it.
- Based: passes — The paper gives a reason why it holds.
Probably not a substantial claim. The paper’s conclusions may not depend on it. It may state two separate claims as one.
What the paper did — it cites no source for this, so there is none to check. The quote shows it is in the paper.
In the paper
“These subjects were followed for a total of 887 person-years over 676 visits.”
§ Large-scale proteomic analysis of human brain identifies proteins associated with cognitive trajectory in advanced age > Discussion
plain- Asserted: passes — The authors put it forward as true.
- Checkable: passes — It can be checked against evidence.
- Load-bearing: fails — The paper’s conclusions may not depend on it.
- Based: passes — The paper gives a reason why it holds.
Probably not a substantial claim. The paper’s conclusions may not depend on it.
What the paper did — it cites no source for this, so there is none to check. The quote shows it is in the paper.
In the paper
“We also employed a discovery and replication cohort design followed by meta-analysis to reduce false positive findings.”
§ Large-scale proteomic analysis of human brain identifies proteins associated with cognitive trajectory in advanced age > Discussion
plaindirect- Asserted: passes — The authors put it forward as true.
- Checkable: passes — It can be checked against evidence.
- Load-bearing: passes — The paper’s conclusions depend on it.
- Based: passes — The paper gives a reason why it holds.
Probably not a substantial claim.
In the paper
“Astrocytes provide neurotrophic support to promote neuronal survival, are important in the formation and maturation of synapses, help control neurotransmitter concentrations, and play a role in maintaining the blood-brain barrier53.”
§ Large-scale proteomic analysis of human brain identifies proteins associated with cognitive trajectory in advanced age > Discussion
What the sources say
- Not checked yetcites [53] Liddelow, S. & Barres, B. SnapShot: astrocytes in health and disease. Cell 162, 1170–1170 (2015). e1171. source
plaindirect- Asserted: passes — The authors put it forward as true.
- Checkable: passes — It can be checked against evidence.
- Load-bearing: fails — The paper’s conclusions may not depend on it.
- Based: passes — The paper gives a reason why it holds.
Probably not a substantial claim. The paper’s conclusions may not depend on it. It may state two separate claims as one.
None of the sources cited for this claim have been checked yet.
In the paper
“BLSA is a prospective cohort study of aging in community-dwelling individuals59,60.”
§ Large-scale proteomic analysis of human brain identifies proteins associated with cognitive trajectory in advanced age > Methods > Baltimore Longitudinal Study of Aging (BLSA) participants
What the sources say
- Not checked yetcites [59] Seddighi, S. et al. SPARCL1 Accelerates symptom onset in Alzheimer's disease and influences brain structure and function during aging. J. Alzheimers. Dis. 61, 401–414 (2018). source
- Not checked yetcites [60] Simpson, B. N. et al. Blood metabolite markers of cognitive performance and brain function in aging. J. Cereb. Blood Flow Metab. 36, 1212–1223 (2016). source
plain- Asserted: passes — The authors put it forward as true.
- Checkable: passes — It can be checked against evidence.
- Load-bearing: fails — The paper’s conclusions may not depend on it.
- Based: passes — The paper gives a reason why it holds.
Probably not a substantial claim. The paper’s conclusions may not depend on it.
In the paper
“VGF is a neuropeptide that promotes hippocampal neurogenesis, dendritic maturation, and synaptic activity50.”
§ Large-scale proteomic analysis of human brain identifies proteins associated with cognitive trajectory in advanced age > Discussion
What the sources say
- Not checked yetcites [50] Behnke, J. et al. Neuropeptide VGF promotes maturation of hippocampal dendrites that is reduced by single nucleotide polymorphisms. Int. J. Mol. Sci. 18, pii: E612 (2017). source
plaindirect- Asserted: passes — The authors put it forward as true.
- Checkable: passes — It can be checked against evidence.
- Load-bearing: fails — The paper’s conclusions may not depend on it.
- Based: passes — The paper gives a reason why it holds.
Probably not a substantial claim. The paper’s conclusions may not depend on it. It may state two separate claims as one.
What the paper did — it cites no source for this, so there is none to check. The quote shows it is in the paper.
In the paper
“Fourth, our sample sizes are relatively small (n = 104 and n = 39) and exclusively Caucasians, which may limit the generalizability of our findings and power.”
§ Large-scale proteomic analysis of human brain identifies proteins associated with cognitive trajectory in advanced age > Discussion
hedgedn = 104- Asserted: passes — The authors put it forward as true.
- Checkable: passes — It can be checked against evidence.
- Load-bearing: unclear — It is unclear whether the paper’s conclusions depend on it.
- Based: passes — The paper gives a reason why it holds.
It may state two separate claims as one.
What the paper did — it cites no source for this, so there is none to check. The quote shows it is in the paper.
In the paper
“Third, the available cognitive data was from the MMSE, a widely used screening tool that provides a coarse gauge of cognitive performance.”
§ Large-scale proteomic analysis of human brain identifies proteins associated with cognitive trajectory in advanced age > Discussion
plain- Asserted: passes — The authors put it forward as true.
- Checkable: passes — It can be checked against evidence.
- Load-bearing: fails — The paper’s conclusions may not depend on it.
- Based: passes — The paper gives a reason why it holds.
Probably not a substantial claim. The paper’s conclusions may not depend on it.
What the paper did — it cites no source for this, so there is none to check. The quote shows it is in the paper.
In the paper
“Despite this, ours is the largest brain proteomic study of cognitive trajectory to our knowledge.”
§ Large-scale proteomic analysis of human brain identifies proteins associated with cognitive trajectory in advanced age > Discussion
hedgedn = 104- Asserted: passes — The authors put it forward as true.
- Checkable: passes — It can be checked against evidence.
- Load-bearing: fails — The paper’s conclusions may not depend on it.
- Based: fails — The paper may give no reason why it holds.
Probably not a substantial claim. The paper’s conclusions may not depend on it. The paper may give no reason why it holds.
A conclusion the paper draws from its own results — it cites no other source for it, so there is none to check. The quote shows it is in the paper.
In the paper
“Finally, our findings establish a framework for understanding mechanisms underlying cognitive trajectory and nominate a list of highly promising targets for future mechanistic studies of cognitive stability.”
§ Large-scale proteomic analysis of human brain identifies proteins associated with cognitive trajectory in advanced age > Discussion
boosted- Asserted: passes — The authors put it forward as true.
- Checkable: fails — It may be too vague to check against evidence.
- Load-bearing: passes — The paper’s conclusions depend on it.
- Based: passes — The paper gives a reason why it holds.
Probably not a substantial claim. It may be too vague to check against evidence. It may state two separate claims as one.
What the paper did — it cites no source for this, so there is none to check. The quote shows it is in the paper.
In the paper
“Measures of AD pathology, i.e., β-amyloid plaques and neurofibrillary tangles, were used as covariates to adjust for the degree of AD pathology in each sample.”
§ Large-scale proteomic analysis of human brain identifies proteins associated with cognitive trajectory in advanced age > Methods > Pathological assessment of Banner and BLSA cohorts
plain- Asserted: passes — The authors put it forward as true.
- Checkable: passes — It can be checked against evidence.
- Load-bearing: passes — The paper’s conclusions depend on it.
- Based: passes — The paper gives a reason why it holds.
Probably not a substantial claim.
What the paper did — it cites no source for this, so there is none to check. The quote shows it is in the paper.
In the paper
“The false discovery rate (FDR) for peptide spectral matches, proteins, and site decoy fraction were all set to 1 percent.”
§ Large-scale proteomic analysis of human brain identifies proteins associated with cognitive trajectory in advanced age > Methods > Proteomic measurements
plain- Asserted: passes — The authors put it forward as true.
- Checkable: passes — It can be checked against evidence.
- Load-bearing: fails — The paper’s conclusions may not depend on it.
- Based: passes — The paper gives a reason why it holds.
Probably not a substantial claim. The paper’s conclusions may not depend on it. It may state two separate claims as one.
A conclusion the paper draws from its own results — it cites no other source for it, so there is none to check. The quote shows it is in the paper.
In the paper
“We removed these technical (batch and PMI) and biological effects (sex and age at death) because they may confound our association analyses between cognitive trajectory and protein levels.”
§ Large-scale proteomic analysis of human brain identifies proteins associated with cognitive trajectory in advanced age > Methods > Proteomic quality control
hedgedconditional- Asserted: passes — The authors put it forward as true.
- Checkable: passes — It can be checked against evidence.
- Load-bearing: passes — The paper’s conclusions depend on it.
- Based: passes — The paper gives a reason why it holds.
It may state two separate claims as one.
What the paper did — it cites no source for this, so there is none to check. The quote shows it is in the paper.
In the paper
“The BLSA study was approved by the Institutional Review Board and the National Institute on Aging.”
§ Large-scale proteomic analysis of human brain identifies proteins associated with cognitive trajectory in advanced age > Methods > Baltimore Longitudinal Study of Aging (BLSA) participants
plain- Asserted: passes — The authors put it forward as true.
- Checkable: passes — It can be checked against evidence.
- Load-bearing: fails — The paper’s conclusions may not depend on it.
- Based: passes — The paper gives a reason why it holds.
Probably not a substantial claim. The paper’s conclusions may not depend on it. It may state two separate claims as one.
In the paper
“For enrichment analysis, we used a modified version of the GeneOverlap function (from package of the same name) in R and Fisher’s exact test so that all pair-wise tests were adjusted for multiple testing using BH method to control the FDR67.”
§ Large-scale proteomic analysis of human brain identifies proteins associated with cognitive trajectory in advanced age > Methods > Enrichment analysis of cognitive trajectory proteins
What the sources say
- Not checked yetcites [67] Benjamini, Y. & Yekutieli, D. The control of the false discovery rate in multiple testing under dependency. Ann. Statist. 29, 1165–1188 (2001). source
plain- Asserted: passes — The authors put it forward as true.
- Checkable: passes — It can be checked against evidence.
- Load-bearing: fails — The paper’s conclusions may not depend on it.
- Based: passes — The paper gives a reason why it holds.
Probably not a substantial claim. The paper’s conclusions may not depend on it.
In the paper
“For all analyses, we used Benjamini–Hochberg (BH) method to control the false discovery rate (FDR)67, and declared significantly associated proteins as those with BH FDR p < 0.05.”
§ Large-scale proteomic analysis of human brain identifies proteins associated with cognitive trajectory in advanced age > Methods > Proteome-wide association study of cognitive trajectory
What the sources say
- Not checked yetcites [67] Benjamini, Y. & Yekutieli, D. The control of the false discovery rate in multiple testing under dependency. Ann. Statist. 29, 1165–1188 (2001). source
plain- Asserted: passes — The authors put it forward as true.
- Checkable: passes — It can be checked against evidence.
- Load-bearing: passes — The paper’s conclusions depend on it.
- Based: passes — The paper gives a reason why it holds.
Probably not a substantial claim. It may state two separate claims as one.
What the paper did — it cites no source for this, so there is none to check. The quote shows it is in the paper.
In the paper
“Only proteins quantified in at least 90% of the samples were included in the analysis.”
§ Large-scale proteomic analysis of human brain identifies proteins associated with cognitive trajectory in advanced age > Methods > Proteomic quality control
plain- Asserted: passes — The authors put it forward as true.
- Checkable: passes — It can be checked against evidence.
- Load-bearing: passes — The paper’s conclusions depend on it.
- Based: passes — The paper gives a reason why it holds.
Probably not a substantial claim.
In the paper
“All BLSA participants provided written informed consent at each visit61.”
§ Large-scale proteomic analysis of human brain identifies proteins associated with cognitive trajectory in advanced age > Methods > Baltimore Longitudinal Study of Aging (BLSA) participants
What the sources say
- Not checked yetcites [61] Ferrucci, L. The Baltimore Longitudinal Study of Aging (BLSA): a 50-year-long journey and plans for the future. J Gerontol A Biol Sci Med Sci 63, 1416–1419 (2008). source
plain- Asserted: passes — The authors put it forward as true.
- Checkable: passes — It can be checked against evidence.
- Load-bearing: fails — The paper’s conclusions may not depend on it.
- Based: passes — The paper gives a reason why it holds.
Probably not a substantial claim. The paper’s conclusions may not depend on it.
In the paper
“For BLSA, we used the BLSA networks from Seyfried et al.23, which were previously built using proteins measured from the precuneus and prefrontal cortex in the same individual.”
§ Large-scale proteomic analysis of human brain identifies proteins associated with cognitive trajectory in advanced age > Methods > Protein co-expression network analysis
What the sources say
- Not checked yetcites [23] Wingo, T. S. et al. Integrating next-generation genomic sequencing and mass spectrometry to estimate allele-specific protein abundance in human brain. J. Proteome. Res. 16, 3336–3347 (2017). source
plain- Asserted: passes — The authors put it forward as true.
- Checkable: passes — It can be checked against evidence.
- Load-bearing: fails — The paper’s conclusions may not depend on it.
- Based: passes — The paper gives a reason why it holds.
Probably not a substantial claim. The paper’s conclusions may not depend on it.
In the paper
“Therefore, within each cohort, effect of batch was removed using Combat64, and effects of sex, age at death, and PMI were removed using bootstrap regression.”
§ Large-scale proteomic analysis of human brain identifies proteins associated with cognitive trajectory in advanced age > Methods > Proteomic quality control
What the sources say
- Not checked yetcites [64] Johnson, W. E., Li, C. & Rabinovic, A. Adjusting batch effects in microarray expression data using empirical Bayes methods. Biostatistics 8, 118–127 (2007). source
plaindirect- Asserted: passes — The authors put it forward as true.
- Checkable: passes — It can be checked against evidence.
- Load-bearing: passes — The paper’s conclusions depend on it.
- Based: passes — The paper gives a reason why it holds.
Probably not a substantial claim. It may state two separate claims as one.
In the paper
“Then, batch effects were removed using Combat64, and age at death, sex, and PMI were regressed from the proteomic profiles using Bootstrap regression.”
§ Large-scale proteomic analysis of human brain identifies proteins associated with cognitive trajectory in advanced age > Methods > Protein co-expression network analysis
What the sources say
- Not checked yetcites [64] Johnson, W. E., Li, C. & Rabinovic, A. Adjusting batch effects in microarray expression data using empirical Bayes methods. Biostatistics 8, 118–127 (2007). source
plain- Asserted: passes — The authors put it forward as true.
- Checkable: passes — It can be checked against evidence.
- Load-bearing: passes — The paper’s conclusions depend on it.
- Based: passes — The paper gives a reason why it holds.
Probably not a substantial claim. It may state two separate claims as one.
The paper relies on this without support.
No proteome-wide study of cognitive trajectory has been performed to date.
“Yet, no proteome-wide study of cognitive trajectory has been performed to date.”
The paper relies on this without support.
Removing batch, sex, age at death, and PMI effects from the proteomic profiles does not remove variance related to cognitive trajectory.
“We removed these technical (batch and PMI) and biological effects (sex and age at death) because they may confound our association analyses between cognitive trajectory and protein levels.”
The paper relies on this without support.
The BLSA protein co-expression networks from Seyfried et al. are applicable to the current BLSA proteomic data despite being built from different brain regions (precuneus and prefrontal cortex).
“For BLSA, we used the BLSA networks from Seyfried et al.23, which were previously built using proteins measured from the precuneus and prefrontal cortex in the same individual.”
Claims other papers make about this one
Each is checked against this paper’s own text: does it say what the citing paper says it does?
The check wasn’t confident either way, so it gives no verdict — never disputed.
In the citing paper
“On the other hand, elevated levels of the myelin inhibitor OMG are positively correlated with cerebral atherosclerosis and cognitive decline [78, 79].”
From CI-994 is a dual modulator of class I HDACs and Wnt/β-catenin signaling for the treatment of Alzheimer's disease (2026) · cites this paper as [79]
Experimental — accuracy not yet measuredIn the citing paper
“Nearly a dozen informative network-based analyses of the AD proteome have been performed in the human brain [62–64, 74, 78, 96, 104–108], including the dorsolateral prefrontal cortex (DLPFC), temporal cortex, and other cortical regions heavily affected in AD.”
From Systems-based proteomics to resolve the biology of Alzheimer’s disease beyond amyloid and tau (2021) · cites this paper as [106]
In the citing paper
“Wingo et al. used co-expression network analysis to demonstrate the increased abundance of synaptic proteins in the postmortem brain tissues (DLPFC) of individuals with antemortem stable cognitive trajectories, regardless of the burden of Aβ plaques or tau tangles [106].”
From Systems-based proteomics to resolve the biology of Alzheimer’s disease beyond amyloid and tau (2021) · cites this paper as [106]
In the citing paper
“this study also found heightened levels of mitochondrial proteins among cases with preserved cognition”
From Systems-based proteomics to resolve the biology of Alzheimer’s disease beyond amyloid and tau (2021) · cites this paper as [106]
Self-check
Percentages, sums and reported differences re-computed from the paper’s own numbers.
Each contradiction between two passages listed here was confirmed by an independent check.
Rated minor: it would not touch a result — a value no result rests on, a p-value that stays on the same side of the significance level, or a conflict that is clerical, resolved elsewhere in the paper, or outside its own findings.
In the paper
§ Large-scale proteomic analysis of human brain identifies proteins associated with cognitive trajectory in advanced age > Results > Cognitive trajectory-associated proteins and hub proteins
“| DLG4\|P78352-3 | Synaptic function | 1.6554 | 0.00016497 | ++ |”
§ Large-scale proteomic analysis of human brain identifies proteins associated with cognitive trajectory in advanced age > Results > Cognitive trajectory-associated proteins and hub proteins
“Note: This table summarizes 38 hub proteins that were associated with cognitive trajectory after adjusting for β-amyloid plaques and neurofibrillary tangles and their Pearson correlation with cognitive trajectory.”
Citations
Cites
Folstein, M. F., Folstein, S. E., & McHugh, P. R. (1975) · Journal of Psychiatric Research · doi:10.1016/0022-3956(75)90026-6 · Cited by 88,282
WGCNA: an R package for weighted correlation network analysis
Langfelder, P., & Horvath, S. (2008) · BMC Bioinformatics · doi:10.1186/1471-2105-9-559 · Cited by 27,252
Hirono, N., Mori, E., Ikejiri, Y., Imamura, T., Shimomura, T., Hashimoto, M., Yamashita, H., & Ikeda, M. (1997) · PubMed · Cited by 21,012
Kok, J. S., Berg, I. J., & Scherder, E. J. A. (2013) · Dementia and Geriatric Cognitive Disorders Extra · doi:10.1159/000353441 · Cited by 20,589
Older Adults' Reasons for Using Technology while Aging in Place
Peek, S. T. M., Luijkx, K. G., Rijnaard, M. D., Nieboer, M. E., van der Voort, C. S., Aarts, S., van Hoof, J., Vrijhoef, H. J., & Wouters, E. (2015) · Gerontology · doi:10.1159/000430949 · Cited by 19,852
Sensitivity and False Alarm Rate of a Fall Sensor in Long-Term Fall Detection in the Elderly
Kangas, M., Korpelainen, R., Vikman, I., Nyberg, L., & Jämsä, T. J. (2014) · Gerontology · doi:10.1159/000362720 · Cited by 19,007
The control of the false discovery rate in multiple testing under dependency
Benjamini, Y., & Yekutieli, D. (2001) · The Annals of Statistics · doi:10.1214/aos/1013699998 · Cited by 10,490
Adjusting batch effects in microarray expression data using empirical Bayes methods
Johnson, W. E., Li, C., & Rabinovic, A. (2007) · Biostatistics · doi:10.1093/biostatistics/kxj037 · Cited by 8,658
Neurotoxic reactive astrocytes are induced by activated microglia
Liddelow, S. A., Guttenplan, K. A., Clarke, L. E., Bennett, F. C., Bohlen, C. J., Schirmer, L., Bennett, M. L., Münch, A. E., Chung, W.-S., Peterson, T. C., et al. (2017) · Nature · doi:10.1038/nature21029 · Cited by 7,971
UniProt: the Universal Protein knowledgebase
Apweiler, R. (2003) · Nucleic Acids Research · doi:10.1093/nar/gkh131 · Cited by 7,593
METAL: fast and efficient meta-analysis of genomewide association scans
Willer, C. J., Li, Y., & Abecasis, G. R. (2010) · Bioinformatics · doi:10.1093/bioinformatics/btq340 · Cited by 5,205
Cox, J., Hein, M. Y., Luber, C. A., Paron, I., Nagaraj, N., & Mann, M. (2014) · Molecular & Cellular Proteomics · doi:10.1074/mcp.m113.031591 · Cited by 5,180
The Mini‐Mental State Examination: A Comprehensive Review
Tombaugh, T. N., & McIntyre, N. J. (1992) · Journal of the American Geriatrics Society · doi:10.1111/j.1532-5415.1992.tb01992.x · Cited by 5,152
UniProt: the universal protein knowledgebase
The UniProt Consortium (2017) · Nucleic Acids Research · doi:10.1093/nar/gkw1099 · Cited by 4,436
Terry, R. D., Masliah, E., Salmon, D. P., Butters, N., DeTeresa, R., Hill, R., Hansen, L. A., & Katzman, R. (1991) · Annals of Neurology · doi:10.1002/ana.410300410 · Cited by 4,397
Cell types in the mouse cortex and hippocampus revealed by single-cell RNA-seq
Zeisel, A., Muñoz-Manchado, A. B., Codeluppi, S., Lönnerberg, P., La Manno, G., Juréus, A., Marques, S., Munguba, H., He, L., Betsholtz, C., et al. (2015) · Science · doi:10.1126/science.aaa1934 · Cited by 3,124
A Gene-Coexpression Network for Global Discovery of Conserved Genetic Modules
Stuart, J. M., Segal, E., Koller, D., & Kim, S. K. (2003) · Science · doi:10.1126/science.1087447 · Cited by 2,274
Tau-mediated neurodegeneration in Alzheimer’s disease and related disorders
Ballatore, C., Lee, V. M.-Y., & Trojanowski, J. Q. (2007) · Nature Reviews Neuroscience · doi:10.1038/nrn2194 · Cited by 2,174
A survey of human brain transcriptome diversity at the single cell level
Darmanis, S., Sloan, S. A., Zhang, Y., Enge, M., Caneda, C., Shuer, L. M., Hayden Gephart, M. G., Barres, B. A., & Quake, S. R. (2015) · Proceedings of the National Academy of Sciences · doi:10.1073/pnas.1507125112 · Cited by 1,401
Migaud, M., Charlesworth, P., Dempster, M., Webster, L. C., Watabe, A. M., Makhinson, M., He, Y., Ramsay, M. F., Morris, R. G. M., Morrison, J. H., et al. (1998) · Nature · doi:10.1038/24790 · Cited by 1,160
The BioGRID interaction database: 2017 update
Chatr‐aryamontri, A., Oughtred, R., Boucher, L., Rust, J., Chang, C., Kolas, N. K., O’Donnell, L., Oster, S. K., Theesfeld, C. L., Sellam, A., et al. (2016) · Nucleic Acids Research · doi:10.1093/nar/gkw1102 · Cited by 985
Creavin, S., Wisniewski, S., Noel-Storr, A. H., Trevelyan, C. M., Hampton, T., Rayment, D., Thom, V. M., Nash, K. J. E., Elhamoui, H., Milligan, R., et al. (2016) · Cochrane Database of Systematic Reviews · doi:10.1002/14651858.cd011145.pub2 · Cited by 884
Cell type- and brain region-resolved mouse brain proteome
Sharma, K., Schmitt, S., Bergner, C. G., Tyanova, S., Kannaiyan, N., Manrique-Hoyos, N., Kongi, K., Cantuti, L., Hanisch, U.-K., Philips, M.-A., et al. (2015) · Nature Neuroscience · doi:10.1038/nn.4160 · Cited by 785
variancePartition: interpreting drivers of variation in complex gene expression studies
Hoffman, G. E., & Schadt, E. E. (2016) · BMC Bioinformatics · doi:10.1186/s12859-016-1323-z · Cited by 769
Multi-ethnic genome-wide association study for atrial fibrillation
Roselli, C., Chaffin, M. D., Weng, L.-C. C., Aeschbacher, S., Ahlberg, G., Albert, C. M., Almgren, P., Alonso, Á., Anderson, C. D., Aragam, K. G., et al. (2018) · Nature Genetics · doi:10.1038/s41588-018-0133-9 · Cited by 761
Tau and Aβ imaging, CSF measures, and cognition in Alzheimer’s disease
Brier, M. R., Gordon, B., Friedrichsen, K., McCarthy, J., Stern, A., Christensen, J., Owen, C., Aldea, P., Su, Y., Hassenstab, J., et al. (2016) · Science Translational Medicine · doi:10.1126/scitranslmed.aaf2362 · Cited by 734
Early deficits in synaptic mitochondria in an Alzheimer's disease mouse model
Du, H., Guo, L., Yan, S., Sosunov, A. A., McKhann, G. M., & ShiDu Yan, S. (2010) · Proceedings of the National Academy of Sciences · doi:10.1073/pnas.1006586107 · Cited by 704
Meta‐Analysis in Medical Research
Haidich, A. (2005) · Wiley eBooks · doi:10.1002/9780470994894 · Cited by 692
Plassman, B. L., Williams, J. W., Burke, J. R., Holsinger, T., & Benjamin, S. (2010) · Annals of Internal Medicine · doi:10.7326/0003-4819-153-3-201008030-00258 · Cited by 681
Mitochondria at the neuronal presynapse in health and disease
Devine, M. J., & Kittler, J. T. (2018) · Nature reviews. Neuroscience · doi:10.1038/nrn.2017.170 · Cited by 636
Liang, W. S., Reiman, E. M., Valla, J., Dunckley, T., Beach, T. G., Grover, A., Niedzielko, T. L., Schneider, L. E., Mastroeni, D., Caselli, R., et al. (2008) · Proceedings of the National Academy of Sciences · doi:10.1073/pnas.0709259105 · Cited by 585
Self-citationHomer1a drives homeostatic scaling-down of excitatory synapses during sleep
Diering, G. H., Nirujogi, R. S., Roth, R. H., Worley, P. F., Pandey, A., & Huganir, R. L. (2017) · Science · doi:10.1126/science.aai8355 · Cited by 516
Person-specific contribution of neuropathologies to cognitive loss in old age
Boyle, P. A., Yu, L., Wilson, R. S., Leurgans, S. E., Schneider, J. A., & Bennett, D. A. (2018) · Annals of Neurology · doi:10.1002/ana.25123 · Cited by 508
Characterization of the proteome, diseases and evolution of the human postsynaptic density
Bayés, À., van de Lagemaat, L. N., Collins, M. O., Croning, M. D. R., Whittle, I. R., Choudhary, J. S., & Grant, S. G. N. (2011) · Nature Neuroscience · doi:10.1038/nn.2719 · Cited by 499
Reduced IGF-1 signaling delays age-associated proteotoxicity in mice
Cohen, E., Paulsson, J. F., Blinder, P., Burstyn-Cohen, T., Du, D., Estepa, G., Adame, A., Pham, H. M., Holzenberger, M., Kelly, J. W., et al. (2009) · Cell · doi:10.1016/j.cell.2009.11.014 · Cited by 488
Seyfried, N. T., Dammer, E. B., Swarup, V., Nandakumar, D., Duong, D. M., Yin, L., Deng, Q., Nguyen, T., Hales, C. M., Wingo, T., et al. (2017) · Cell Systems · doi:10.1016/j.cels.2016.11.006 · Cited by 477
Self-citationArizona Study of Aging and Neurodegenerative Disorders and Brain and Body Donation Program
Beach, T. G., Adler, C. H., Sue, L. I., Serrano, G., Shill, H. A., Walker, D. G., Lue, L., Roher, A. E., Dugger, B. N., Maarouf, C., et al. (2015) · Neuropathology · doi:10.1111/neup.12189 · Cited by 460
Self-citationThe Neuropathology of Older Persons with and Without Dementia from Community versus Clinic Cohorts
Schneider, J. A., Aggarwal, N. T., Barnes, L., Boyle, P., & Bennett, D. A. (2009) · Journal of Alzheimer's Disease · doi:10.3233/jad-2009-1227 · Cited by 372
Zaninotto, P., Batty, G. D., Allerhand, M., & Deary, I. J. (2018) · Journal of Epidemiology & Community Health · doi:10.1136/jech-2017-210116 · Cited by 339
Much of late life cognitive decline is not due to common neurodegenerative pathologies
Boyle, P. A., Wilson, R. S., Yu, L., Barr, A. M., Honer, W. G., Schneider, J. A., & Bennett, D. A. (2013) · Annals of Neurology · doi:10.1002/ana.23964 · Cited by 323
Alder, J., Thakker‐Varia, S., Bangasser, D. A., Kuroiwa, M., Plummer, M. R., Shors, T. J., & Black, I. B. (2003) · Journal of Neuroscience · doi:10.1523/jneurosci.23-34-10800.2003 · Cited by 302
The Baltimore Longitudinal Study of Aging (BLSA): A 50-Year-Long Journey and Plans for the Future
Ferrucci, L. (2008) · The Journals of Gerontology Series A · doi:10.1093/gerona/63.12.1416 · Cited by 293
Synaptopodin-deficient mice lack a spine apparatus and show deficits in synaptic plasticity
Deller, T., Körte, M., Chabanis, S., Drakew, A., Schwegler, H., Stefani, G. G., Zúñiga, A., Schwarz, K., Bonhoeffer, T., Zeller, R., et al. (2003) · Proceedings of the National Academy of Sciences · doi:10.1073/pnas.1832384100 · Cited by 291
Cognitive impairment 18 years before clinical diagnosis of Alzheimer disease dementia
Rajan, K. B., Wilson, R. S., Weuve, J., Barnes, L. L., & Evans, D. A. (2015) · Neurology · doi:10.1212/wnl.0000000000001774 · Cited by 272
Fernández, E., Collins, M. O., Uren, R. T., Kopanitsa, M. V., Komiyama, N. H., Croning, M. D. R., Zografos, L., Armstrong, J. D., Choudhary, J. S., & Grant, S. G. N. (2009) · Molecular Systems Biology · doi:10.1038/msb.2009.27 · Cited by 270
GO-Elite: a flexible solution for pathway and ontology over-representation
Zambon, A. C., Gaj, S., Ho, I., Hanspers, K., VRANIZAN, K. M., Evelo, C. T., Conklin, B. R., Pico, A. R., & Salomonis, N. (2012) · Bioinformatics · doi:10.1093/bioinformatics/bts366 · Cited by 263
Synaptic scaffold evolution generated components of vertebrate cognitive complexity
Nithianantharajah, J., Komiyama, N. H., McKechanie, A., Johnstone, M., Blackwood, D. H., Clair, D. S., Emes, R. D., van de Lagemaat, L. N., Saksida, L. M., Bussey, T. J., et al. (2013) · Nature Neuroscience · doi:10.1038/nn.3276 · Cited by 251
Reddy, P. H., Mańczak, M., Mao, P., Calkins, M. J., Reddy, A. P., & Shirendeb, U. P. (2010) · Journal of Alzheimer s Disease · doi:10.3233/jad-2010-100504 · Cited by 247
Synaptic markers of cognitive decline in neurodegenerative diseases: a proteomic approach
Bereczki, E., Branca, R. M., Francis, P. T., Pereira, J. B., Baek, J.-H., Hortobágyi, T., Winblad, B., Ballard, C., Lehtiö, J., & Aarsland, D. (2018) · Brain · doi:10.1093/brain/awx352 · Cited by 220
Regulation of human MAPT gene expression
Caillet‐Boudin, M., Buée, L., Sergeant, N., & Lefebvre, B. (2015) · Molecular Neurodegeneration · doi:10.1186/s13024-015-0025-8 · Cited by 213
Snaidero, N., & Simons, M. (2014) · Journal of Cell Science · doi:10.1242/jcs.151043 · Cited by 205
Epigenetic editing of the Dlg4/PSD95 gene improves cognition in aged and Alzheimer’s disease mice
Bustos, F. J., Ampuero, E., Jury, N., Aguilar, R., Falahi, F., Toledo, J. A., Ahumada, J., Lata, J., Cubillos, P., Henríquez, B., et al. (2017) · Brain · doi:10.1093/brain/awx272 · Cited by 203
Zinc transporter ZnT-3 regulates presynaptic Erk1/2 signaling and hippocampus-dependent memory
Sindreu, C. B., Palmiter, R. D., & Storm, D. R. (2011) · Proceedings of the National Academy of Sciences · doi:10.1073/pnas.1019166108 · Cited by 180
Multiscale causal networks identify VGF as a key regulator of Alzheimer’s disease
Beckmann, N. D., Lin, W.-J., Wang, M., Cohain, A. T., Charney, A. W., Wang, P., Ma, W., Wang, Y.-C., Jiang, C., Audrain, M., et al. (2020) · Nature Communications · doi:10.1038/s41467-020-17405-z · Cited by 172
Self-citationSynaptic proteins predict cognitive decline in Alzheimer's disease and Lewy body dementia
Bereczki, E., Francis, P. T., Howlett, D., Pereira, J. B., Höglund, K., Bogstedt, A., Cedazo‐Minguez, A., Baek, J., Hortobágyi, T., Attems, J., et al. (2016) · Alzheimer's & Dementia · doi:10.1016/j.jalz.2016.04.005 · Cited by 167
Boyken, J., Grønborg, M., Riedel, D., Urlaub, H., Jahn, R., & Chua, J. J. E. (2013) · Neuron · doi:10.1016/j.neuron.2013.02.027 · Cited by 158
Valla, J., Yaari, R., Wolf, A. B., Kusne, Y., Beach, T. G., Roher, A. E., Corneveaux, J. J., Huentelman, M. J., Caselli, R. J., & Reiman, E. M. (2010) · Journal of Alzheimer s Disease · doi:10.3233/jad-2010-100129 · Cited by 150
Self-citationSnapShot: Astrocytes in Health and Disease
Liddelow, S. A., & Barres, B. A. (2015) · Cell · doi:10.1016/j.cell.2015.08.029 · Cited by 148
Bozdagi, O., Rich, E. L., Tronel, S., Sadahiro, M., Patterson, K., Shapiro, M. L., Alberini, C. M., Huntley, G. W., & Salton, S. R. (2008) · Journal of Neuroscience · doi:10.1523/jneurosci.3145-08.2008 · Cited by 146
Gontier, G., George, C., Chaker, Z., Holzenberger, M., & Aïd, S. (2015) · Journal of Neuroscience · doi:10.1523/jneurosci.0343-15.2015 · Cited by 145
Neuropathologic Studies of the Baltimore Longitudinal Study of Aging (BLSA)
O'Brien, R. J., Resnick, S. M., Zonderman, A. B., Ferrucci, L., Crain, B. J., Pletnikova, O., Rudow, G., Iacono, D., Riudavets, M. A., Driscoll, I., et al. (2009) · Journal of Alzheimer's Disease · doi:10.3233/jad-2009-1179 · Cited by 137
Mastroeni, D., Khdour, O. M., Delvaux, E., Nolz, J., Olsen, G., Berchtold, N. C., Cotman, C. W., Hecht, S. M., & Coleman, P. D. (2016) · Alzheimer s & Dementia · doi:10.1016/j.jalz.2016.09.003 · Cited by 134
Savioz, A., Leuba, G., & Vallet, P. G. (2014) · Ageing Research Reviews · doi:10.1016/j.arr.2014.09.004 · Cited by 127
Lin, W., Jiang, C. S., Sadahiro, M., Bozdagi, O., Vulchanova, L., Alberini, C. M., & Salton, S. R. (2015) · Journal of Neuroscience · doi:10.1523/jneurosci.0584-15.2015 · Cited by 116
Synaptopodin regulates denervation-induced homeostatic synaptic plasticity
Vlachos, A., Ikenberg, B. D., Lenz, M., Becker, D., Reifenberg, K., Orth, C. B., & Deller, T. (2013) · Proceedings of the National Academy of Sciences · doi:10.1073/pnas.1213677110 · Cited by 105
Krishnan, M. L., Van Steenwinckel, J., Schang, A.-L., Yan, J., Arnadottir, J., Le Charpentier, T., Csaba, Z., Dournaud, P., Cipriani, S., Auvynet, C., et al. (2017) · Nature Communications · doi:10.1038/s41467-017-00422-w · Cited by 105
Fernández, E., Collins, M. O., Frank, R., Zhu, F., Kopanitsa, M. V., Nithianantharajah, J., Lemprière, S. A., Fricker, D. G., Elsegood, K. A., McLaughlin, C. L., et al. (2017) · Cell Reports · doi:10.1016/j.celrep.2017.09.045 · Cited by 91
Neuropeptides in depression: Role of VGF
Thakker‐Varia, S., & Alder, J. (2008) · Behavioural Brain Research · doi:10.1016/j.bbr.2008.10.006 · Cited by 88
George, C., Gontier, G., Lacube, P., François, J., Holzenberger, M., & Aïd, S. (2017) · Brain · doi:10.1093/brain/awx132 · Cited by 82
Blood metabolite markers of cognitive performance and brain function in aging
Simpson, B. N., Kim, M. G., Chuang, Y., Beason‐Held, L. L., Kitner‐Triolo, M. H., Kraut, M. A., Lirette, S. T., Windham, B. G., Griswold, M. E., Legido‐Quigley, C., et al. (2015) · Journal of Cerebral Blood Flow & Metabolism · doi:10.1177/0271678x15611678 · Cited by 63
Self-citationVojinovic, D., Adams, H. H., Jian, X., Yang, Q., Smith, A. V., Bis, J. C., Teumer, A., Scholz, M., Armstrong, N. J., Hofer, E., et al. (2018) · Nature Communications · doi:10.1038/s41467-018-06234-w · Cited by 52
Wingo, T. S., Duong, D. M., Zhou, M., Dammer, E. B., Wu, H., Cutler, D. J., Lah, J. J., Levey, A. I., & Seyfried, N. T. (2017) · Journal of Proteome Research · doi:10.1021/acs.jproteome.7b00324 · Cited by 51
Self-citationDown‐regulation of glutamatergic terminals (VGLUT1) driven by Aβ in Alzheimer's disease
Rodriguez‐Perdigon, M., Tordera, R. M., Gil-Bea, F. J., Gereñu, G., Ramírez, M. J., & Solas, M. (2016) · Hippocampus · doi:10.1002/hipo.22607 · Cited by 49
Seddighi, S., Varma, V. R., An, Y., Varma, S., Beason‐Held, L. L., Tanaka, T., Kitner‐Triolo, M. H., Kraut, M. A., Davatzikos, C. A., & Thambisetty, M. (2017) · Journal of Alzheimer s Disease · doi:10.3233/jad-170557 · Cited by 41
Self-citationDynamic presenilin 1 and synaptotagmin 1 interaction modulates exocytosis and amyloid β production
Zoltowska, K. M., Maesako, M., Lushnikova, I., Takeda, S., Keller, L. J., Skibo, G., Hyman, B. T., & Berezovska, O. (2017) · Molecular Neurodegeneration · doi:10.1186/s13024-017-0159-y · Cited by 36
Ou-Yang, M.-H., & Van Nostrand, W. E. (2013) · Journal of Neuroinflammation · doi:10.1186/1742-2094-10-134 · Cited by 30
Behnke, J. A., Cheedalla, A., Bhatt, V., Bhat, M., Teng, S. L., Palmieri, A. J., Windon, C., Thakker‐Varia, S., & Alder, J. (2017) · International Journal of Molecular Sciences · doi:10.3390/ijms18030612 · Cited by 29
Multiscale causal network models of Alzheimer’s disease identify VGF as a key regulator of diseasePreprint
Beckmann, N., Lin, W.-J., Wang, M.-H., Cohain, A., Wang, P., Ma, W., Wang, Y.-C., Jiang, C., Audrain, M., Comella, P., et al. (2018) · bioRxiv (Cold Spring Harbor Laboratory) · doi:10.1101/458430 · Cited by 12
Self-citation
Cited by
Sorted by citations
Brain energy rescue: an emerging therapeutic concept for neurodegenerative disorders of ageing
Cunnane, S. C., Trushina, E., Morland, C., Prigione, A., Casadesus, G., Andrews, Z. B., Beal, M. F., Bergersen, L. H., Brinton, R. D., de la Monte, S., et al. (2020) · Nature Reviews Drug Discovery · doi:10.1038/s41573-020-0072-x · Cited by 1,003
Deep Multilayer Brain Proteomics Identifies Molecular Networks in Alzheimer’s Disease Progression
Bai, B., Wang, X., Li, Y., Chen, P.-C., Yu, K., Dey, K. K., Yarbro, J. M., Han, X., Lutz, B. M., Rao, S., et al. (2020) · Neuron · doi:10.1016/j.neuron.2019.12.015 · Cited by 565
“Analysis of proteome in AD and during aging has been attempted (Seyfried et al., 2017; Wingo et al., 2019).”
BackgroundSelf-citationJohnson, E. C. B., Carter, E. K., Dammer, E. B., Duong, D. M., Gerasimov, E. S., Liu, Y., Liu, J., Betarbet, R., Ping, L., Yin, L., et al. (2022) · Nature Neuroscience · doi:10.1038/s41593-021-00999-y · Cited by 561
Self-citationCai, Y., Song, W., Li, J., Jing, Y., Liang, C., Zhang, L., Zhang, X., Zhang, W., Liu, B., An, Y., et al. (2022) · Science China Life Sciences · doi:10.1007/s11427-022-2161-3 · Cited by 450
Bao, H., Cao, J., Chen, M., Min, C., Chen, W., Chen, X., Chen, Y., Chen, Y., Chen, Y., Chen, Z., et al. (2023) · Science China Life Sciences · doi:10.1007/s11427-023-2305-0 · Cited by 402
Metadata
- Authors
- Wingo, A. P., Dammer, E. B., Breen, M. S., Logsdon, B. A., Duong, D. M., Troncosco, J. C., Thambisetty, M., Beach, T. G., Serrano, G. E., Reiman, E. M., Caselli, R. J., Lah, J. J., Seyfried, N. T., Levey, A. I., & Wingo, T. S.
- Affiliations
- Emory University (US)
- Icahn School of Medicine at Mount Sinai (US)
- Sage Bionetworks (US)
- Johns Hopkins University (US)
- National Institutes of Health (US)
- Banner Sun Health Research Institute (US)
- University of Arizona (US)
- Mayo Clinic (US)
- Corresponding author
- Seyfried, Nicholas T.
- ORCID
- Venue
- Nature Communications
- Published
- 2019-04-08
- Volume
- 10
- Issue
- 1
- Pages
- 1619-1619
- ISSN
- 2041-1723 (ISSN-L)
- PMC
- PMC6453881
- OpenAlex
- W2937979781
- Semantic Scholar
- 51944265c33e2326e17cfb3aa6324c6364c80f42
- Cited by
- 211
- References
- 78
- Citations by year
- 2026: 19 · 2025: 19 · 2024: 38 · 2023: 37 · 2022: 29 · 2021: 33 · 2020: 28 · 2019: 8
- FWCI
- 4.12
- Type
- journal article
- Language
- en
- Open access
- gold
- doi.org
- Locations
- Nature Communications (publishedVersion, cc-by)
- bioRxiv (Cold Spring Harbor Laboratory) (acceptedVersion)
- Europe PMC (PubMed Central) (publishedVersion, cc-by)
- PubMed Central (publishedVersion, cc-by)
- PubMed (publishedVersion)
- UA Campus Repository (The University of Arizona) (acceptedVersion, cc-by)
- RePEc: Research Papers in Economics (submittedVersion)
- DOAJ (DOAJ: Directory of Open Access Journals) (submittedVersion, cc-by-sa)
- DOAJ (DOAJ: Directory of Open Access Journals) (submittedVersion)
- eScholarship (California Digital Library) (submittedVersion, cc-by)
- Funders
- U.S. Department of Veterans Affairs (I01BX003853, IK2 BX001820)
- Michael J. Fox Foundation for Parkinson's Research (U24 NS072026, 05-901, 211002, 11060, P30 AG19610)
- Alzheimer's Association (P50 AG025688, 11060)
- Emory University (P50AG025688, AG025688)
- Arizona Department of Health Services (P30 AG19610, P50 AG025688, U24 NS072026, 05-901, 211002, Contract 211002)
- Weston Brain Institute (11060)
- Arizona Biomedical Research Commission (P30 AG19610, 05–901, Contracts 4001, 0011, 05‐901 and 1001, U24 NS072026, 4001, 0011, 05-901, and 1001, 211002)
- Alzheimer's Disease Research Center, Emory University (P50 AG025688, AG025688)
- National Institute on Aging (211002, P30-AG-19610, R01AG056533, AG 025688, AG-19610, R01AG057911, AG057911, U01AG061357, I01 BX003853, P30AG019610, U01AG046161, 05-901, AG056533, AG061800, P50AG025688, R01AG053960, R01AG061800)
- National Institute of Mental Health (U01MH115484)
- National Institute of Neurological Disorders and Stroke (NS055077, NS072026, 211002, P30NS055077, U24NS072026, 05-901, U24 NS072026 National Brain, P30 AG19610)
- Topics
- Health Sciences › Medicine › Psychiatry and Mental health › Dementia and Cognitive Impairment Research
- Life Sciences › Neuroscience › Cellular and Molecular Neuroscience › Alzheimer's disease research and treatments
- Physical Sciences › Chemistry › Spectroscopy › Advanced Proteomics Techniques and Applications
- Keywords
- cognitive trajectories, aging, human brain proteome, proteome-wide association study, cognitive stability, cognitive decline, mitochondrial activity, synaptic proteins, neuroinflammation, apoptosis, neuropathology, protein co-expression networks, hub proteins, older adults
- MeSH terms
- Biological Variation, Population, Aged, Aged, 80 and over, Aging, Alzheimer Disease, Brain, Cognition, Humans, Middle Aged, Parkinson Disease, Proteome, Proteomics, Healthy Volunteers
About these checks
Registry, retraction, Cites and statistics results are computed, not judged, with one exception: a printed reference that no index lists is read once by a model before it counts as a citation error. Claims are extracted by a model and kept only when their quote appears verbatim in the text; each cited source is then checked, with a model’s help, for whether it says what the claim relies on. Those verdicts can be wrong — read the claim’s quote and the cited source before relying on one.
A language model drew the claims from the paper on 2026-10-10, under version 3 of the claim definition (model deepseek-v4.1-flash, prompt extract-v3).
A second model labelled each claim on 2026-10-10 (model jev-1.13-20260917, definition revision gold-guideline-v0.2).
Cited sources are checked with a language model’s help (gpt-6-sol).
Statistics and arithmetic are recomputed, not judged.
Confidence bands are shown only for fields calibrated on our annotated test set. None is calibrated yet, so no band is shown.
What counts as a claim ›How we measure confidence ›How we check this ›
Are you an author, or do you see a problem with this page? Request a review
