

The DOI matches its Crossref record; 40 of the 40 references it cites were found in a registry or an index.
Gut microbiota confers host resistance to obesity by metabolizing dietary polyunsaturated fatty acids
Open accessAbstract
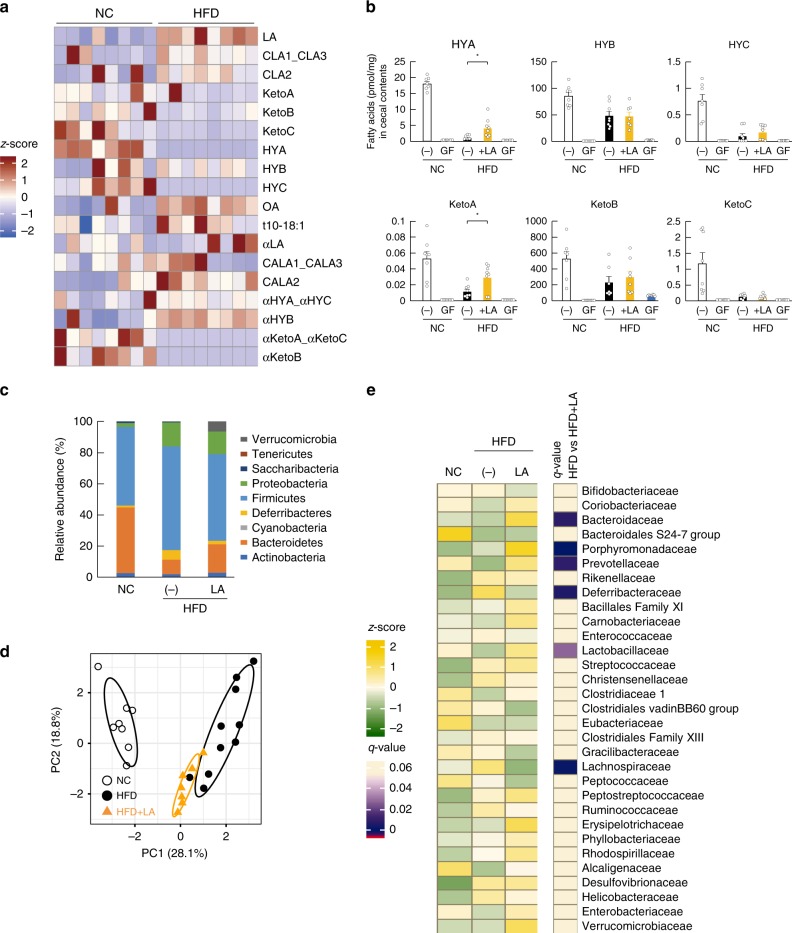
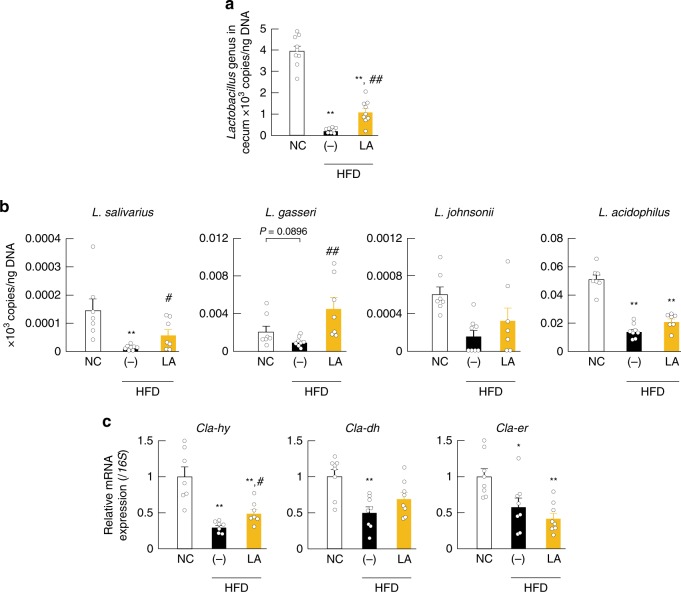
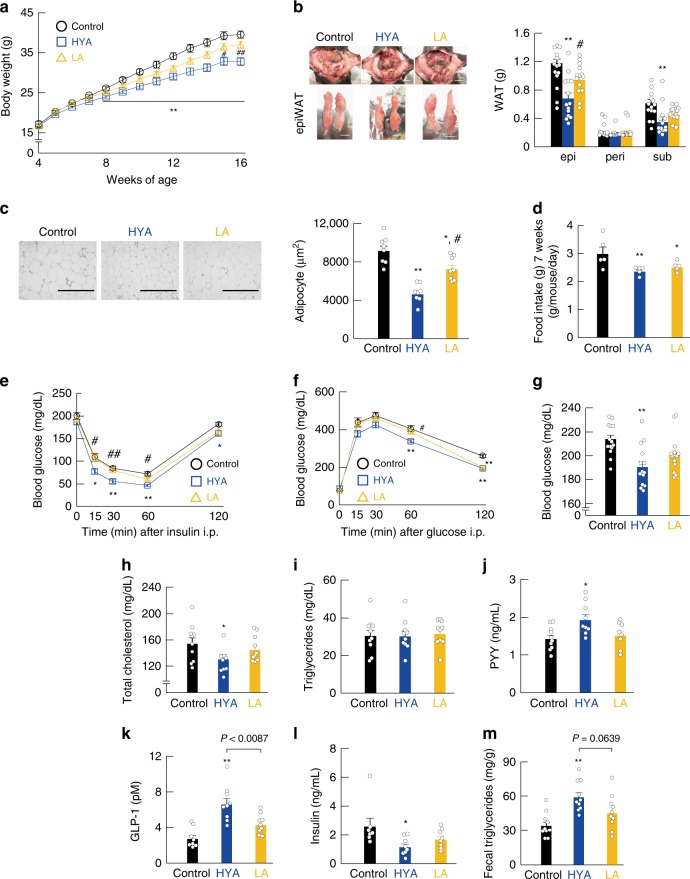
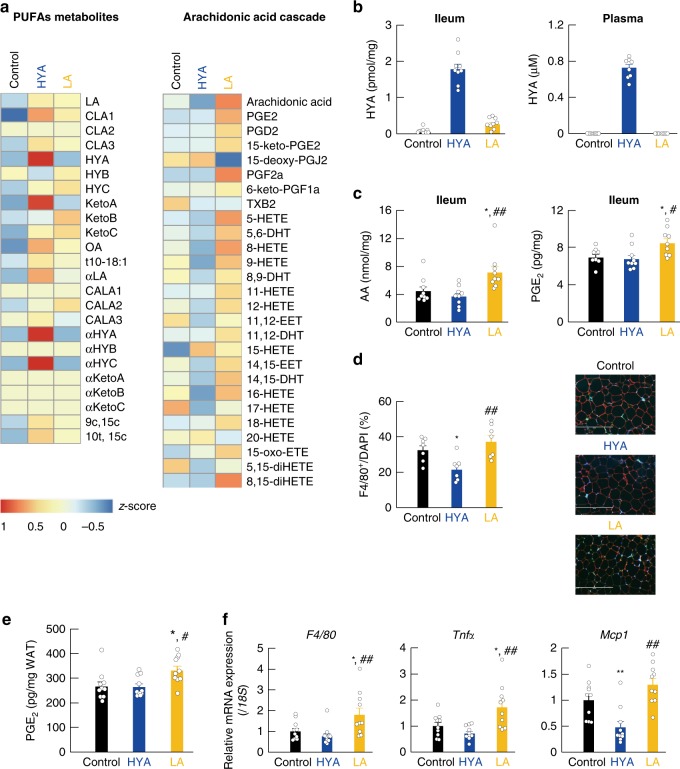
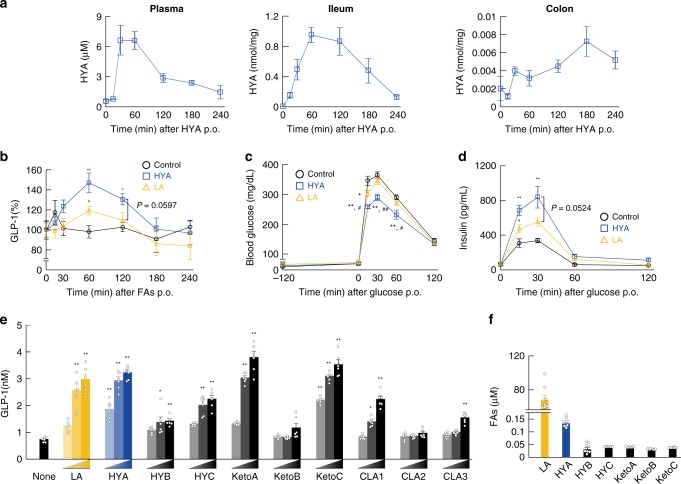
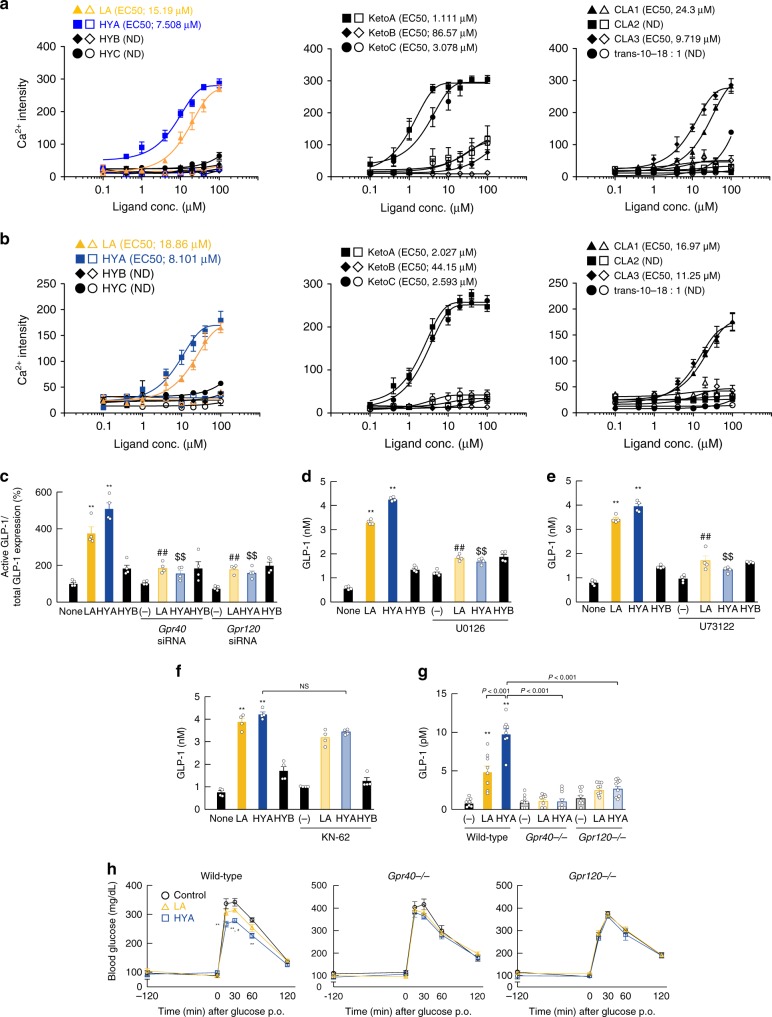
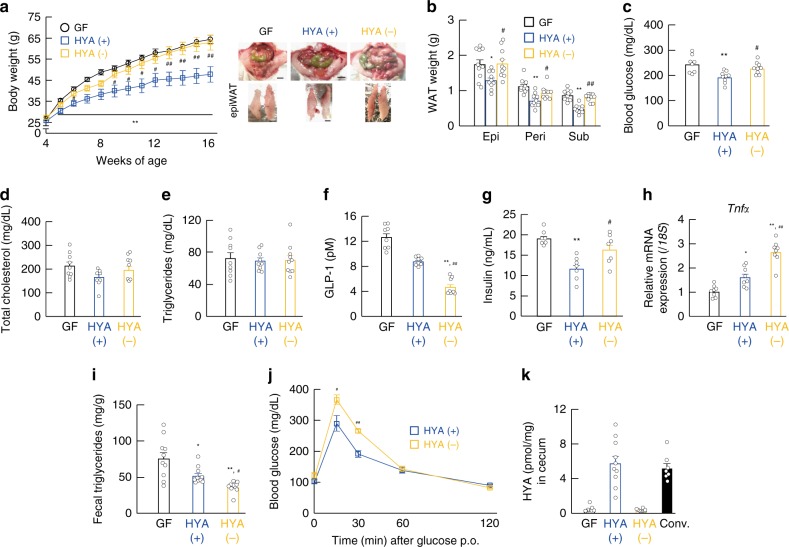
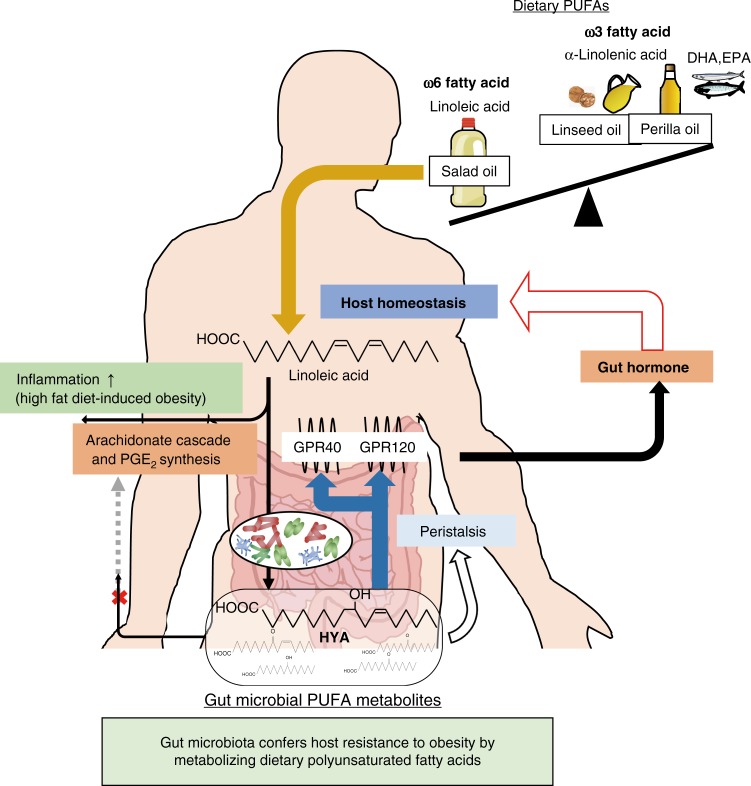
Gut microbiota mediates the effects of diet, thereby modifying host metabolism and the incidence of metabolic disorders. Increased consumption of omega-6 polyunsaturated fatty acid (PUFA) that is abundant in Western diet contributes to obesity and related diseases. Although gut-microbiota-related metabolic pathways of dietary PUFAs were recently elucidated, the effects on host physiological function remain unclear. Here, we demonstrate that gut microbiota confers host resistance to high-fat diet (HFD)-induced obesity by modulating dietary PUFAs metabolism. Supplementation of 10-hydroxy- cis -12-octadecenoic acid (HYA), an initial linoleic acid-related gut-microbial metabolite, attenuates HFD-induced obesity in mice without eliciting arachidonic acid-mediated adipose inflammation and by improving metabolic condition via free fatty acid receptors. Moreover, Lactobacillus -colonized mice show similar effects with elevated HYA levels. Our findings illustrate the interplay between gut microbiota and host energy metabolism via the metabolites of dietary omega-6-FAs thereby shedding light on the prevention and treatment of metabolic disorders by targeting gut microbial metabolites.
Overview
The claims and statistics of this paper haven’t been checked yet.
Run the check — free, no account needed. It reads the open-access text and checks the sources it cites.
Integrity signals
Registry
Cites
Statistics
Figures
Verification
Claims the paper makes
The claims and statistics of this paper haven’t been checked yet.
Run the check — free, no account needed. It reads the open-access text and checks the sources it cites.
Claims other papers make about this one
Each is checked against this paper’s own text: does it say what the citing paper says it does?
In the citing paper
“The secretion of GLP-1 is modulated by the gut microbiota”
From Microbiota–gut–brain axis and its therapeutic applications in neurodegenerative diseases (2024) · cites this paper as [437]
Self-check
Percentages, sums and reported differences re-computed from the paper’s own numbers.
The self-check needs the paper’s full text.
Citations
Cites
An obesity-associated gut microbiome with increased capacity for energy harvest
Turnbaugh, P. J., Ley, R. E., Mahowald, M. A., Magrini, V., Mardis, E. R., & Gordon, J. I. (2006) · Nature · doi:10.1038/nature05414 · Cited by 12,444
Human gut microbes associated with obesity
Ley, R. E., Turnbaugh, P. J., Klein, S., & Gordon, J. I. (2006) · Nature · doi:10.1038/4441022a · Cited by 8,785
A core gut microbiome in obese and lean twins
Turnbaugh, P. J., Hamady, M., Yatsunenko, T., Cantarel, B. L., Duncan, A., Ley, R. E., Sogin, M. L., Jones, W. J., Roe, B. A., Affourtit, J. P., et al. (2009) · Nature · doi:10.1038/nature07540 · Cited by 7,823
Mechanisms linking obesity to insulin resistance and type 2 diabetes
Kahn, S. E., Hull, R. L., & Utzschneider, K. M. (2006) · Nature · doi:10.1038/nature05482 · Cited by 5,448
Turnbaugh, P. J., Bäckhed, F., Fulton, L., & Gordon, J. I. (2008) · Cell Host & Microbe · doi:10.1016/j.chom.2008.02.015 · Cited by 2,915
Oh, D. Y., Talukdar, S., Bae, E. J., Imamura, T., Morinaga, H., Fan, W., Li, P., Lu, W. J., Watkins, S. M., & Olefsky, J. M. (2010) · Cell · doi:10.1016/j.cell.2010.07.041 · Cited by 2,428
An Increase in the Omega-6/Omega-3 Fatty Acid Ratio Increases the Risk for Obesity
Simopoulos, A. P. (2016) · Nutrients · doi:10.3390/nu8030128 · Cited by 1,673
Free fatty acids regulate gut incretin glucagon-like peptide-1 secretion through GPR120
Hirasawa, A., Tsumaya, K., Awaji, T., Katsuma, S., Adachi, T., Yamada, M., Sugimoto, Y., Miyazaki, S., & Tsujimoto, G. (2004) · Nature Medicine · doi:10.1038/nm1168 · Cited by 1,580
Self-citationFree fatty acids regulate insulin secretion from pancreatic β cells through GPR40
Itoh, Y., Kawamata, Y., Harada, M., Kobayashi, M., Fujii, R., Fukusumi, S., Ogi, K., Hosoya, M., Tanaka, Y., Uejima, H., et al. (2003) · Nature · doi:10.1038/nature01478 · Cited by 1,538
Kimura, I., Ozawa, K., Inoue, D., Imamura, T., Kimura, K., Maeda, T., Terasawa, K., Kashihara, D., Hirano, K., Tani, T., et al. (2013) · Nature Communications · doi:10.1038/ncomms2852 · Cited by 1,512
Self-citation
Cited by
Sorted by citations
Items 301–392 of 392
The cutaneous microbiome: microbial remodeling of the skin lipid landscape
Khalil, S. B., & Kowalski, C. H. (2026) · mSphere · doi:10.1128/msphere.00648-25 · Cited by 3
Lu, D., Jin, S., Yang, R., Wu, Q., Deng, L., Jia, M., Wang, F., & Nie, K. (2024) · Industrial Crops and Products · doi:10.1016/j.indcrop.2024.118046 · Cited by 3
Analysis of lipid metabolites derived from gut microbiota in ischemia-reperfusion model
Nakatsutsumi, K., Morishita, K., Costantini, T. W., Adachi, T., Suekane, A., Suzuki, K., Kojima, M., Arita, M., & Otomo, Y. (2023) · The Journal of Trauma: Injury, Infection, and Critical Care · doi:10.1097/ta.0000000000004230 · Cited by 2
“11 In a prior study of trauma patients, it was reported that gut microbial diversity was associated with gut inflammation.”
BackgroundSelf-citationClostridium butyricum Ameliorates Atherosclerosis by Regulating Host Linoleic Acid Metabolism
Yin, C., Fan, P., Mou, X., & Zhao, W. (2025) · Microorganisms · doi:10.3390/microorganisms13061220 · Cited by 2
“…given that linoleic acid exacerbates adiposity by enhancing the abundance of ARA cascade-associated PUFA metabolites in obesogenic environments [59], our findings collectively suggest that C. butyricum may confer dual therapeutic benefits against both AS and obesity through coordinated…”
Park, Y., Chung, M., Kim, J., Lee, Y., Lee, S., & Park, J. (2025) · Journal of Agricultural and Food Chemistry · doi:10.1021/acs.jafc.5c03973 · Cited by 2
Metabotherapy for intestinal disease: using metabolites to prevent and treat disorders of the gut
Liu, S., Domingo‐Vidal, M., Madhu, B., Binyamin, D., Thaiss, C. A., & Levy, M. (2026) · Nature Reviews Gastroenterology & Hepatology · doi:10.1038/s41575-026-01178-9 · Cited by 5
“Succinate is, in fact, used as a gluconeogenic substrate in the intestine.”
Microbial 10-oxostearic acid protects mice against colitis via the nuclear receptor PPARα
Liu, J., Li, H., Tian, Y., Guo, M., Sahin, C., Kamata, S., Honda, A., Campbell, J., Shi, J., Yurtal, E. D., et al. (2026) · Nature Microbiology · doi:10.1038/s41564-026-02321-7 · Cited by 2
“These results show that 10-oxoSA and, to a lesser extent, 10-HSA have potential to regulate PPARα activity at expected physiological concentrations 12,24 .”
InfluentialGut microbiota reshapes host energy metabolism to modulate depressive behaviors
Lei, P., Qi, Z., Ma, Q., Zhao, B., Wen, B., Jiang, W., Xi, W., Liu, Y., 寻玉凤, Zhang, S., et al. (2026) · Gut Microbes · doi:10.1080/19490976.2026.2662556 · Cited by 3
“51,52 Notably, Fusicatenibacter saccharivorans , a short-chain fatty acid (SCFA)-producing bacterium, is significantly depleted in patients with MDD 53 and positively correlated with better cognitive performance.”
Saika, A., & Kunisawa, J. (2021) · YAKUGAKU ZASSHI · doi:10.1248/yakushi.20-00243-3 · Cited by 2
Mitchell, C. M., Piaggi, P., O’Brien, D. M., Krakoff, J. A., & Votruba, S. B. (2021) · Obesity · doi:10.1002/oby.23167 · Cited by 2
Leveraging the Microbiome for Obesity: Moving From Form to Function
Lee, A. H., Manly, A., & Dong, T. S. (2022) · Frontiers in Endocrinology · doi:10.3389/fendo.2022.918923 · Cited by 2
“Further, FMTs from HFD-fed mice supplemented with a PUFA metabolite enhanced glycemic control compared to those from mice without supplementation (63).”
MethodArreaza‐Gil, V., Ávila‐Román, J., Escobar‐Martínez, I., Muguerza, B., Suárez, M., Arola‐Arnal, A., & Torres‐Fuentes, C. (2023) · Nutrients · doi:10.3390/nu15030707 · Cited by 2
“In fact, a strong correlation between these gut microbes and plasma OXLs profile has been recently reported by our group and others [25,29].”
BackgroundGut-brain axis: The role of gut microbiota in energy balance and body weight regulation
Tatık, G. P., Baran, Ö., & Dağ, A. (2024) · Clinical Science of Nutrition · doi:10.62210/clinscinutr.2024.98 · Cited by 3
“62 To date, it has not been investigated how these ketone bodies affect the hypothalamus via GPR41/43, and more research is needed.”
Harnessing Probiotics: Exploring the Role of the Gut Microbiome in Combating Obesity
Riyasdeen, A., Kunnathodi, F., Arafat, A. A., Azmi, S., Mustafa, M., Ahmad, I., & Alotaibi, H. F. (2025) · Probiotics and Antimicrobial Proteins · doi:10.1007/s12602-025-10605-3 · Cited by 3
“The active gut microbiota produces a wide range of physiologically active compounds, including SCFAs (Short-Chain Fatty Acids), vitamins, and health-promoting compounds such as antioxidants, analgesics, and anti-inflammatory agents [27].”
Alves, A. M., Silva, M. M. D. A., Lima, M. S., de Souza, E. L., & Naves, M. M. V. (2023) · Journal of Applied Microbiology · doi:10.1093/jambio/lxad206 · Cited by 2
Fatty acid hydratases for hydroxy fatty acid bioproduction
Heng, Y. C., & Kittelmann, S. (2025) · Invention Disclosure · doi:10.1016/j.inv.2025.100037 · Cited by 1
Microbe-derived cyclopropane lipids activate host nuclear receptors
Massey, W. J., & Brown, J. M. (2025) · Journal of Lipid Research · doi:10.1016/j.jlr.2025.100923 · Cited by 1
“…study showed that several Bifidobacterium and Lactobacillus species encode enzymes called linoleate oxidoreductase (CLA-DH) and lino-leate hydratase (CLA-HY) that convert dietary linoleic acid (LA = 18:2, w-6) to LA derivatives in the CLA family including 10-hydroxy-cis -12-octadecenoic acid (9).”
Inter-kingdom lipid messengers sustain gut harmony
Hou, J., & Song, X. (2025) · Cell Host & Microbe · doi:10.1016/j.chom.2025.09.003 · Cited by 1
Li, Y., Li, J., Zhang, F., Liang, Z., Lan, M., Kang, W., & Zhang, Y. (2025) · International Journal of Biological Macromolecules · doi:10.1016/j.ijbiomac.2025.149679 · Cited by 1
Sitong, C. H. E. N., Hanying, X. U., ZHANG, Z., Xiaonan, L. I., Tang, X., & Dashi, Y. I. N. G. (2025) · Chinese Journal of Analytical Chemistry · doi:10.1016/j.cjac.2025.100625 · Cited by 1
Self-citationPostbiotics: Technical aspects, quality control, and regulatory aspects
Hosseinzadeh, N., Ashkezary, M. R., Bazdar, M., Sabahi, S., & Abbasi, A. (2026) · Elsevier eBooks · doi:10.1016/b978-0-443-33116-9.00007-3 · Cited by 1
Application of postbiotics as an emerging concept for the development of food packaging
Hashemi, N., Asqardokht-Aliabadi, A., Ashkezary, M. R., Hosseinzadeh, N., & Abbasi, A. (2026) · Elsevier eBooks · doi:10.1016/b978-0-443-33116-9.00013-9 · Cited by 1
Metabolic syndrome and a broken heart: trust your gut or risk your heart
Salomon, J., Karl, A., Ahmad, R., Bastola, D. K., Singh, A. B., & Mishra, P. K. (2026) · American Journal of Physiology-Heart and Circulatory Physiology · doi:10.1152/ajpheart.00482.2025 · Cited by 2
Guo, J., Du, M., & Wang, Y. (2026) · Food & Function · doi:10.1039/d5fo01634g · Cited by 1
Anti-Obesogenic Effects of Culinary Herbs Through Modulation of Inflammation and Metabolic Pathways
Winiarska‐Mieczan, A., Tomczyk‐Warunek, A., Jachimowicz-Rogowska, K., Kwiecień, M., Czernecki, T., Lis, M., & Kazimierczak, W. (2026) · Nutrients · doi:10.3390/nu18060993 · Cited by 1
“Conversely, research indicates that a high omega-6/omega-3 PUFA ratio diminishes the beneficial effects of omega-3 on gut microbial diversity and abundance, whereas a balanced ratio promotes a healthier microbiota profile [113].”
The 3M roles of the gut microbiome in pharmacotherapy for diabetes: mediator, modifier, and marker
Seo, J. I., Koh, A., Lim, S. K., & Yoo, H. H. (2026) · Trends in Endocrinology and Metabolism · doi:10.1016/j.tem.2025.12.006 · Cited by 1
Gaggini, M., Suman, A. F., & Vassalle, C. (2026) · Metabolites · doi:10.3390/metabo16040265 · Cited by 1
“Conversely, the gut microbiota may metabolize polyunsaturated fatty acids towards metabolites beneficial for the development of obesity and inflammation [72].”
The interplay between the microbiome and immune cells in metabolic homeostasis and disease
Shapiro, H., Jickeli, B., Niv, I., Ernan, B., & Elinav, E. (2026) · Cell Metabolism · doi:10.1016/j.cmet.2026.06.004 · Cited by 2
Zhevlakova, I., Molokotina, I., Burrows, A. C., Horak, A. J., Sangwan, N., Brown, J. M., Podrez, E. A., & Byzova, T. V. (2026) · Journal of Investigative Dermatology · doi:10.1016/j.jid.2026.06.1288 · Cited by 1
Acierno, C., Caturano, A., Barletta, F., Rinaldi, L., Sasso, F. C., Adinolfi, L. E., & Nevola, R. (2026) · Frontiers in Physiology · doi:10.3389/fphys.2026.1881697 · Cited by 1
Microbial metabolites as emerging Biomodulators of host function and disease susceptibility
Hunzai, H., Ansari, A. A., Ghazanfar, S., Islam, A., Elkelish, A., Das, J., Chaudhary, P., Sridhar, S. B., Panigrahy, U. P., Mantry, S., et al. (2026) · PharmaNutrition · doi:10.1016/j.phanu.2026.100523 · Cited by 2
Li, Y., Mao, J., Deng, Y., Ge, X., Nie, L., Wang, Q., Wang, R., Zhang, J., Lyu, T., Zhao, L., et al. (2026) · Immunity Inflammation and Disease · doi:10.1002/iid3.70470 · Cited by 1
Bacterial indole‐3‐butyric acid promotes fish PUFA synthesis
Li, R., Yuan, B., Yi, X., Lin, J., Huang, B., Yin, E., Zhou, J., Min, Q., Lv, M., Zhang, B., et al. (2026) · iMetaOmics. · doi:10.1002/imo2.70136 · Cited by 1
Bioactive lipids and gut microbiota interact to regulate health and disease
Das, U. N. (2021) · Elsevier eBooks · doi:10.1016/b978-0-12-821039-0.00011-3 · Cited by 1
Ichimura, A. (2021) · Biological and Pharmaceutical Bulletin · doi:10.1248/bpb.b21-00296 · Cited by 1
Self-citationDietary Fatty Acids, Gut Microbiome, and Gut–Brain Communication: A Current Perspective
Anand, S. K., Sukrutha, S. K., Shilpa, B. R., & Nagarathna, A. (2022) · Nutritional neurosciences · doi:10.1007/978-981-19-4530-4_8 · Cited by 1
Xue, F., Mo, Q., Ma, P., Zhang, J., Wang, S., Zheng, C., Sun, Y., Liu, M., Yang, Z., & Bai, H. (2022) · Frontiers in Nutrition · doi:10.3389/fnut.2022.949809 · Cited by 1
“Increased PUFAs of KPM effectively increased the Bacteroidetes to Firmicutes ratio and proliferated Actinobacteria and Proteobacteria, while decreasing the growth of Enterobacteria (6, 26, 27).”
BackgroundDu, S., Tu, X., Duan, X., Wan, H., Ai, Z., Luo, J., Zou, Z., & Luo, L. (2024) · Journal of Agricultural and Food Chemistry · doi:10.1021/acs.jafc.4c05629 · Cited by 1
Beppu, F., 藤翔太, Kim, H.-R., HOU, C. T., Miyashita, K., & Hosokawa, M. (2024) · Biocatalysis and Agricultural Biotechnology · doi:10.1016/j.bcab.2024.103390 · Cited by 1
Yamamoto, Y., Narumi, K., Yamagishi, N., Yonejima, Y., Iseki, K., Kobayashi, M., & Kanai, Y. (2025) · Acta Diabetologica · doi:10.1007/s00592-025-02459-6 · Cited by 2
“Oral administration of linoleic acid, included in long-chain fatty acid, two hours before an oral glucose tolerance test (OGTT) reportedly ameliorated postprandial hyperglycemia by promotion of insulin secretion via GPR40 pathway in mice [3].”
InfluentialYadav, M. K., Kim, H., Han, S.-Y., Son, C.-G., & Wang, J.-H. (2025) · Natural Product Communications · doi:10.1177/1934578x251331114 · Cited by 1
“30,31 The gut microbiota plays a key role in regulating host lipid metabolism through mechanismssuchasfermentation, bileacidmodi fi cation, serotonin production, and modulation of in fl ammation.”
Ueda, M., Okahashi, N., & Arita, M. (2023) · Wiley eBooks · doi:10.1002/9783527836512.ch27 · Cited by 1
Self-citationMouannes, N., Burrows, A. C., Horak, A. J., Varadharajan, V., Dutta, S., Mahen, K. K., Banerjee, R., Massey, W. J., Ye, X., Mrdjen, M., et al. (2026) · bioRxiv (Cold Spring Harbor Laboratory) · doi:10.64898/2026.02.16.705588 · Cited by 1
Morgan, J., Howick, S., & Belton, V. (2010)
Woodward, R. B., Hoffmann, R., 伊東, 椒., & 遠藤, 勝. (1971) · 広川書店 eBooks
Yang, B. K. (2020) · Gut Microbes · doi:10.1080/19490976.2020.1728184
“In defense of the work, we would like to emphasize that 10-HOE is a novel functional fatty acid and has some protective effects on the host.(14,15) In this respect, the results presented are valid and meaningful for 10-HOE and its producer but not for CLA in our opinion based on the evidence presented above.”
BackgroundFaculty Opinions recommendation of Signaling networks in immunometabolism.
Kane, L. (2020) · Faculty Opinions – Post-Publication Peer Review of the Biomedical Literature · doi:10.3410/f.737610223.793578145
Preventive and Therapeutic Role of Probiotics in Type-2 Diabetes and Its Associated Complications
Subramani, S. K., Raghuwanshi, S., & Sharma, R. (2022) · Springer eBooks · doi:10.1007/978-981-16-8444-9_7
Zhuang, Y., Yang, S., Yang, D., Gu, X., Wang, Y., Chen, Y., Wang, Z., & Chen, R. (2022) · Research Square · doi:10.21203/rs.3.rs-2195035/v1
Miyamoto, J. (2022) · KAGAKU TO SEIBUTSU · doi:10.1271/kagakutoseibutsu.60.15
Self-citationEffects of fatty acid‐ethanol amine ( FA‐EA ) derivatives on lipid accumulation and inflammation
Li, M., Huang, X., Huang, M., Jin, W., Hong, Z., Zhang, Y., Fang, H., & Chen, W. (2023) · Lipids · doi:10.1002/lipd.12368
Zhuang, Y., Yang, S., Yang, D., Gu, X., Wang, Y., Chen, Y., Wang, Z., & Chen, R. (2024) · Research Square · doi:10.21203/rs.3.rs-2195035/v2
Interrelation between gut microbiota and bronchial asthma
Potaman, A. M., Pyatysheva, P. A., Plotnikova, K. A., Kobak, M.-M. M., Abdusalamov, A. R., & Raevskii, K. P. (2024) · Russian Medicine · doi:10.17816/medjrf627266
Miyamoto, J., Ando, Y., Yamano, M., Nishida, A., Murakami, K., & Kimura, I. (2024) · Research Square · doi:10.21203/rs.3.rs-4701795/v1
Self-citationMiyamoto, T., Tsuruta, T., Teraoka, M., Wang, T., & Nishino, N. (2024) · Nutrients · doi:10.3390/nu16172824
“…contribute to human health by producing vitamins [1] and bioactive molecules such as sphingolipids [2] and 10-hydroxy-cis-12-octadecenoic acid [3], metabolizing indigestible carbohydrates into short-chain fatty acids (SCFAs) [4], educating the host immune system [5], strengthening gut barrier…”
BackgroundTan, L., Zhong, M., Zhao, Y., Feng, Y., Ye, Q., Hu, J., Ou-Yang, Z.-Y., Chen, N.-X., Su, X.-L., Zhang, Q., et al. (2024) · Nutrition & Metabolism · doi:10.1186/s12986-024-00882-0
“Recent evidence also suggests that the composition of gut microbiota could be an important factor linking BMI and PUFAs [15].”
InfluentialJanssenDuijghuijsen, L. M., Fransen, K., Deng, R., Perenboom, C. W. M., de Wit, N. J. W., Hooiveld, G. J. E. J., & van Trijp, M. P. H. (2025) · Current Developments in Nutrition · doi:10.1016/j.cdnut.2025.104564 · Cited by 3
The Role of Microbiome in Metabolic Pattern Changes
Akool, E., Shatat, A.-A. S., & Balah, A. (2025) · Springer eBooks · doi:10.1007/978-981-96-1305-2_13
Hirata, Y., Nomura, K., Hozumi, K., Sugawara, K., Hosokawa, Y., Uchiyama, K., Inoue, T., Nishigaki, T., Liyuan, A., Yamada, S., et al. (2025) · bioRxiv (Cold Spring Harbor Laboratory) · doi:10.1101/2025.02.25.640219
Obesity and the Gut Microbiome
Chattopadhyay, S., Hazra, R., Mallick, A., Gayen, S., & Roy, S. (2025) · BENTHAM SCIENCE PUBLISHERS eBooks · doi:10.2174/9789815324549125010006
Haroun, Y. A., Alzyoud, A., Alizadeh, M. T., Mohamed, N. A., Bendardaf, R., & Soliman, S. S. M. (2025) · Nutrition Research · doi:10.1016/j.nutres.2025.07.007
Wang, W., Zhu, E., Yang, Y., Huang, Q., Xiao, X., & Piao, S. (2025) · Frontiers in Nutrition · doi:10.3389/fnut.2025.1653855
Gut microbiome-based solutions for lifestyle-related disorders
Medina-Rodriguez, E. M., Olivares, M., Romaní‐Pérez, M., & Sanz, Y. (2025) · Elsevier eBooks · doi:10.1016/b978-0-443-29983-4.00011-9 · Cited by 1
The role of metaorganismal lipid metabolism in human health and disease
Massey, W. J., & Brown, J. M. (2025) · Immunometabolism · doi:10.1097/in9.0000000000000074
Bacterial-driven lipid remodeling in avocado fermentation via hydroxylation and oxidation routes
Tlais, A. Z. A., Losito, I., Filannino, P., Trossolo, E., Tonini, S., Garofalo, G., Farina, V., Settanni, L., Gobbetti, M., & Cagno, R. D. (2025) · Food Chemistry · doi:10.1016/j.foodchem.2025.147546
Kim, S., Lee, S., Kim, T.-Y., Lee, S.-H., Seo, S.-U., & Kweon, M.-N. (2023) · Figshare · doi:10.6084/m9.figshare.24630205
Fu, Y., Liu, L., Yan, G.-L., Yang, L., Kong, L. D., Guan, Y., Sun, H. J., Liu, C. H., Sun, Y., Han, Y., et al. (2026) · World Journal of Traditional Chinese Medicine · doi:10.4103/wjtcm.wjtcm_61_25
Overview of Obesity and Microbiota Interactions
Çatak, J., Yıldırım, E., & MEMİŞ, N. (2021) · DergiPark (Istanbul University)
Petitfils, C. (2021) · theses.fr (ABES) · doi:10.70675/bc778947z305ez4f0cz8866z05cc7ee3d466
Tan, B., He, L., Wu, Z., Sun, R., Dai, Z., & Li, C. (2026) · Environmental Science Nano · doi:10.1039/d5en00967g
Novel Health-Promoting Fatty Acids Produced from Dietary Fatty Acids by Intestinal Bacteria
Kishino, S., & Ogawa, J. (2026) · Springer eBooks · doi:10.1007/978-981-95-7068-3_31
Self-citationGut microbiota in chronic inflammation: the interplay with lipid mediators
Bao, S., & Yao, C. (2026) · Gut Microbes · doi:10.1080/19490976.2026.2667605 · Cited by 1
“25 Consistently, high-fiber dietary intervention reduces liver steatosis, improves PUFAs profiles, and lowers PGE 2 levels in patients with NAFLD.”
Li, W. D., An, Z. J., Jiang, Y. Y., Shen, Y. Y., Chen, K. L., Li, W. D., Pan, Z. X., Huang, J. M., Gao, Y. D., Lin, Z. P., et al. (2026) · animal · doi:10.1016/j.animal.2026.101851
Wang, M., Yao, Y., Li, Z., Wang, S., Yan, K., Romer, A., Li, S., Zhong, J., Su, P. X., Li, B., et al. (2026) · Pharmacological Research · doi:10.1016/j.phrs.2026.108281
Yao, M., Li, X., Li, L., Yan, H., Li, X., Xu, E., & Zhou, H. (2026) · Frontiers in Microbiology · doi:10.3389/fmicb.2026.1808318
Self-citationZhao, B., Fan, Y., Ma, Q., Zhang, J., Jin, X., Peng, Y., Xi, W., Wang, J., Yang, J., Wang, S., et al. (2026) · Molecular Psychiatry · doi:10.1038/s41380-026-03752-8
Microbiota and lipid mediators: from molecular crosstalk to therapeutic opportunities
Gökcen, B. B., Atabılen, B., Güneş, B. D., Dazıroğlu, M. E. Ç., Özer, Ş. D., Biten, A. A., Pagano, E., Nanì, M. F., Romano, B., Ağagündüz, D., et al. (2026) · Frontiers in Pharmacology · doi:10.3389/fphar.2026.1836931
“It has also been reported that HYA suppresses the growth of Helicobacter pylori and Helicobacter suis , and thus, these PUFAs metabolites exert a protective effect by preventing the colonization of pathogens (Matsui et al., 2017).”
InfluentialPetitfils, C., & Cénac, N. (2025) · Dunod eBooks · doi:10.3917/dunod.poisb.2025.01.0910
Recent Advances in Gut Microbiome Modulation in Obesity and Longevity
Hasani, A., Sedaghat, F. R., Alidoust, A., & Hasani, R. (2026) · Healthy ageing and longevity · doi:10.1007/978-3-032-24097-2_11
Tang, L., Chen, W., Bai, L., Zhang, S., Li, X., & Li, R. (2026) · Environmental Toxicology and Pharmacology · doi:10.1016/j.etap.2026.105120
Self-citationXu, M., Zhang, Y., Zhang, G., Qu, Y., Lu, R., Gao, X., Zou, J., & Song, B. (2026) · SSRN Electronic Journal · doi:10.2139/ssrn.7207509
Zhang, L., Song, X., Zhang, K., Xu, X., Guo, X., Li, W., Zeng, X., Xie, Y., Nie, L., Zhao, L., et al. (2026) · Microbial Biotechnology · doi:10.1111/1751-7915.70421
Chaudhary, A., Prajapati, N., Pathak, A., Patel, J., Patel, A., Patani, A., & Prajapati, D. (2026) · Research Square · doi:10.21203/rs.3.rs-10495994/v1
Barakat, H., Bahloul, A. H., & Abdellatif, A. A. H. (2026) · Antioxidants · doi:10.3390/antiox15091097
“As a complete food source, they provide fermentable substrates and bioactive compounds that may enhance microbial activity and preserve antioxidant balance, especially when incorporated into dietary patterns that replace low-nutrient, high-sugar meals [44,45].”
Cai, H., Li, D., Han, X., Han, Y., Zhang, R., Meng, K., & Yang, P. (2026) · PeerJ · doi:10.7717/peerj.21627
“This dichotomy is reflected in the association between chronic inflammation/metabolic disease and an unbalanced omega-6/omega-3 ratio ( Miyamoto et al., 2019 ).”
Jiang, C., Teng, Y., Xi, J., Liu, S., Yu, W., Sun, Y., Ni, A., Wang, K., Huang, J., & Huang, C. (2026) · Journal of Functional Foods · doi:10.1016/j.jff.2026.107530
Postbiotics Unveiled: The Next Emerging Trend in Functional Foods
Wahid, Z., Ahmad, A. M. R., Zulfiqar, F., Shah, S. H. B. U., & Mohammadi, N. (2026) · Food Science & Nutrition · doi:10.1002/fsn3.72485
“However, recent reports have attributed great significance to the pivotal regulation of host metabolism by the gut microbiota and their metabolic wastes (Martorell et al. 2021; Miyamoto et al. 2019; Tseng and Wu 2019; Wang et al. 2018).”
Yin, S., Fu, C., Zhang, H., Shang, Y., Liu, X., Shi, T., Yan, P., Ma, T., & Gao, Q. (2026) · Poultry Science · doi:10.1016/j.psj.2026.107963
“The gut microbiota is essential for energy acquisition and can transform food compounds into nutrients for the host depending on composition (Miyamoto et al., 2019; Faraj et al., 2024).”
Metadata
- Authors
- Miyamoto, J., Igarashi, M., Watanabe, K., Karaki, S.-I., Mukouyama, H., Kishino, S., Li, X., Ichimura, A., Irie, J., Sugimoto, Y., Mizutani, T., Sugawara, T., Miki, T., Ogawa, J., Drucker, D. J., Arita, M., Itoh, H., & Kimura, I.
- Affiliations
- Japan Agency for Medical Research and Development (JP)
- Tokyo University of Agriculture and Technology (JP)
- Shizuoka University (JP)
- Kyoto University (JP)
- Keio University (JP)
- Chiba University (JP)
- Mount Sinai Hospital (CA)
- Corresponding author
- Kimura, Ikuo
- ORCID
- Venue
- Nature Communications
- Published
- 2019-09-05
- Volume
- 10
- Issue
- 1
- Pages
- 4007-4007
- ISSN
- 2041-1723 (ISSN-L)
- PMC
- PMC6728375
- OpenAlex
- W2971602650
- Cited by
- 392
- References
- 40
- Citations by year
- 2026: 46 · 2025: 60 · 2024: 65 · 2023: 62 · 2022: 64 · 2021: 51 · 2020: 40 · 2019: 1
- FWCI
- 12.91
- Type
- journal article
- Language
- en
- Open access
- gold
- doi.org
- Locations
- Nature Communications (publishedVersion, cc-by)
- Europe PMC (PubMed Central) (publishedVersion, cc-by)
- PubMed Central (publishedVersion, cc-by)
- PubMed (publishedVersion)
- RePEc: Research Papers in Economics (submittedVersion)
- DOAJ (DOAJ: Directory of Open Access Journals) (submittedVersion, cc-by-sa)
- DOAJ (DOAJ: Directory of Open Access Journals) (submittedVersion)
- Funders
- MEXT | Japan Society for the Promotion of Science (JP15H05344, JP16H01355)
- Japan Agency for Medical Research and Development (JP18gm1010007)
- Topics
- Life Sciences › Biochemistry, Genetics and Molecular Biology › Molecular Biology › Gut microbiota and health
- Health Sciences › Nursing › Nutrition and Dietetics › Fatty Acid Research and Health
- Health Sciences › Medicine › Endocrinology, Diabetes and Metabolism › Adipokines, Inflammation, and Metabolic Diseases
- Keywords
- gut microbiota, obesity, omega-6 fatty acids, high-fat diet, linoleic acid metabolites, Lactobacillus, free fatty acid receptors, adipose tissue inflammation, arachidonic acid, energy metabolism, metabolic disorders
- MeSH terms
- Gastrointestinal Microbiome, Adipose Tissue, Animals, Cell Line, Dietary Fats, Unsaturated, Energy Metabolism, Fatty Acids, Unsaturated, Humans, Inflammation, Lactobacillus, Metabolic Diseases, Mice, Inbred C57BL, Obesity, Oleic Acids, Dietary Supplements, Linoleic Acid, Models, Animal, Fatty Acids, Omega-6, Mice, Diet, High-Fat, Diet, Western
About these checks
Registry, retraction, Cites and statistics results are computed, not judged, with one exception: a printed reference that no index lists is read once by a model before it counts as a citation error. Claims are extracted by a model and kept only when their quote appears verbatim in the text; each cited source is then checked, with a model’s help, for whether it says what the claim relies on. Those verdicts can be wrong — read the claim’s quote and the cited source before relying on one.
Statistics and arithmetic are recomputed, not judged.
Confidence bands are shown only for fields calibrated on our annotated test set. None is calibrated yet, so no band is shown.
What counts as a claim ›How we measure confidence ›How we check this ›
Are you an author, or do you see a problem with this page? Request a review
