CoChat

Single-cell transcriptomics identifies an effectorness gradient shaping the response of CD4+ T cells to cytokines

Open access

Published version of a preprint

The DOI matches its Crossref record; 89 of the 89 references it cites were found in a registry or an index.

Abstract

Naïve CD4 + T cells coordinate the immune response by acquiring an effector phenotype in response to cytokines. However, the cytokine responses in memory T cells remain largely understudied. Here we use quantitative proteomics, bulk RNA-seq, and single-cell RNA-seq of over 40,000 human naïve and memory CD4 + T cells to show that responses to cytokines differ substantially between these cell types. Memory T cells are unable to differentiate into the Th2 phenotype, and acquire a Th17-like phenotype in response to iTreg polarization. Single-cell analyses show that T cells constitute a transcriptional continuum that progresses from naïve to central and effector memory T cells, forming an effectorness gradient accompanied by an increase in the expression of chemokines and cytokines. Finally, we show that T cell activation and cytokine responses are influenced by the effectorness gradient. Our results illustrate the heterogeneity of T cell responses, furthering our understanding of inflammation.

Overview

The claims and statistics of this paper haven’t been checked yet.

Free: it reads the open-access text and checks the first 5 claims that cite a source we can check. Create a free account to check every claim.

A few free checks a day · papers already verified open instantly · results are public

Integrity signals

Registry

Crossref · 10.1038/s41467-020-15543-y

Cites

89 of 89 references verified0 citation errors · 0 not checkable

Statistics

Figures

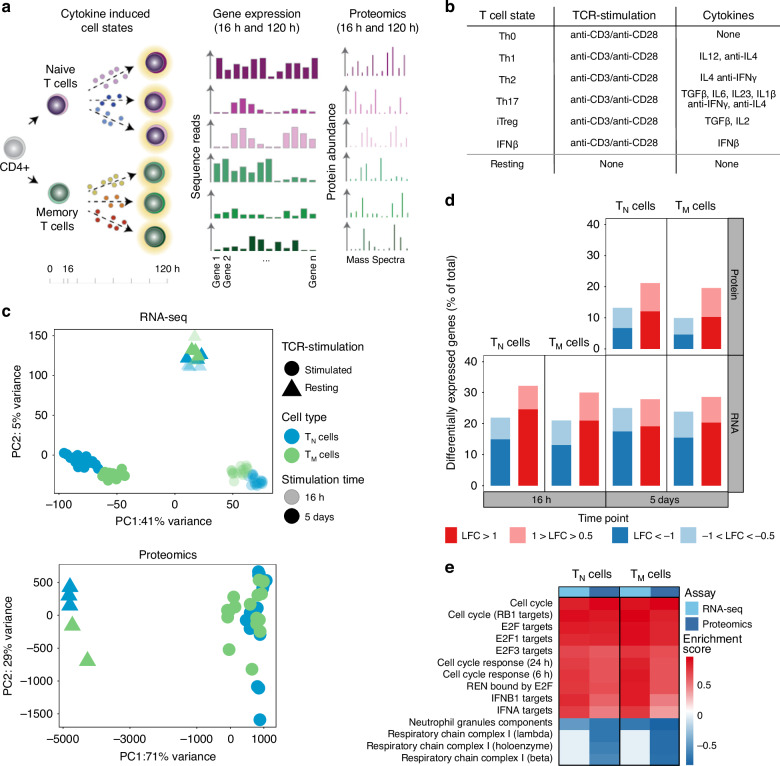
Fig. 1 TCR/CD28-activation induces cell type specific gene expression programs in CD4+ T cells. a Overview of the experimental design. b List of cytokine conditions. c PCA plots from the whole transcriptome (upper panel) and proteome (lower panel) of TN and TM cells. Different colors correspond to cell types and different shades to stimulation time points. PCA plots were derived using 47 naive and 47 memory T cell samples for RNAseq and 21 naive and 19 memory T cell samples for proteomics. d Gene expression changes at the RNA and protein levels by comparing TCR/CD28-activated (Th0) cells to resting cells. Up-regulated genes are in red and down-regulated genes are in blue. Different shades indicate different fold-change thresholds. e A selection of significantly enriched pathways (with enrichment scores > 0.7) from genes and proteins differentially expressed after 5 days of activation using the 1D enrichment method. Source data are provided as a Source Data file.
Fig. 1 TCR/CD28-activation induces cell type specific gene expression programs in CD4+ T cells. a Overview of the experimental design. b List of cytokine conditions. c PCA plots from the whole transcriptome (upper panel) and proteome (lower panel) of TN and TM cells. Different colors correspond to cell types and different shades to stimulation time points. PCA plots were derived using 47 naive and 47 memory T cell samples for RNAseq and 21 naive and 19 memory T cell samples for proteomics. d Gene expression changes at the RNA and protein levels by comparing TCR/CD28-activated (Th0) cells to resting cells. Up-regulated genes are in red and down-regulated genes are in blue. Different shades indicate different fold-change thresholds. e A selection of significantly enriched pathways (with enrichment scores > 0.7) from genes and proteins differentially expressed after 5 days of activation using the 1D enrichment method. Source data are provided as a Source Data file.CC BY · PubMed Central
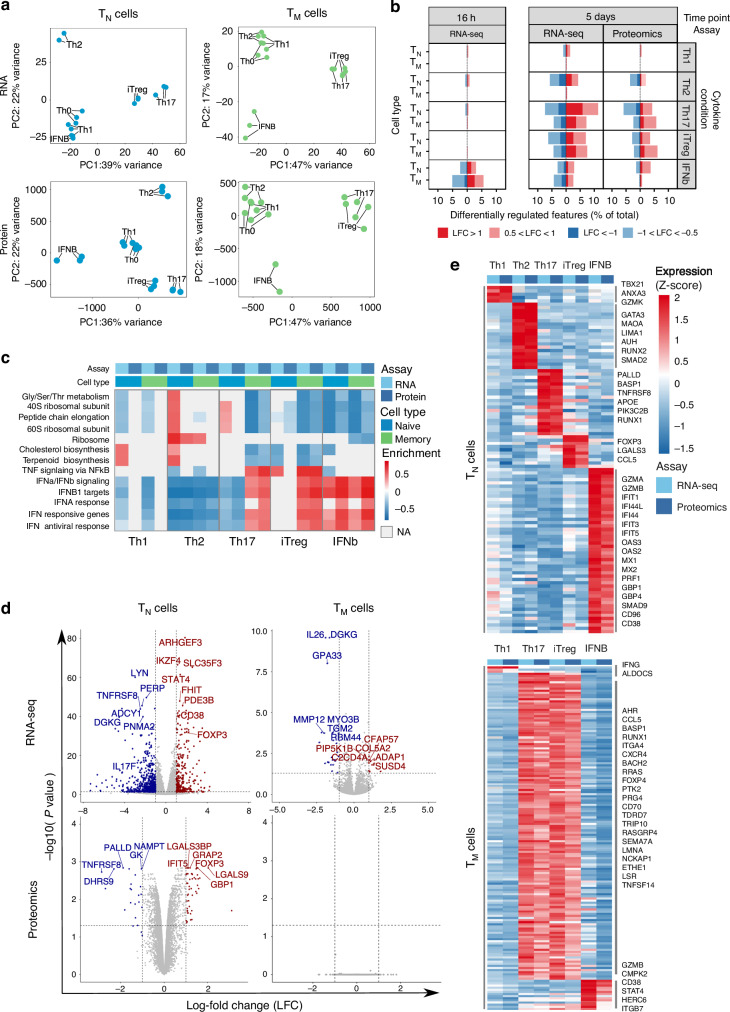
Fig. 2 Cytokines induce cell type specific gene expression programs in CD4+ T cells. a PCA plot from the full transcriptome and proteome of TN and TM cells following five days of cytokine stimulations. Only stimulated cells were included in this analysis. PCA plots were derived using 20 naive and 21 memory T cells samples RNAseq and 18 naive and 17 memory T cells for proteomics. b Gene expression changes at the RNA and protein levels from pairwise comparisons between cytokine-stimulated cells and Th0-stimulated cells. Up-regulated genes are in red and down-regulated genes are in blue. Different shades indicate different fold-change thresholds. c Selection of significantly enriched pathways (with enrichment scores > 0.7 in at least one cytokine condition) estimated using differentially expressed genes and proteins with the 1D enrichment method. Colors correspond to the enrichment score estimated for each pathway. For the pathways and conditions indicated in light gray, not enough genes were detected to reliably estimate enrichment scores (NAs). d Volcano plots highlighting significant differences in gene and protein expression between Th17 and iTreg-stimulated TN and TM cells. Red indicates expression upregulation in iTreg with respect to Th17-stimulation, blue indicates expression upregulation in Th17 with respect to iTreg-stimulation. Labels were added to IL17, FOXP3 and the top 20 most differentially expressed genes. e Cell state-specific gene signatures defined using jointly RNA and protein expression. Colours encode normalized (Z-scored) gene and protein expression levels. Example genes for each signature are labelled. Source data are provided as a Source Data file.
Fig. 2 Cytokines induce cell type specific gene expression programs in CD4+ T cells. a PCA plot from the full transcriptome and proteome of TN and TM cells following five days of cytokine stimulations. Only stimulated cells were included in this analysis. PCA plots were derived using 20 naive and 21 memory T cells samples RNAseq and 18 naive and 17 memory T cells for proteomics. b Gene expression changes at the RNA and protein levels from pairwise comparisons between cytokine-stimulated cells and Th0-stimulated cells. Up-regulated genes are in red and down-regulated genes are in blue. Different shades indicate different fold-change thresholds. c Selection of significantly enriched pathways (with enrichment scores > 0.7 in at least one cytokine condition) estimated using differentially expressed genes and proteins with the 1D enrichment method. Colors correspond to the enrichment score estimated for each pathway. For the pathways and conditions indicated in light gray, not enough genes were detected to reliably estimate enrichment scores (NAs). d Volcano plots highlighting significant differences in gene and protein expression between Th17 and iTreg-stimulated TN and TM cells. Red indicates expression upregulation in iTreg with respect to Th17-stimulation, blue indicates expression upregulation in Th17 with respect to iTreg-stimulation. Labels were added to IL17, FOXP3 and the top 20 most differentially expressed genes. e Cell state-specific gene signatures defined using jointly RNA and protein expression. Colours encode normalized (Z-scored) gene and protein expression levels. Example genes for each signature are labelled. Source data are provided as a Source Data file.CC BY · PubMed Central
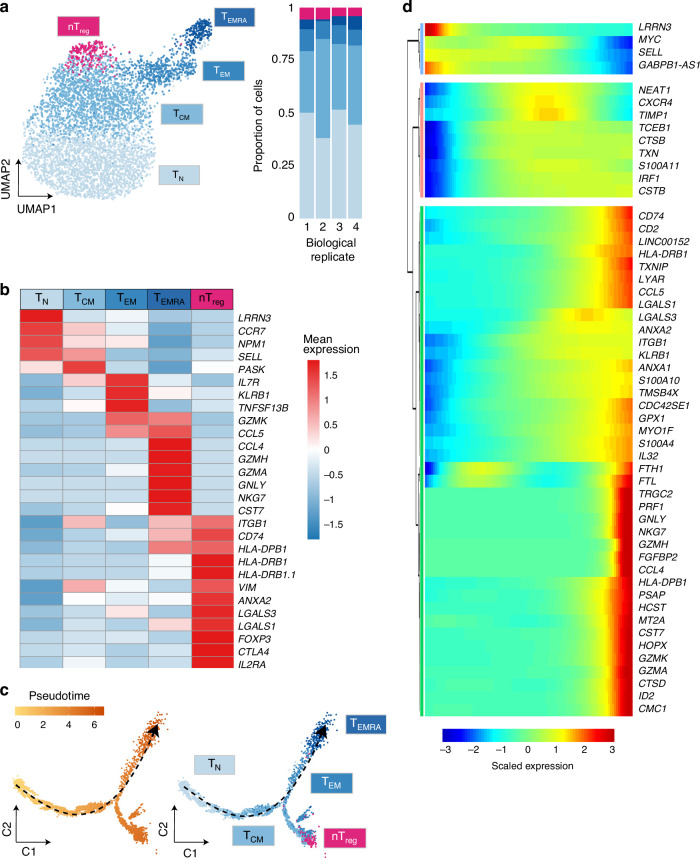
Fig. 3 Effectorness gradient in resting CD4+ T cells. a UMAP of single-cell RNA-seq data from resting T cells. Colors represent cells in the five clusters defined using top variable genes and unsupervised clustering. Bar plots represent the proportion of cells assigned to different clusters in each biological replicate. b Gene markers of each cell cluster (Wilcoxon rank sum test) combined with well known markers from the literature. Colors encode the mean expression of each gene in each cluster. c Branched pseudotime trajectory, each cell is colored by its pseudotime value (left panel) or its cluster label (right panel), as determined in a. d Heatmap of genes variable along the pseudotime trajectory (from Monocle). The X axis represents cells ordered by pseudotime (from left to right) and different colors correspond to the scaled (Z-scored) expression of each gene in each cell. Source data are provided as a Source Data file.
Fig. 3 Effectorness gradient in resting CD4+ T cells. a UMAP of single-cell RNA-seq data from resting T cells. Colors represent cells in the five clusters defined using top variable genes and unsupervised clustering. Bar plots represent the proportion of cells assigned to different clusters in each biological replicate. b Gene markers of each cell cluster (Wilcoxon rank sum test) combined with well known markers from the literature. Colors encode the mean expression of each gene in each cluster. c Branched pseudotime trajectory, each cell is colored by its pseudotime value (left panel) or its cluster label (right panel), as determined in a. d Heatmap of genes variable along the pseudotime trajectory (from Monocle). The X axis represents cells ordered by pseudotime (from left to right) and different colors correspond to the scaled (Z-scored) expression of each gene in each cell. Source data are provided as a Source Data file.CC BY · PubMed Central
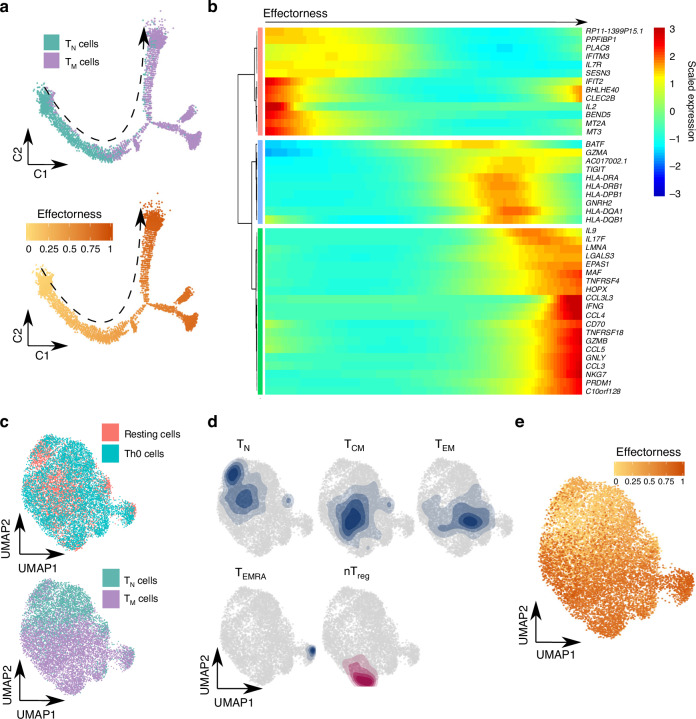
Fig. 4 The effectorness gradient is preserved after T cell activation. a Th0-stimulated TN and TM cells ordered in a branched pseudotime trajectory. Cells are colored by cell type (top panel) or effectorness (bottom panel). b Heatmap of the most variable genes along the Th0 pseudotime trajectory (Methods). The x axis represents cells ordered by effectorness (from left to right) and colors correspond to the scaled (Z-scored) expression of each gene in each cell. c Mapping of Th0-stimulated cells to their corresponding resting T cell populations. Integration of resting and Th0-stimulated cells using canonical correlation analysis (Methods) followed by UMAP embedding. Cells are colored by activation status (resting vs Th0, top panel) or cell type (bottom panel). d Density plots highlighting the location of cell clusters as defined in resting state. e UMAP embedding color-coded by the effectorness values of resting and stimulated cells. Source data are provided as a Source Data file.
Fig. 4 The effectorness gradient is preserved after T cell activation. a Th0-stimulated TN and TM cells ordered in a branched pseudotime trajectory. Cells are colored by cell type (top panel) or effectorness (bottom panel). b Heatmap of the most variable genes along the Th0 pseudotime trajectory (Methods). The x axis represents cells ordered by effectorness (from left to right) and colors correspond to the scaled (Z-scored) expression of each gene in each cell. c Mapping of Th0-stimulated cells to their corresponding resting T cell populations. Integration of resting and Th0-stimulated cells using canonical correlation analysis (Methods) followed by UMAP embedding. Cells are colored by activation status (resting vs Th0, top panel) or cell type (bottom panel). d Density plots highlighting the location of cell clusters as defined in resting state. e UMAP embedding color-coded by the effectorness values of resting and stimulated cells. Source data are provided as a Source Data file.CC BY · PubMed Central
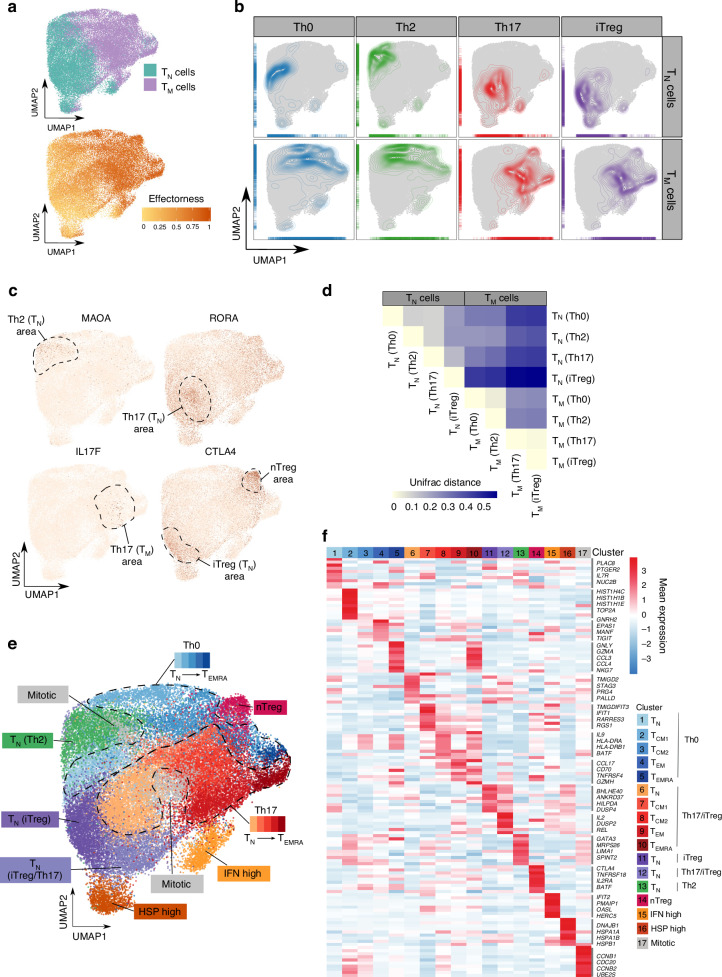
Fig. 5 The effectorness gradient persists after cytokine-induced T cell polarization. a UMAP embedding of stimulated T cells into a two-dimensional space. Cells are colored by cell type (top panel) or effectorness value (bottom panel). b Density plots highlighting cells based on the cytokine stimulations. c Expression of selected cytokine-specific markers obtained from our bulk RNA-seq analysis. Cells are colored by their expression level of each marker gene. d UniFrac distances between TN and TM cells exposed to different cytokines summarized in a correlation plot. e Annotation of 17 cell clusters identified from unsupervised clustering using the top variable genes. Each cluster is annotated based on either the genes with highest expression or the effectorness and cytokine condition of the cells contained in it. b Heatmap of the top 10 markers of each cluster (Wilcoxon rank sum test). Colors encode the mean expression of each gene in each cluster. Labels were added to a number of example genes for each cluster. Source data are provided as a Source Data file.
Fig. 5 The effectorness gradient persists after cytokine-induced T cell polarization. a UMAP embedding of stimulated T cells into a two-dimensional space. Cells are colored by cell type (top panel) or effectorness value (bottom panel). b Density plots highlighting cells based on the cytokine stimulations. c Expression of selected cytokine-specific markers obtained from our bulk RNA-seq analysis. Cells are colored by their expression level of each marker gene. d UniFrac distances between TN and TM cells exposed to different cytokines summarized in a correlation plot. e Annotation of 17 cell clusters identified from unsupervised clustering using the top variable genes. Each cluster is annotated based on either the genes with highest expression or the effectorness and cytokine condition of the cells contained in it. b Heatmap of the top 10 markers of each cluster (Wilcoxon rank sum test). Colors encode the mean expression of each gene in each cluster. Labels were added to a number of example genes for each cluster. Source data are provided as a Source Data file.CC BY · PubMed Central
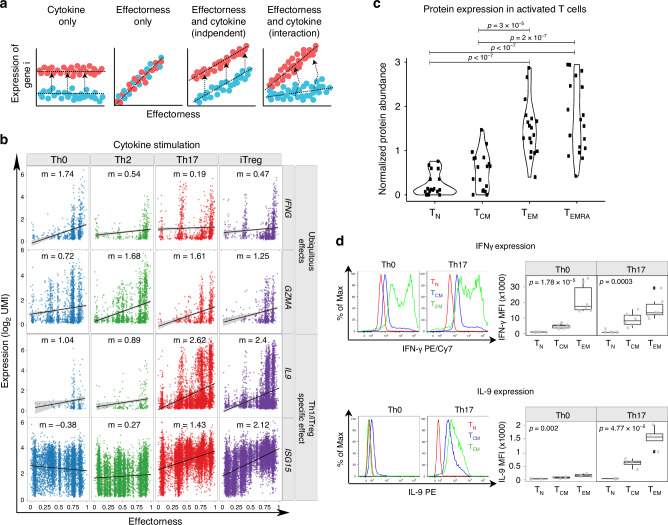
Fig. 6 Interactions between effectorness and cytokine condition regulate gene expression. a Schematic representation of the gene expression interaction model. Effectorness and cytokine conditions were incorporated into a linear model with an interaction term (Methods). Genes were assigned to four groups: genes induced by cytokine-stimulation regardless of effectorness (left panel), genes which correlate with effectorness regardless of cytokine-stimulation (central left panel), and genes which correlate with both effectorness and cytokine-stimulation either independently (central right panel) or through an interaction (right panel). b Plots of gene expression (y axis) as a function of effectorness (x axis), with cells stratified by cytokine condition. Two example genes significantly associated with effectorness regardless of cytokine conditions (top panels) and two example genes with a strong interaction between effectorness and Th17 or iTreg-stimulation (bottom panels). Each dot represents a single-cell. c Protein expression levels for 18 genes associated with effectorness in activated TN, TCM, and TEM and TEMRA cells regardless of cytokines condition (genes used in the analysis: ACTB, CCL3, CCL5, CTSW, GNLY, GZMA, GZMB, HLA-DPB1, HLA-DQA1, HLA-DRA, HLA-DRB1, HOPX, IFNG, LGMN, LMNA, NFKBIA, TMEM173, TNFRSF18)). Expression values were obtained from a publicly available quantitative proteomics data set (Methods). Significance was calculated using one-way ANOVA (p = 3.42 × 10⁻¹²) and group means were compared using Tukey’s Honest Significant Difference test. Only significant p-values are shown (p < 0.05). Each dot represents an individual gene (n = 18). d Levels of IFNγ and IL-9 protein in Th0 and Th17-stimulated TN, TCM, and TEM cells as assessed by flow cytometry. Representative cytometry histograms of IFNγ and IL-9 expression (left panels) and mean fluorescence intensity (MFI) of cytokine-expressing cells (right panels). P-values were calculated using one-way ANOVA. Each dot represents a biologically independent sample. Number of samples: 6 (IFNγ) and 4 (IL-9). Boxplot centers represent median values, while the boxplot bounds represent the 25% and 75% quantiles. Boxplot whiskers represent the 25% quantile − 1.5 × interquartile range (IQR) and the 75% quantile + 1.5 × IQR, respectively. Source data are provided as a Source Data file.
Fig. 6 Interactions between effectorness and cytokine condition regulate gene expression. a Schematic representation of the gene expression interaction model. Effectorness and cytokine conditions were incorporated into a linear model with an interaction term (Methods). Genes were assigned to four groups: genes induced by cytokine-stimulation regardless of effectorness (left panel), genes which correlate with effectorness regardless of cytokine-stimulation (central left panel), and genes which correlate with both effectorness and cytokine-stimulation either independently (central right panel) or through an interaction (right panel). b Plots of gene expression (y axis) as a function of effectorness (x axis), with cells stratified by cytokine condition. Two example genes significantly associated with effectorness regardless of cytokine conditions (top panels) and two example genes with a strong interaction between effectorness and Th17 or iTreg-stimulation (bottom panels). Each dot represents a single-cell. c Protein expression levels for 18 genes associated with effectorness in activated TN, TCM, and TEM and TEMRA cells regardless of cytokines condition (genes used in the analysis: ACTB, CCL3, CCL5, CTSW, GNLY, GZMA, GZMB, HLA-DPB1, HLA-DQA1, HLA-DRA, HLA-DRB1, HOPX, IFNG, LGMN, LMNA, NFKBIA, TMEM173, TNFRSF18)). Expression values were obtained from a publicly available quantitative proteomics data set (Methods). Significance was calculated using one-way ANOVA (p = 3.42 × 10⁻¹²) and group means were compared using Tukey’s Honest Significant Difference test. Only significant p-values are shown (p < 0.05). Each dot represents an individual gene (n = 18). d Levels of IFNγ and IL-9 protein in Th0 and Th17-stimulated TN, TCM, and TEM cells as assessed by flow cytometry. Representative cytometry histograms of IFNγ and IL-9 expression (left panels) and mean fluorescence intensity (MFI) of cytokine-expressing cells (right panels). P-values were calculated using one-way ANOVA. Each dot represents a biologically independent sample. Number of samples: 6 (IFNγ) and 4 (IL-9). Boxplot centers represent median values, while the boxplot bounds represent the 25% and 75% quantiles. Boxplot whiskers represent the 25% quantile − 1.5 × interquartile range (IQR) and the 75% quantile + 1.5 × IQR, respectively. Source data are provided as a Source Data file.CC BY · PubMed Central

Verification

Claims the paper makes

The claims and statistics of this paper haven’t been checked yet.

Free: it reads the open-access text and checks the first 5 claims that cite a source we can check. Create a free account to check every claim.

A few free checks a day · papers already verified open instantly · results are public

Claims other papers make about this one

Each is checked against this paper’s own text: does it say what the citing paper says it does?

Self-check

Percentages, sums and reported differences re-computed from the paper’s own numbers.

The self-check needs the paper’s full text.

Citations

Cites

Show all 89 references

Cited by

See all 288

Metadata

Authors
Cano-Gamez, K., Soskic, B., Roumeliotis, T. I., So, E., Smyth, D. J., Baldrighi, M., Willé, D., Nakic, N., Esparza-Gordillo, J., Larminie, C. G. C., Bronson, P. G., Tough, D. F., Rowan, W. C., Choudhary, J. S., & Trynka, G.
Affiliations
  • Wellcome Sanger Institute (GB)
  • Institute of Cancer Research (GB)
  • GlaxoSmithKline Research & Development Limited (United Kingdom) (GB)
  • Biogen (United States) (US)
  • GlaxoSmithKline (United Kingdom) (GB)
Corresponding author
  • Soskic, Blagoje
  • Trynka, Gosia
Venue
Nature Communications
Published
2020-04-14
Volume
11
Issue
1
Pages
1801-1801
ISSN
2041-1723 (ISSN-L)
OpenAlex
W3015671642
Cited by
274
References
88
Citations by year
2026: 15 · 2025: 46 · 2024: 73 · 2023: 47 · 2022: 49 · 2021: 28 · 2020: 16
FWCI
13.03
Type
journal article
Language
en
Open access
Licence
Locations
  • Nature Communications (publishedVersion, cc-by)
  • bioRxiv (Cold Spring Harbor Laboratory) (acceptedVersion, cc-by)
  • PubMed Central (publishedVersion, cc-by)
  • PubMed (publishedVersion)
  • RePEc: Research Papers in Economics (submittedVersion)
  • DOAJ (DOAJ: Directory of Open Access Journals) (submittedVersion, cc-by-sa)
Funders
Wellcome Trust (WT206194)
Topics
  • Life Sciences › Immunology and Microbiology › Immunology › T-cell and B-cell Immunology
  • Life Sciences › Immunology and Microbiology › Immunology › Psoriasis: Treatment and Pathogenesis
  • Life Sciences › Biochemistry, Genetics and Molecular Biology › Molecular Biology › Single-cell and spatial transcriptomics
Keywords
CD4+ T cells, memory T cells, naive T cells, cytokine response, Th17 polarization, Th2 differentiation, central memory T cells, effector memory T cells, transcriptional heterogeneity, chemokine expression, T cell activation, inflammation
MeSH terms
Gene Expression Regulation, Humans, Lymphocyte Activation, Male, Middle Aged, Receptors, Antigen, T-Cell, CD4-Positive T-Lymphocytes, Cytokines, Cell Polarity, CD28 Antigens, Proteome, Principal Component Analysis, Single-Cell Analysis, Transcriptome

About these checks

Registry, retraction, Cites and statistics results are computed, not judged, with one exception: a printed reference that no index lists is read once by a model before it counts as a citation error. Claims are extracted by a model and kept only when their quote appears verbatim in the text; each cited source is then checked, with a model’s help, for whether it says what the claim relies on. Those verdicts can be wrong — read the claim’s quote and the cited source before relying on one.

Statistics and arithmetic are recomputed, not judged.

Confidence bands are shown only for fields calibrated on our annotated test set. None is calibrated yet, so no band is shown.

What counts as a claim ›How we measure confidence ›How we check this ›

Are you an author, or do you see a problem with this page? Request a review

How to cite

Cite CoChat for the checks on this page, and the paper for its own findings.

This page
CoChat. (2026). Citation check: Single-cell transcriptomics identifies an effectorness gradient shaping the response of CD4+ T cells to cytokines. https://app.cochat.ai/papers/10.1038/s41467-020-15543-y
The paper
Cano-Gamez, K., Soskic, B., Roumeliotis, T. I., So, E., Smyth, D. J., Baldrighi, M., Willé, D., Nakic, N., Esparza-Gordillo, J., Larminie, C. G. C., Bronson, P. G., Tough, D. F., Rowan, W. C., Choudhary, J. S., & Trynka, G. (2020). Single-cell transcriptomics identifies an effectorness gradient shaping the response of CD4+ T cells to cytokines. Nature Communications. https://doi.org/10.1038/s41467-020-15543-y

Data sources

Bibliographic data: Semantic Scholar, OpenAlex, Crossref.

Contains information from the Semantic Scholar Academic Graph Datasets, made available under the ODC Attribution License (ODC-BY 1.0).

Semantic Scholar’s data is described in: Kinney, R., et al. (2023). The Semantic Scholar Open Data Platform. arXiv:2301.10140.