

The DOI matches its Crossref record; 19 of the 19 references it cites were found in a registry or an index.
Ancient genomes reveal social and genetic structure of Late Neolithic Switzerland
Abstract
Genetic studies of Neolithic and Bronze Age skeletons from Europe have provided evidence for strong population genetic changes at the beginning and the end of the Neolithic period. To further understand the implications of these in Southern Central Europe, we analyze 96 ancient genomes from Switzerland, Southern Germany, and the Alsace region in France, covering the Middle/Late Neolithic to Early Bronze Age. Similar to previously described genetic changes in other parts of Europe from the early 3rd millennium BCE, we detect an arrival of ancestry related to Late Neolithic pastoralists from the Pontic-Caspian steppe in Switzerland as early as 2860–2460 calBCE. Our analyses suggest that this genetic turnover was a complex process lasting almost 1000 years and involved highly genetically structured populations in this region.
Overview
The claims and statistics of this paper haven’t been checked yet.
Run the check — free, no account needed. It reads the open-access text and checks the sources it cites.
Integrity signals
Registry
Cites
Statistics
Figures
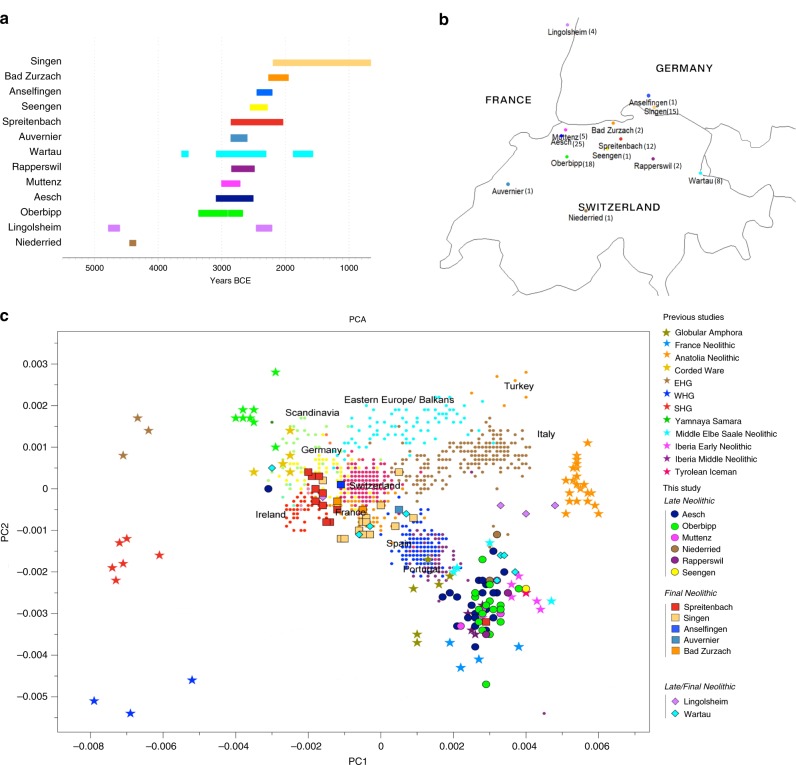
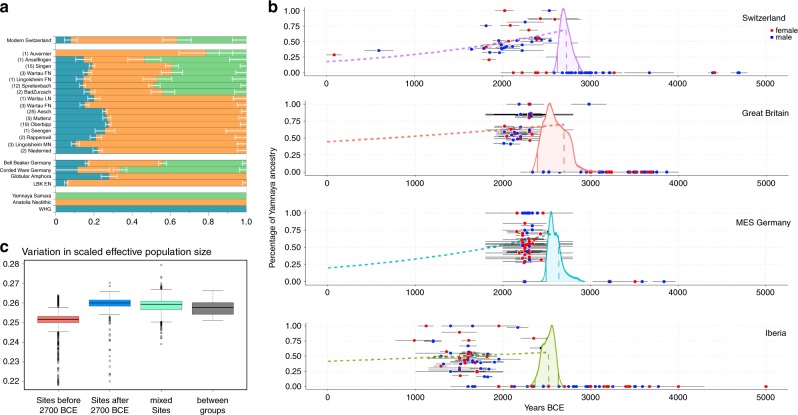
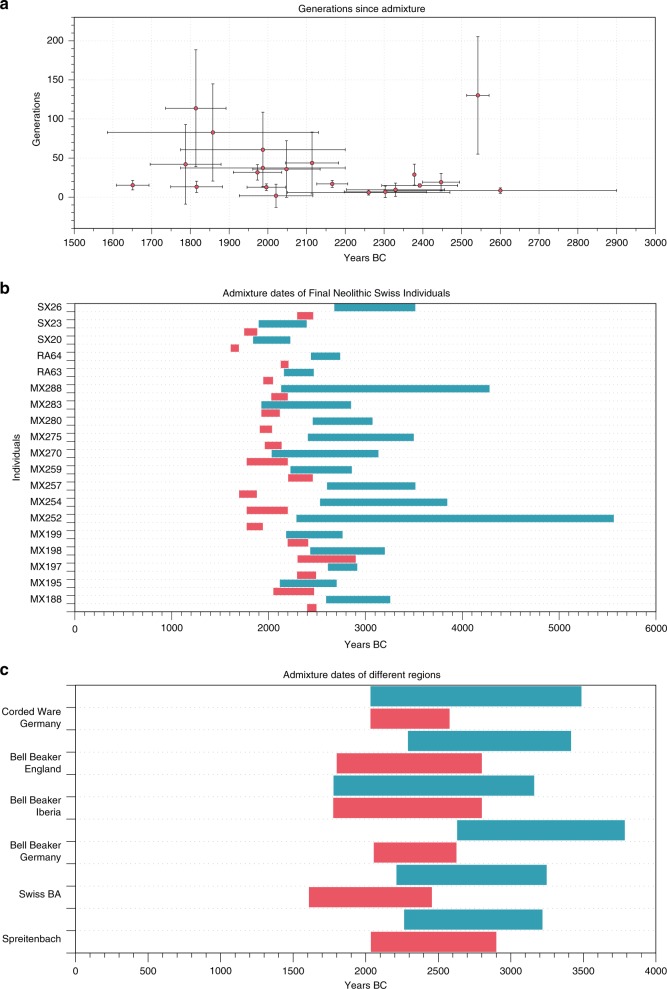
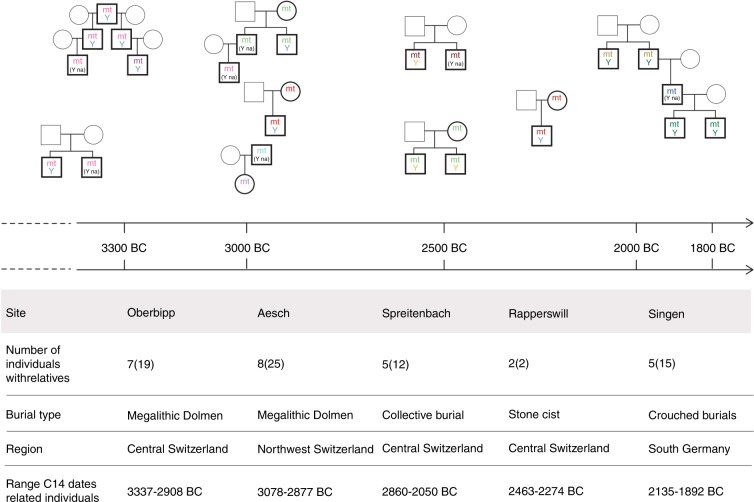
Verification
Claims the paper makes
The claims and statistics of this paper haven’t been checked yet.
Run the check — free, no account needed. It reads the open-access text and checks the sources it cites.
Claims other papers make about this one
Each is checked against this paper’s own text: does it say what the citing paper says it does?
In the citing paper
“In addition, reconstructed pedigrees show more first and second-degree related males than females67,69,70,72,74–77.”
From Patrilineal segmentary systems provide a peaceful explanation for the post-Neolithic Y-chromosome bottleneck (2024) · cites this paper as [70]
In the citing paper
“In particular, males tend to share more often the same haplogroup of the Y chromosome, whereas there is a greater diversity of haplogroups for mtDNA67–77.”
From Patrilineal segmentary systems provide a peaceful explanation for the post-Neolithic Y-chromosome bottleneck (2024) · cites this paper as [70]
In the citing paper
“In addition, kinship analyses based on ancient DNA data from the Neolithic and Bronze Age (mostly Europe) showed low frequency of half-brothers and half-sisters67–71,73–77, with the exception of Hazleton North long cairn72.”
From Patrilineal segmentary systems provide a peaceful explanation for the post-Neolithic Y-chromosome bottleneck (2024) · cites this paper as [70]
In the citing paper
“Consistent with the hypothesis of a rapid spread of patrilocality after the Neolithic transition, ancient DNA studies show that male relatedness is often higher than female relatedness within archaeological sites from the Neolithic and the Bronze Age (mostly from Europe).”
From Patrilineal segmentary systems provide a peaceful explanation for the post-Neolithic Y-chromosome bottleneck (2024) · cites this paper as [70]
Self-check
Percentages, sums and reported differences re-computed from the paper’s own numbers.
The self-check needs the paper’s full text.
Citations
Cites
Ancient Admixture in Human History
Patterson, N., Moorjani, P., Luo, Y., Mallick, S., Rohland, N., Zhan, Y., Genschoreck, T., Webster, T., & Reich, D. (2012) · Genetics · doi:10.1534/genetics.112.145037 · Cited by 2,848
Massive migration from the steppe was a source for Indo-European languages in Europe
Haak, W., Lazaridis, I., Patterson, N., Rohland, N., Mallick, S., Llamas, B., Brandt, G., Nordenfelt, S., Harney, E., Stewardson, K., et al. (2015) · Nature · doi:10.1038/nature14317 · Cited by 1,940
Self-citationPopulation genomics of Bronze Age Eurasia
Allentoft, M. E., Sikora, M., Sjögren, K.-G., Rasmussen, S., Rasmussen, M., Stenderup, J., Damgaard, P. B., Schroeder, H., Ahlström, T., Vinner, L., et al. (2015) · Nature · doi:10.1038/nature14507 · Cited by 1,550
Genome-wide patterns of selection in 230 ancient Eurasians
Mathieson, I., Lazaridis, I., Rohland, N., Mallick, S., Patterson, N., Roodenberg, S. A., Harney, E., Stewardson, K., Fernandes, D., Novak, M., et al. (2015) · Nature · doi:10.1038/nature16152 · Cited by 1,515
Self-citationGenes mirror geography within Europe
Novembre, J., Johnson, T., Bryc, K., Kutalik, Z., Boyko, A. R., Auton, A., Indap, A., King, K. S., Bergmann, S., Nelson, M. R., et al. (2008) · Nature · doi:10.1038/nature07331 · Cited by 1,479
Dabney, J., Knapp, M., Glocke, I., Gansauge, M.-T., Weihmann, A., Nickel, B., Valdiosera, C., García, N., Pääbo, S., Arsuaga, J.-L., et al. (2013) · Proceedings of the National Academy of Sciences · doi:10.1073/pnas.1314445110 · Cited by 1,443
Ancient human genomes suggest three ancestral populations for present-day Europeans
Lazaridis, I., Patterson, N., Mittnik, A., Renaud, G., Mallick, S., Kirsanow, K., Sudmant, P. H., Schraiber, J. G., Castellano, S., Lipson, M., et al. (2014) · Nature · doi:10.1038/nature13673 · Cited by 1,357
Self-citationDouble indexing overcomes inaccuracies in multiplex sequencing on the Illumina platform
Kircher, M., Sawyer, S., & Meyer, M. (2012) · Nucleic Acids Research · doi:10.1093/nar/gkr771 · Cited by 1,106
Genomic insights into the origin of farming in the ancient Near East
Lazaridis, I., Nadel, D., Rollefson, G., Merrett, D. C., Rohland, N., Mallick, S., Fernandes, D., Novak, M., Gamarra, B., Sirak, K., et al. (2016) · Nature · doi:10.1038/nature19310 · Cited by 955
Self-citationAn aboriginal Australian genome reveals separate human dispersals into Asia
Rasmussen, M., Guo, X., Wang, Y., Lohmueller, K. E., Rasmussen, S., Albrechtsen, A., Skotte, L., Lindgreen, S., Metspalu, M., Jombart, T., et al. (2011) · Science · doi:10.1126/science.1211177 · Cited by 787
Research works printed but not linked: 28
- Omrak, A. et al. Genomic evidence establishes Anatolia as the source of the European Neolithic gene pool. Curr. Biol. 26, 270–275 (2016). · DOI
- Olalde, I. et al. The Beaker phenomenon and the genomic transformation of northwest Europe. Nature 555, 190–196 (2018). · DOI · Paper page
- Siebke I. et al. Who lived on the Swiss Plateau around 3300 BCE? Analyses of commingled human skeletal remains from the dolmen of Oberbipp. Int. J. Osteoarchaeol. https://doi.org/10.1002/oa.2791 (2019). · DOI
- Hafner A. & Suter P. J. Das neolithikum in der Schweiz. J. Neolit. Archaeol. 5, https://doi.org/10.12766/jna.2003.4 (2003). · DOI
- Hafner, A., Heitz, C. & Stapfer, R. Pile-dwellings of the Neolithic and the Bronze Age in Switzerland. Long-term Research and Future Tasks, Vol. 10 (Schriften des Archäologischen Landesmuseum Schleswig, 2014).
- Siebke, I. et al. The application of different 3D-scan-systems and photogrammetry at an excavation—a Neolithic dolmen from Switzerland. Digit. Appl. Archaeol. Cult. Heritage 10, e00078 (2018).
- Weissensteiner, H. et al. HaploGrep 2: mitochondrial haplogroup classification in the era of high-throughput sequencing. Nucleic Acids Res. 44, W58–63 (2016). · DOI
- Saag, L. et al. Extensive farming in estonia started through a sex-biased migration from the Steppe. Curr. Biol. 27, 2185–2193.e6 (2017). · DOI
- Narasimhan, V. M. et al. (2019) The formation of human populations in South and Central Asia. Science 365, https://doi.org/10.1126/science.aat7487 (2019). · DOI · Paper page
- Lipatov, M., Sanjeev, K., Patro, R. & Veeramah, K. Maximum likelihood estimation of biological relatedness from low coverage sequencing data. bioRxiv https://doi.org/10.1101/023374 (2015). · DOI · Paper page
- Sánchez-Quinto, F. et al. Megalithic tombs in western and northern Neolithic Europe were linked to a kindred society. Proc. Natl Acad. Sci. USA 116, 9469–9474, https://doi.org/10.1073/pnas.1818037116 (2019). · DOI · Paper page
- Knipper, C. et al. Female exogamy and gene pool diversification at the transition from the Final Neolithic to the Early Bronze Age in central Europe. Proc. Natl Acad. Sci. USA 114, 10083–10088 (2017). · DOI · Paper page
- Mathieson, I. et al. The genomic history of southeastern Europe. Nature 555, 197–203 (2018). · DOI
- Siebke I. et al. Crops vs. animals: regional differences in subsistence strategies of Swiss Neolithic Farmers revealed by stable isotopes. (2020). (In press). · DOI
- Price, T. D., Bentley, R. A., Lüning, J., Gronenborn, D. & Wahl, J. Prehistoric human migration in the Linearbandkeramik of Central Europe. Antiquity 75, 593–603, https://doi.org/10.1017/S0003598X00088827 (2001). · DOI
- Berger, B. et al. High resolution mapping of Y haplogroup G in Tyrol (Austria). Forensic Sci. Int. Genet. 7, 529–536, https://doi.org/10.1016/j.fsigen.2013.05.013 (2013). · DOI
- Pichler, I. et al. Genetic structure in contemporary South Tyrolean isolated populations revealed by analysis of Y-chromosome, mtDNA, and Alu polymorphisms. 2006. Hum. Biol. 81, 875–898, https://doi.org/10.3378/027.081.0629 (2009). · DOI
- Mittnik, A. et al. Kinship-based social inequality in Bronze Age Europe. Science 366, 731–734 (2019). · DOI · Paper page
- Lazaridis, I. et al. Genetic origins of the Minoans and Mycenaeans. Nature 548, 214–218, https://doi.org/10.1038/nature23310 (2017). · DOI
- Fernandes, D. M. et al. The arrival of steppe and Iranian related ancestry in the islands of the Western Mediterranean. Nature Ecology and Evolution 4, 334 (2019).
- Marcus, J. H. et al. Population history from the Neolithic to present on the Mediterranean island of Sardinia: an ancient DNA perspective. Nat. Commun. 11, 939 (2020). · DOI
- Meyer, M. & Kircher, M. Illumina sequencing library preparation for highly multiplexed target capture and sequencing. Cold Spring Harb. Protoc. 5448 (2010). · DOI
- Furtwängler, A. et al. Ratio of mitochondrial to nuclear DNA affects contamination estimates in ancient DNA analysis. Sci Rep. 8, 1–8. https://doi.org/10.1038/s41598-018-32083-0. · DOI
- Peltzer, A. et al. EAGER: efficient ancient genome reconstruction. Genome Biol. 17.1, 1 (2016).
- Mittnik, A., Wang, C.-C., Svoboda, J. & Krause, J. A molecular approach to the sexing of the triple burial at the upper paleolithic site of Dolní Věstonice. PLoS ONE 11, e0163019 (2016). · DOI
- Nash, J. C. & Varadhan, R. Unifying optimization algorithms to aid software system users: optimx for R. J. Stat. Softw. 43, 1–14, http://www.jstatsoft.org/v43/i09/ (2011). · DOI
- Koller, M. robustlmm: an R package for robust estimation of linear mixed-effects models. J. Stat. Softw. 75.6, 1–24. (2016).
- McKenna, A. et al. The Genome Analysis Toolkit: a MapReduce framework for analyzing next-generation DNA sequencing data. Genome Res. 20, 1297–1303 (2010). · DOI · Paper page
Cited by
Guyon, L., Guez, J., Toupance, B., Heyer, E., & Chaix, R. (2024) · Nature Communications · doi:10.1038/s41467-024-47618-5 · Cited by 28
Metadata
- Authors
- Furtwängler, A., Rohrlach, A. B., Lamnidis, T. C., Papac, L., Neumann, G. U., Siebke, I., Reiter, E., Steuri, N., Hald, J., Denaire, A., Schnitzler, B., Wahl, J., Ramstein, M., Schuenemann, V. J., Stockhammer, P. W., Hafner, A., Lösch, S., Haak, W., Schiffels, S., & Krause, J.
- Venue
- Nature Communications
- Published
- 2020-04-20
- Volume
- 11
- Issue
- 1
- ISSN
- 2041-1723
- PMC
- PMC7171184
- Cited by
- 71
- References
- 19
- Language
- en
- Update notices
- correction (2020-09-16)
- Funders
- Max-Planck-Gesellschaft
- Deutsche Forschungsgemeinschaft (KR 4015/4-1)
- Heidelberger Akademie der Wissenschaften (Times of Upheaval)
About these checks
Registry, retraction, Cites and statistics results are computed, not judged, with one exception: a printed reference that no index lists is read once by a model before it counts as a citation error. Claims are extracted by a model and kept only when their quote appears verbatim in the text; each cited source is then checked, with a model’s help, for whether it says what the claim relies on. Those verdicts can be wrong — read the claim’s quote and the cited source before relying on one.
Statistics and arithmetic are recomputed, not judged.
Confidence bands are shown only for fields calibrated on our annotated test set. None is calibrated yet, so no band is shown.
What counts as a claim ›How we measure confidence ›How we check this ›
Are you an author, or do you see a problem with this page? Request a review
