

The DOI matches its Crossref record; 53 of the 54 references it cites were found in a registry or an index; 3 of the 38 sources its claims cite were checked for support.
A BET family protein degrader provokes senolysis by targeting NHEJ and autophagy in senescent cells
Open accessAbstract
Although cellular senescence acts primarily as a tumour suppression mechanism, the accumulation of senescent cells in vivo eventually exerts deleterious side effects through inflammatory/tumour-promoting factor secretion. Thus, the development of new drugs that cause the specific elimination of senescent cells, termed senolysis, is anticipated. Here, by an unbiased high-throughput screening of chemical compounds and a bio-functional analysis, we identify BET family protein degrader (BETd) as a promising senolytic drug. BETd provokes senolysis through two independent but integrated pathways; the attenuation of non-homologous end joining (NHEJ), and the up-regulation of autophagic gene expression. BETd treatment eliminates senescent hepatic stellate cells in obese mouse livers, accompanied by the reduction of liver cancer development. Furthermore, the elimination of chemotherapy-induced senescent cells by BETd increases the efficacy of chemotherapy against xenograft tumours in immunocompromised mice. These results reveal the vulnerability of senescent cells and open up possibilities for its control.
Overview
AI snapshot
Written from the paper’s full text.
TL;DR
An unbiased high-throughput screen of ~47,000 compounds identified BET family protein degraders/inhibitors as senolytic agents, with ARV825 showing strong senolysis at 5–10 nM. ARV825 kills senescent cells by inhibiting NHEJ and activating autophagy, reducing obesity-associated HCC and improving chemotherapy efficacy in mouse models.
Key findings
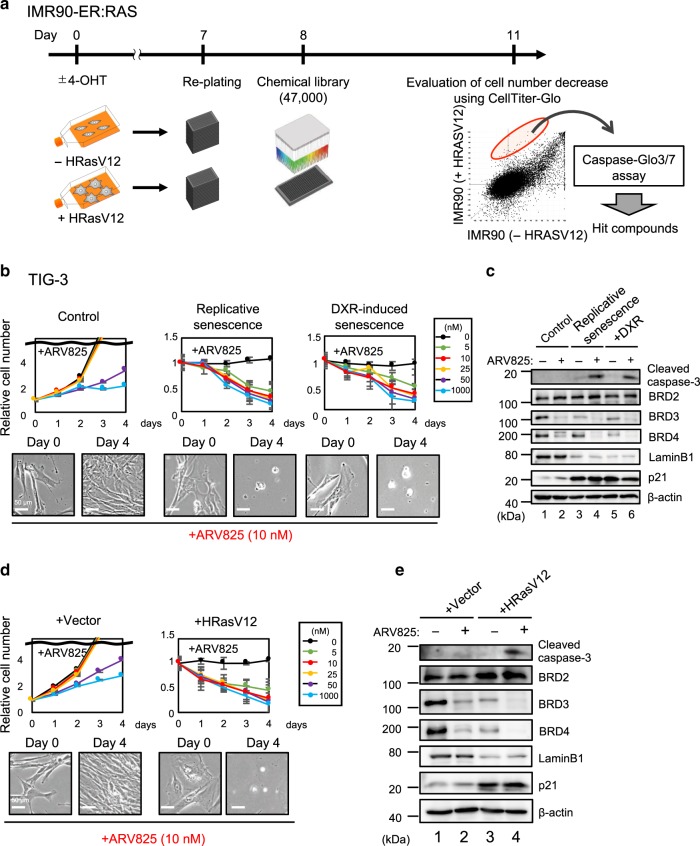
- Screening ~47,000 small molecules found 15 compounds that preferentially killed Ras-induced senescent cells; four top hits were BET inhibitors (JQ1, I-BET151, I-BET762, PFI-1). ARV825, a BET degrader, had the strongest senolytic activity, killing senescent HDFs at 5–10 nM regardless of senescence induction method, and reduced BRD3/BRD4 levels at 10 nM.
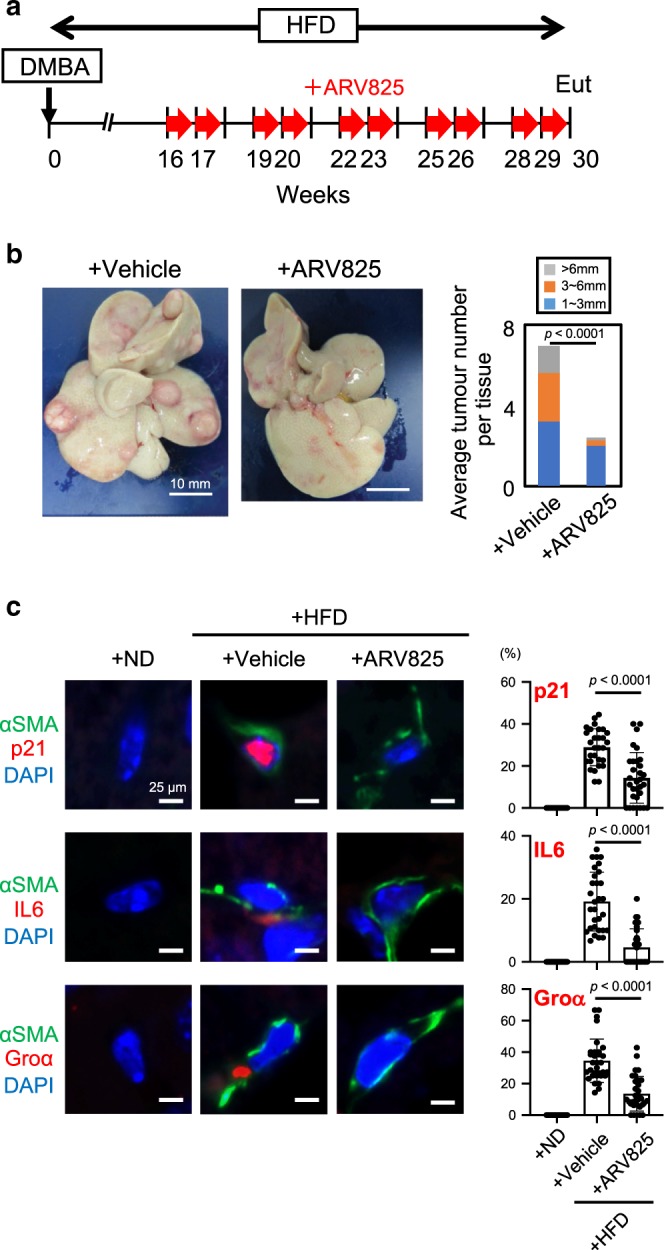
- In an obesity-induced HCC mouse model, ARV825 (5 mg/kg i.p.) substantially reduced HCC development and reduced senescent hepatic stellate cells, judged by αSMA with p21, IL-6, or Groα staining (HFD+vehicle n=20; HFD+ARV825 n=16).
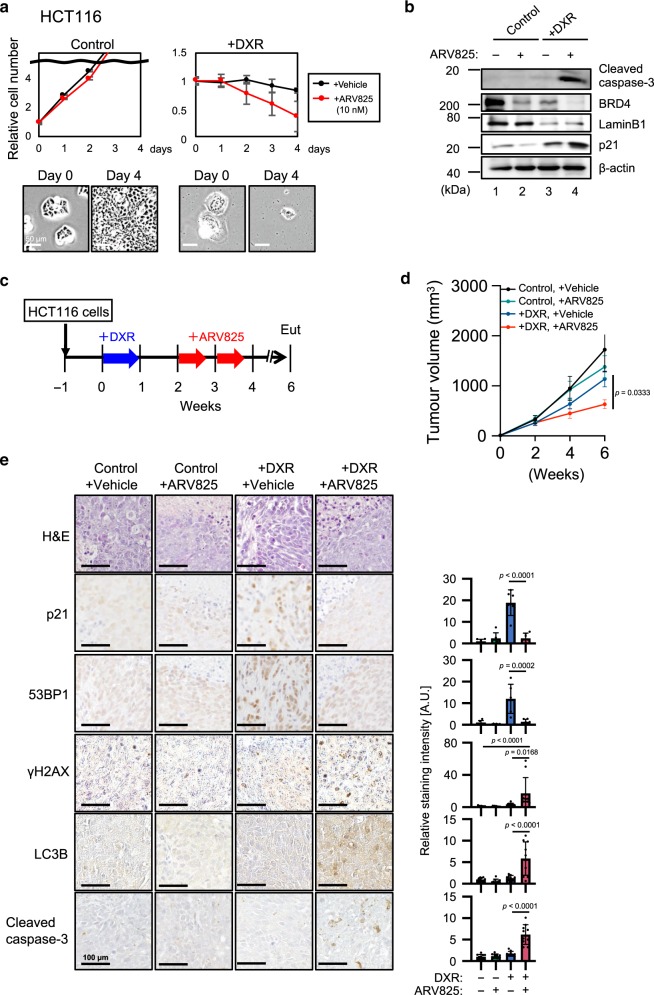
- In HCT116 xenografts, DXR plus ARV825 significantly reduced tumour size versus DXR alone, with reduced p21 and 53BP1 and increased γH2AX, LC3B, and cleaved caspase-3 in tumour sections.
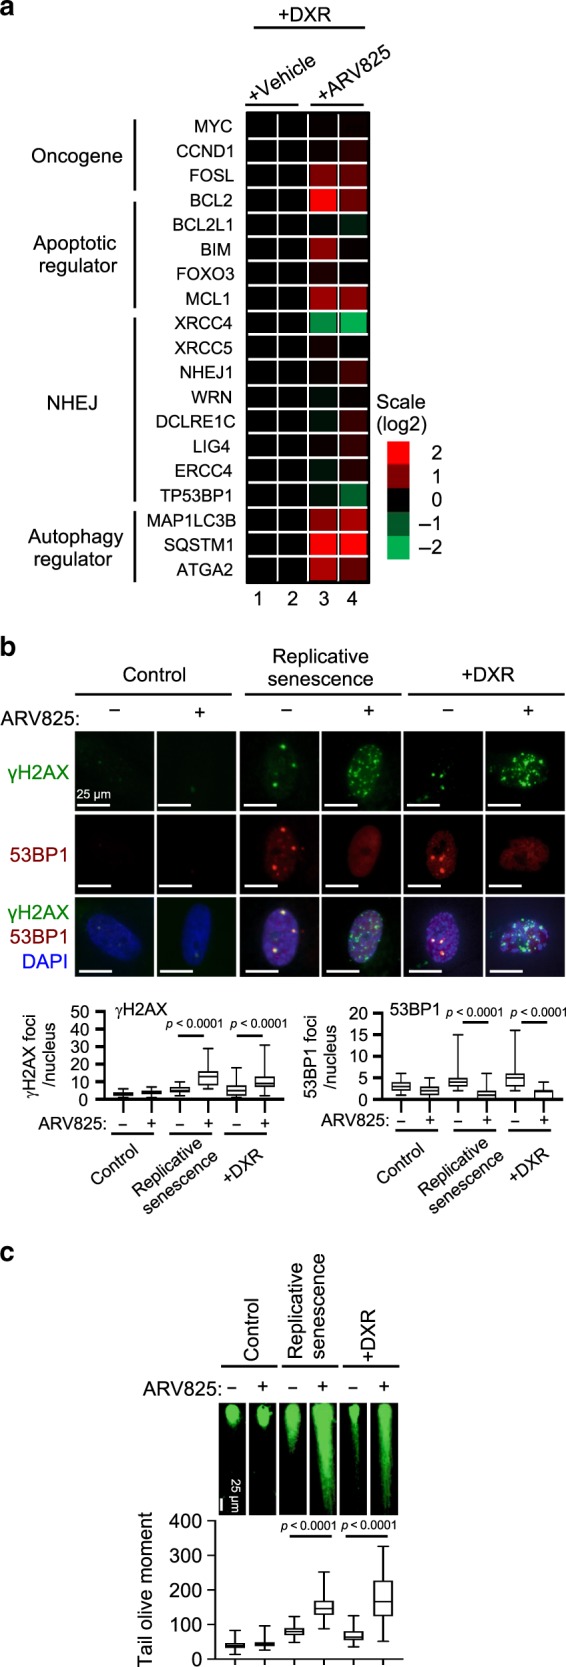
- Mechanistically, ARV825 downregulated xrcc4, blocked 53BP1 recruitment to DSB sites, exacerbated DSBs, and upregulated autophagic genes; autophagy inhibitors bafilomycin A1 or chloroquine reduced ARV825-induced senolysis, and autophagy preceded caspase-dependent apoptosis.
Methods
- HTS: IMR90-ER:HRAS cells were treated with 500 nM 4-hydroxytamoxifen for 7 days, plated at 500 cells/well in 384-well plates, incubated with ~47,000 Takeda compounds at 3 or 10 μM for 72 h, then assayed with CellTiter-Glo and Caspase-Glo3/7.
- Cell and in vivo models: TIG-3 HDFs were used as early-passage controls (<46 population doublings) or replicative senescent cells (>70 population doublings); senescence was also induced with doxorubicin (250 ng/ml for TIG-3, 200 ng/ml for HCT116) or RasV12. Mouse models included HFD-fed obesity-associated HCC mice treated with ARV825 (5 mg/kg i.p.) and HCT116 xenografts treated with DXR (1 mg/kg daily for 7 days) followed by ARV825 (5 mg/kg, 10 times over 2 weeks).
- Main analyses: RNA-seq, immunoblotting, immunoprecipitation, immunofluorescence/immunohistochemistry, RT-qPCR, neutral comet assay, cell proliferation/apoptosis assays, and standard statistical tests (t-test, ANOVA with Holm-Sidak or Tukey, Kruskal-Wallis with Dunn’s).
Limitations
- The paper states that not all aspects of BRD4 inhibition-induced senolysis may be explained by the described factors; it remains unclear whether BETd senolytic effects are common to all senescent cell types in vivo, partly due to lack of absolute senescence markers. It also cautions that healthy non-dividing cells rely on NHEJ and that high ARV825 concentrations (>50 nM) reduced control cell proliferation, so optimal in vivo dosing is crucial.
- Evident from the text: XRCC4 overexpression failed to rescue ARV825-induced DSBs and senolysis, and NU7026 alone increased DSBs without inducing senolysis, indicating additional mechanisms beyond NHEJ inhibition. The study relies on cultured cells and mouse models, with no human clinical data.
Model-written summary. Check it against the paper before relying on it.
Integrity signals
Registry
Cites
Statistics
Figures
Verification
Claims the paper makes
36 Own result · 20 Not checked yet · 18 Own interpretation · 2 Own method · 1 Partly supported · 1 No basis given · accuracy not yet measured
A result the paper reports from its own data — it cites no other source for it, so there is none to check. The quote shows it is in the paper.
In the paper
“A cell viability analysis based on measurements of the ATP levels and Caspase3/7 activity revealed that 15 small molecules preferentially induce cell death in Ras-induced senescent cells, as compared to the control non-senescent cells.”
§ A BET family protein degrader provokes senolysis by targeting NHEJ and autophagy in senescent cells > Results > High-throughput screening of senolytic drugs
plaindirect- Asserted: passes — The authors put it forward as true.
- Checkable: passes — It can be checked against evidence.
- Load-bearing: passes — The paper’s conclusions depend on it.
- Based: passes — The paper gives a reason why it holds.
None of the sources cited for this claim have been checked yet.
In the paper
“four top ranking hit molecules (JQ1, I-BET151, I-BET762, and PFI-1) turned out to be inhibitors of bromodomain and extra-terminal (BET) family proteins21,23”
§ A BET family protein degrader provokes senolysis by targeting NHEJ and autophagy in senescent cells > Results > High-throughput screening of senolytic drugs
What the sources say
- Not checked yetcites [21] Shu, S. & Polyak, K. BET bromodomain proteins as cancer therapeutic targets. Cold Spring Harb. Sympo. Quant. Biol. 81, 123–129 (2016). source
- Not checked yetcites [23] Abedin, S. M., Boddy, C. S. & Munshi, H. G. BET inhibitors in the treatment of hematologic malignancies: current insights and future prospects. OncoTargets Ther. 9, 5943–5953 (2016). source
plain- Asserted: passes — The authors put it forward as true.
- Checkable: passes — It can be checked against evidence.
- Load-bearing: passes — The paper’s conclusions depend on it.
- Based: passes — The paper gives a reason why it holds.
A result the paper reports from its own data — it cites no other source for it, so there is none to check. The quote shows it is in the paper.
In the paper
“cultured senescent HCT116 cells (a human colon cancer cell line) provoked by doxorubicin (DXR) treatment were preferentially killed by the ARV825 treatment, as compared to control HCT116 cells”
§ A BET family protein degrader provokes senolysis by targeting NHEJ and autophagy in senescent cells > Results > ARV825 provokes senolysis in vivo
plaindirect- Asserted: passes — The authors put it forward as true.
- Checkable: passes — It can be checked against evidence.
- Load-bearing: passes — The paper’s conclusions depend on it.
- Based: passes — The paper gives a reason why it holds.
A result the paper reports from its own data — it cites no other source for it, so there is none to check. The quote shows it is in the paper.
In the paper
“the expression of a series of autophagic genes was upregulated by the ARV825 treatment in senescent HDFs”
§ A BET family protein degrader provokes senolysis by targeting NHEJ and autophagy in senescent cells > Results > Autophagy is required for ARV825-induced senolysis
plaindirect- Asserted: passes — The authors put it forward as true.
- Checkable: passes — It can be checked against evidence.
- Load-bearing: passes — The paper’s conclusions depend on it.
- Based: passes — The paper gives a reason why it holds.
A result the paper reports from its own data — it cites no other source for it, so there is none to check. The quote shows it is in the paper.
In the paper
“the treatment of senescent HDFs with autophagy inhibitors, such as bafilomycin A1 or chloroquine, substantially reduced the ARV825-induced senolysis”
§ A BET family protein degrader provokes senolysis by targeting NHEJ and autophagy in senescent cells > Results > Autophagy is required for ARV825-induced senolysis
plaindirect- Asserted: passes — The authors put it forward as true.
- Checkable: passes — It can be checked against evidence.
- Load-bearing: passes — The paper’s conclusions depend on it.
- Based: passes — The paper gives a reason why it holds.
A result the paper reports from its own data — it cites no other source for it, so there is none to check. The quote shows it is in the paper.
In the paper
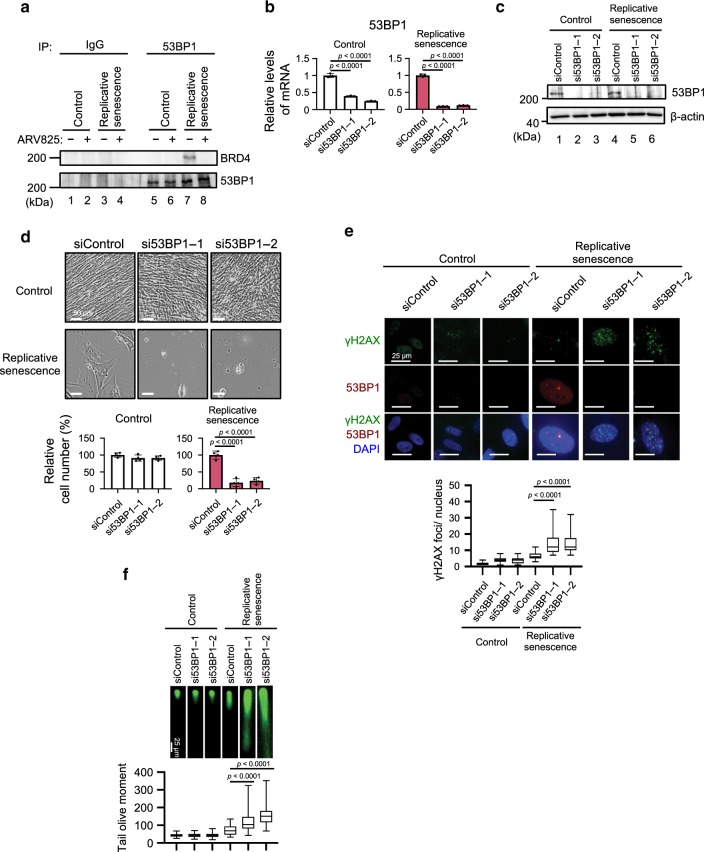
“These effects were phenocopied by the siRNA-based depletion of XRCC4 or BRD4 in senescent HDFs”
§ A BET family protein degrader provokes senolysis by targeting NHEJ and autophagy in senescent cells > Results > ARV825 inhibits the NHEJ repair machinery in senescent cells
plaincorrelational- Asserted: passes — The authors put it forward as true.
- Checkable: passes — It can be checked against evidence.
- Load-bearing: passes — The paper’s conclusions depend on it.
- Based: passes — The paper gives a reason why it holds.
A result the paper reports from its own data — it cites no other source for it, so there is none to check. The quote shows it is in the paper.
In the paper
“the effects of ARV825 were phenocopied by the depletion of 53BP1 in senescent HDFs”
§ A BET family protein degrader provokes senolysis by targeting NHEJ and autophagy in senescent cells > Results > ARV825 inhibits the NHEJ repair machinery in senescent cells
plaincorrelational- Asserted: passes — The authors put it forward as true.
- Checkable: passes — It can be checked against evidence.
- Load-bearing: passes — The paper’s conclusions depend on it.
- Based: passes — The paper gives a reason why it holds.
A result the paper reports from its own data — it cites no other source for it, so there is none to check. The quote shows it is in the paper.
In the paper
“the expression levels of the xrcc4 gene substantially declined upon the treatment of senescent HDFs with ARV825”
§ A BET family protein degrader provokes senolysis by targeting NHEJ and autophagy in senescent cells > Results > ARV825 down-regulates xrcc4 expression in senescent cells
plaindirect- Asserted: passes — The authors put it forward as true.
- Checkable: passes — It can be checked against evidence.
- Load-bearing: passes — The paper’s conclusions depend on it.
- Based: passes — The paper gives a reason why it holds.
A result the paper reports from its own data — it cites no other source for it, so there is none to check. The quote shows it is in the paper.
In the paper
“the overexpression of XRCC4 failed to rescue 53BP1 foci formation in senescent cells treated with ARV825”
§ A BET family protein degrader provokes senolysis by targeting NHEJ and autophagy in senescent cells > Results > ARV825 inhibits the NHEJ repair machinery in senescent cells
plain- Asserted: passes — The authors put it forward as true.
- Checkable: passes — It can be checked against evidence.
- Load-bearing: passes — The paper’s conclusions depend on it.
- Based: passes — The paper gives a reason why it holds.
A result the paper reports from its own data — it cites no other source for it, so there is none to check. The quote shows it is in the paper.
In the paper
“the ARV825 treatment caused the elevation of DSBs in senescent HDFs, as judged by the γH2AX foci formation assay and the neutral comet assay, regardless of how cellular senescence was induced”
§ A BET family protein degrader provokes senolysis by targeting NHEJ and autophagy in senescent cells > Results > ARV825 inhibits the NHEJ repair machinery in senescent cells
plaindirect- Asserted: passes — The authors put it forward as true.
- Checkable: passes — It can be checked against evidence.
- Load-bearing: passes — The paper’s conclusions depend on it.
- Based: passes — The paper gives a reason why it holds.
- Probably not a substantial claim. 12
- It may state two separate claims as one. 22
The cited sources support only part of this claim — read each source’s verdict below.
In the paper
“it also exhibits deleterious side effects such as chronic-inflammation and/or tumourigenesis, depending on the biological context2,3,11–13.”
§ A BET family protein degrader provokes senolysis by targeting NHEJ and autophagy in senescent cells > Introduction
What the sources say
- Supportedcites [2] Chan, A. S. L. & Narita, M. Short-term gain, long-term pain: the senescence life cycle and cancer. Genes Dev. 33, 127–143 (2019). source
In “Nonautonomous effectors > Other SASP functionality,” the review says that chronic presence of senescent cells can, through the SASP, maintain a chronically inflamed, tumorigenic microenvironment. It contrasts this with beneficial tissue repair when senescent cells are cleared, supporting the claim’s biological-context qualifier. (LLM, conf=0.94)
- Not checked yetcites [3] Lee, S. & Schmitt, C. A. The dynamic nature of senescence in cancer. Nat. Cell Biol. 21, 94–101 (2019). source
- Supportedcites [11] Rodier, F. & Campisi, J. Four faces of cellular senescence. J. Cell Biol. 192, 547–556 (2011). source
The section on age-related pathologies says the SASP contains inflammatory cytokines and that senescent cells might fuel chronic inflammation, cancer, and other pathologies through the SASP. The tumor-promotion section adds that SASP factors can promote malignancy but their effects depend on cell and tissue context. (LLM, conf=0.92)
- Partly supportedcites [12] Baker, D. J. et al. Naturally occurring p16Ink4a-positive cells shorten healthy lifespan. Nature 530, 184–189 (2016). sourceExperimental — accuracy not yet measured
The Introduction (page unavailable) describes adverse actions of the SASP and identifies its proinflammatory components; the clearance results report reduced inflammation markers. The Discussion (page unavailable) links senescent cells to tumor progression, but does not establish that the SASP itself causes chronic inflammation or tumourigenesis. (LLM, conf=0.82)
- Not checked yetcites [13] Yoshimoto, S. et al. Obesity-induced gut microbial metabolite promotes liver cancer through senescence secretome. Nature 499, 97–101 (2013). source
plaindirect- Asserted: passes — The authors put it forward as true.
- Checkable: passes — It can be checked against evidence.
- Load-bearing: passes — The paper’s conclusions depend on it.
- Based: passes — The paper gives a reason why it holds.
Probably not a substantial claim.
- Supported
A result the paper reports from its own data — it cites no other source for it, so there is none to check. The quote shows it is in the paper.
In the paper
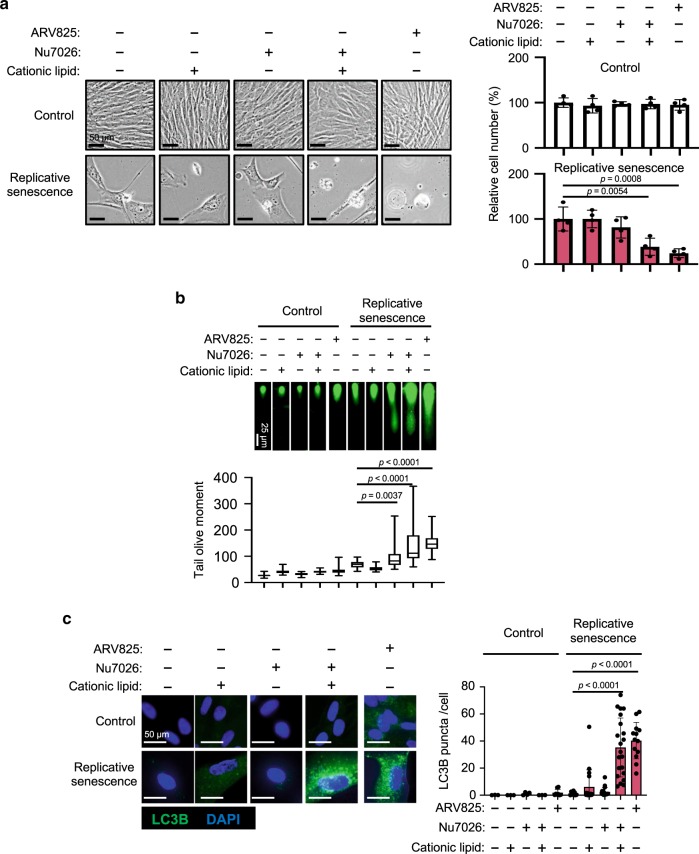
“the co-treatment with NU7026 and cationic lipids provoked increases of LC3 puncta and senolysis in senescent HDFs”
§ A BET family protein degrader provokes senolysis by targeting NHEJ and autophagy in senescent cells > Results > Autophagy is required for ARV825-induced senolysis
plaindirect- Asserted: passes — The authors put it forward as true.
- Checkable: passes — It can be checked against evidence.
- Load-bearing: passes — The paper’s conclusions depend on it.
- Based: passes — The paper gives a reason why it holds.
It may state two separate claims as one.
A result the paper reports from its own data — it cites no other source for it, so there is none to check. The quote shows it is in the paper.
In the paper
“the interaction between BRD4 and 53BP1 was observed in senescent cells, but was reduced when senescent HDFs were treated with ARV825”
§ A BET family protein degrader provokes senolysis by targeting NHEJ and autophagy in senescent cells > Results > ARV825 inhibits the NHEJ repair machinery in senescent cells
plaindirect- Asserted: passes — The authors put it forward as true.
- Checkable: passes — It can be checked against evidence.
- Load-bearing: passes — The paper’s conclusions depend on it.
- Based: passes — The paper gives a reason why it holds.
It may state two separate claims as one.
A result the paper reports from its own data — it cites no other source for it, so there is none to check. The quote shows it is in the paper.
In the paper
“although a long term treatment with ABT263 caused apoptotic cell death in confluence (contact-inhibition)-induced reversible cell-cycle arrest (quiescence), even at an optimal concentration for senolysis (500 nM), this was not the case with the ARV825 treatment”
§ A BET family protein degrader provokes senolysis by targeting NHEJ and autophagy in senescent cells > Results > High-throughput screening of senolytic drugs
plaindirect- Asserted: passes — The authors put it forward as true.
- Checkable: passes — It can be checked against evidence.
- Load-bearing: passes — The paper’s conclusions depend on it.
- Based: passes — The paper gives a reason why it holds.
It may state two separate claims as one.
A result the paper reports from its own data — it cites no other source for it, so there is none to check. The quote shows it is in the paper.
In the paper
“the siRNA-based depletion of XRCC4 exacerbated the formation of DSBs without blocking the 53BP1 localisation to DSB sites in senescent cells”
§ A BET family protein degrader provokes senolysis by targeting NHEJ and autophagy in senescent cells > Results > ARV825 inhibits the NHEJ repair machinery in senescent cells
plaindirect- Asserted: passes — The authors put it forward as true.
- Checkable: passes — It can be checked against evidence.
- Load-bearing: passes — The paper’s conclusions depend on it.
- Based: passes — The paper gives a reason why it holds.
It may state two separate claims as one.
A result the paper reports from its own data — it cites no other source for it, so there is none to check. The quote shows it is in the paper.
In the paper
“53BP1 foci formation was abolished upon ARV825 treatment or BRD4 depletion, accompanied by the exacerbation of DSBs in senescent HDFs”
§ A BET family protein degrader provokes senolysis by targeting NHEJ and autophagy in senescent cells > Results > ARV825 inhibits the NHEJ repair machinery in senescent cells
plaindirect- Asserted: passes — The authors put it forward as true.
- Checkable: passes — It can be checked against evidence.
- Load-bearing: passes — The paper’s conclusions depend on it.
- Based: passes — The paper gives a reason why it holds.
It may state two separate claims as one.
A result the paper reports from its own data — it cites no other source for it, so there is none to check. The quote shows it is in the paper.
In the paper
“ARV825 had the strongest senolytic activity and killed senescent HDFs at a five to ten nanomolar concentration, regardless of the manner of cellular senescence induction”
§ A BET family protein degrader provokes senolysis by targeting NHEJ and autophagy in senescent cells > Results > High-throughput screening of senolytic drugs
plaindirect- Asserted: passes — The authors put it forward as true.
- Checkable: passes — It can be checked against evidence.
- Load-bearing: passes — The paper’s conclusions depend on it.
- Based: passes — The paper gives a reason why it holds.
It may state two separate claims as one.
A result the paper reports from its own data — it cites no other source for it, so there is none to check. The quote shows it is in the paper.
In the paper
“the NU7026 treatment failed to induce senolysis in senescent HDFs, although the DSBs were increased to the same levels as those seen with the ARV825 treatment”
§ A BET family protein degrader provokes senolysis by targeting NHEJ and autophagy in senescent cells > Results > Autophagy is required for ARV825-induced senolysis
plain- Asserted: passes — The authors put it forward as true.
- Checkable: passes — It can be checked against evidence.
- Load-bearing: passes — The paper’s conclusions depend on it.
- Based: passes — The paper gives a reason why it holds.
It may state two separate claims as one.
A result the paper reports from its own data — it cites no other source for it, so there is none to check. The quote shows it is in the paper.
In the paper
“this was not the case when senescent HDFs were separately treated with either the cationic lipids or the DNA-PK inhibitor”
§ A BET family protein degrader provokes senolysis by targeting NHEJ and autophagy in senescent cells > Results > Autophagy is required for ARV825-induced senolysis
plain- Asserted: passes — The authors put it forward as true.
- Checkable: passes — It can be checked against evidence.
- Load-bearing: passes — The paper’s conclusions depend on it.
- Based: passes — The paper gives a reason why it holds.
It may state two separate claims as one.
A result the paper reports from its own data — it cites no other source for it, so there is none to check. The quote shows it is in the paper.
In the paper
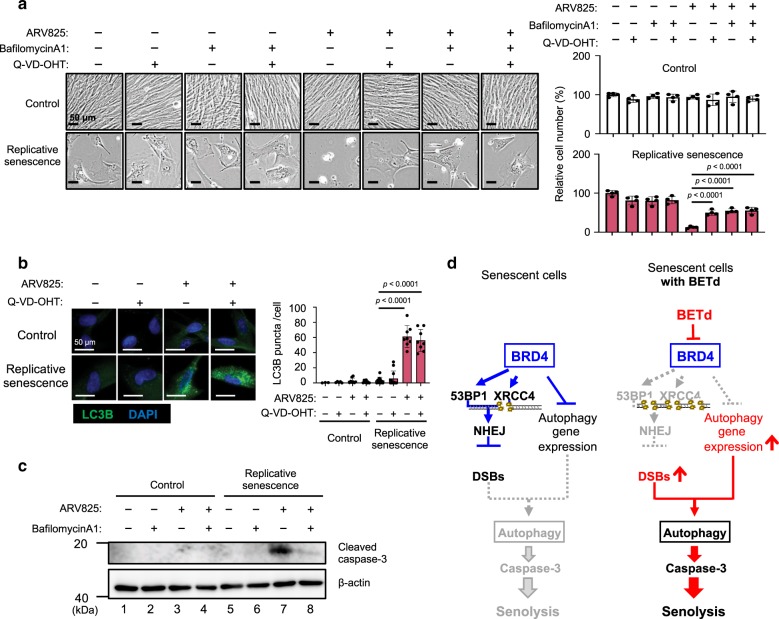
“On the other hand, although the bafilomycin A1 treatment attenuated the ARV825-induced senolysis, this was accompanied by a substantial reduction of the activated caspase 3 levels (Fig. 7a and c).”
§ A BET family protein degrader provokes senolysis by targeting NHEJ and autophagy in senescent cells > Results > Autophagy machinery preceded the apoptosis in senolysis
plaindirect- Asserted: passes — The authors put it forward as true.
- Checkable: passes — It can be checked against evidence.
- Load-bearing: passes — The paper’s conclusions depend on it.
- Based: passes — The paper gives a reason why it holds.
It may state two separate claims as one.
A result the paper reports from its own data — it cites no other source for it, so there is none to check. The quote shows it is in the paper.
In the paper
“and a treatment with a caspase inhibitor (Q-VD-OHT) attenuated the senolysis provoked by ARV825, without reducing the number of LC3 puncta in senescent HDFs (Fig. 7a and b).”
§ A BET family protein degrader provokes senolysis by targeting NHEJ and autophagy in senescent cells > Results > Autophagy machinery preceded the apoptosis in senolysis
plaindirect- Asserted: passes — The authors put it forward as true.
- Checkable: passes — It can be checked against evidence.
- Load-bearing: passes — The paper’s conclusions depend on it.
- Based: passes — The paper gives a reason why it holds.
It may state two separate claims as one.
None of the sources cited for this claim have been checked yet.
In the paper
“the combination of dasatinib and quercetin (D + Q), another previously reported senolytic drug20, apparently exhibited remarkable cell-type specificity15”
§ A BET family protein degrader provokes senolysis by targeting NHEJ and autophagy in senescent cells > Introduction
What the sources say
- Not checked yetcites [15] Childs, B. G. et al. Senescent cells: an emerging target for diseases of ageing. Nat. Rev. Drug Discov. 16, 718–735 (2017). source
- Not checked yetcites [20] Zhu, Y. et al. The Achilles’ heel of senescent cells: from transcriptome to senolytic drugs. Aging Cell 14, 644–658 (2015). source
hedgedcorrelational- Asserted: passes — The authors put it forward as true.
- Checkable: passes — It can be checked against evidence.
- Load-bearing: fails — The paper’s conclusions may not depend on it.
- Based: passes — The paper gives a reason why it holds.
Probably not a substantial claim. The paper’s conclusions may not depend on it.
A conclusion the paper draws from its own results — it cites no other source for it, so there is none to check. The quote shows it is in the paper.
In the paper
“strongly suggest that ARV825 has the potential to eliminate senescent HSCs in vivo, thereby reducing HCC development, at least in our obesity mouse model.”
§ A BET family protein degrader provokes senolysis by targeting NHEJ and autophagy in senescent cells > Results > ARV825 provokes senolysis in vivo
boostedconditional- Asserted: passes — The authors put it forward as true.
- Checkable: passes — It can be checked against evidence.
- Load-bearing: passes — The paper’s conclusions depend on it.
- Based: passes — The paper gives a reason why it holds.
It may state two separate claims as one.
A conclusion the paper draws from its own results — it cites no other source for it, so there is none to check. The quote shows it is in the paper.
In the paper
“Collectively, these results strongly suggest that ARV825 also has senolytic activity in vivo and could have some beneficial impact on the deleterious side effects of senescent cells, depending on the biological context.”
§ A BET family protein degrader provokes senolysis by targeting NHEJ and autophagy in senescent cells > Results > ARV825 provokes senolysis in vivo
hedgedconditional- Asserted: passes — The authors put it forward as true.
- Checkable: passes — It can be checked against evidence.
- Load-bearing: passes — The paper’s conclusions depend on it.
- Based: passes — The paper gives a reason why it holds.
It may state two separate claims as one.
None of the sources cited for this claim have been checked yet.
In the paper
“in a phase II study of ABT263 (a specific inhibitor of the anti-apoptotic proteins BCL2 and BCL-xL)19 for the treatment of advanced and recurrent small-cell lung carcinoma patients, transient thrombocytopenia and neutropenia were reported as side-effects15.”
§ A BET family protein degrader provokes senolysis by targeting NHEJ and autophagy in senescent cells > Introduction
What the sources say
- Not checked yetcites [15] Childs, B. G. et al. Senescent cells: an emerging target for diseases of ageing. Nat. Rev. Drug Discov. 16, 718–735 (2017). source
- Not checked yetcites [19] Chang, J. et al. Clearance of senescent cells by ABT263 rejuvenates aged hematopoietic stem cells in mice. Nat. Med 22, 78–83 (2016). source
plaindirect- Asserted: passes — The authors put it forward as true.
- Checkable: passes — It can be checked against evidence.
- Load-bearing: passes — The paper’s conclusions depend on it.
- Based: passes — The paper gives a reason why it holds.
Probably not a substantial claim.
A conclusion the paper draws from its own results — it cites no other source for it, so there is none to check. The quote shows it is in the paper.
In the paper
“BETd provokes senolysis through two independent but integrated pathways; the attenuation of non-homologous end joining (NHEJ), and the up-regulation of autophagic gene expression.”
§ A BET family protein degrader provokes senolysis by targeting NHEJ and autophagy in senescent cells > Abstract
plaindirect- Asserted: passes — The authors put it forward as true.
- Checkable: passes — It can be checked against evidence.
- Load-bearing: passes — The paper’s conclusions depend on it.
- Based: passes — The paper gives a reason why it holds.
It may state two separate claims as one.
In the paper
“the elimination of therapy-induced senescent cells reduced several side-effects of chemotherapy and even cancer recurrence in mice14.”
§ A BET family protein degrader provokes senolysis by targeting NHEJ and autophagy in senescent cells > Introduction
What the sources say
- Not checked yetcites [14] Demaria, M. et al. Cellular senescence promotes adverse effects of chemotherapy and cancer relapse. Cancer Disco. 7, 165–176 (2017). source
plaindirect- Asserted: passes — The authors put it forward as true.
- Checkable: passes — It can be checked against evidence.
- Load-bearing: passes — The paper’s conclusions depend on it.
- Based: passes — The paper gives a reason why it holds.
It may state two separate claims as one.
None of the sources cited for this claim have been checked yet.
In the paper
“However, the senolytic drugs identified to date were not discovered by a truly unbiased high-throughput screening (HTS) method, and thus appear to have limitations in clinical applications15,17–19.”
§ A BET family protein degrader provokes senolysis by targeting NHEJ and autophagy in senescent cells > Introduction
What the sources say
- Not checked yetcites [15] Childs, B. G. et al. Senescent cells: an emerging target for diseases of ageing. Nat. Rev. Drug Discov. 16, 718–735 (2017). source
- Not checked yetcites [17] Yosef, R. et al. Directed elimination of senescent cells by inhibition of BCL-W and BCL-XL. Nat. Commun. 7, 11190 (2016). source
- Not checked yetcites [18] Baar, M. P. et al. Targeted apoptosis of senescent cells restores tissue homeostasis in response to chemotoxicity and aging. Cell 169, 132–147.e116 (2017). source
- Not checked yetcites [19] Chang, J. et al. Clearance of senescent cells by ABT263 rejuvenates aged hematopoietic stem cells in mice. Nat. Med 22, 78–83 (2016). source
hedgeddirect- Asserted: passes — The authors put it forward as true.
- Checkable: passes — It can be checked against evidence.
- Load-bearing: passes — The paper’s conclusions depend on it.
- Based: passes — The paper gives a reason why it holds.
It may state two separate claims as one.
A conclusion the paper draws from its own results — it cites no other source for it, so there is none to check. The quote shows it is in the paper.
In the paper
“indicating that the treatment with cationic lipids and the exacerbation of DSBs are both required for the full activation of the autophagic machinery in senescent cells.”
§ A BET family protein degrader provokes senolysis by targeting NHEJ and autophagy in senescent cells > Results > Autophagy is required for ARV825-induced senolysis
hedgeddirect- Asserted: passes — The authors put it forward as true.
- Checkable: passes — It can be checked against evidence.
- Load-bearing: passes — The paper’s conclusions depend on it.
- Based: passes — The paper gives a reason why it holds.
It may state two separate claims as one.
None of the sources cited for this claim have been checked yet.
In the paper
“we decided to use a combination of other senescence markers, such as the induction of p21Waf1/Cip1/Sdi1 expression28, the reduction of Lamin B1 expression29,30, and the increase of DNA damage response (DDR) marker, such as 53BP1 foci formation27, throughout this study.”
§ A BET family protein degrader provokes senolysis by targeting NHEJ and autophagy in senescent cells > Results > High-throughput screening of senolytic drugs
What the sources say
- Not checked yetcites [28] Noda, A., Ning, Y., Venable, S. F., Pereira-Smith, O. M. & Smith, J. R. Cloning of senescent cell-derived inhibitors of DNA synthesis using an expression screen. Exp. Cell Res. 211, 90–98 (1994). source
- Not checked yetcites [29] Freund, A., Laberge, R. M., Demaria, M. & Campisi, J. Lamin B1 loss is a senescence-associated biomarker. Mol. Biol. Cell 23, 2066–2075 (2012). source
- Not checked yetcites [30] Shimi, T. et al. The role of nuclear lamin B1 in cell proliferation and senescence. Genes Dev. 25, 2579–2593 (2011). source
- Not checked yetcites [27] Imai, Y. et al. Crosstalk between the Rb pathway and AKT signaling forms a quiescence-senescence switch. Cell Rep. 7, 194–207 (2014). source
plain- Asserted: passes — The authors put it forward as true.
- Checkable: passes — It can be checked against evidence.
- Load-bearing: passes — The paper’s conclusions depend on it.
- Based: passes — The paper gives a reason why it holds.
Probably not a substantial claim.
None of the sources cited for this claim have been checked yet.
In the paper
“BRD4 has the potential to bind 53BP1, a DNA damage response protein serving as an adaptor for the assembly and activation of the DNA repair machinery, and recruit it to DSB sites, thereby facilitating NHEJ in a transcriptionally independent manner32,33.”
§ A BET family protein degrader provokes senolysis by targeting NHEJ and autophagy in senescent cells > Results > ARV825 inhibits the NHEJ repair machinery in senescent cells
What the sources say
- Not checked yetcites [32] Stanlie, A., Yousif, A. S., Akiyama, H., Honjo, T. & Begum, N. A. Chromatin reader Brd4 functions in Ig class switching as a repair complex adaptor of nonhomologous end-joining. Mol. Cell 55, 97–110 (2014). source
- Not checked yetcites [33] Li, X. et al. BRD4 promotes DNA repair and mediates the formation of TMPRSS2-ERG gene rearrangements in prostate cancer. Cell Rep. 22, 796–808 (2018). source
hedgeddirect- Asserted: passes — The authors put it forward as true.
- Checkable: passes — It can be checked against evidence.
- Load-bearing: passes — The paper’s conclusions depend on it.
- Based: passes — The paper gives a reason why it holds.
It may state two separate claims as one.
What the paper did — it cites no source for this, so there is none to check. The quote shows it is in the paper.
In the paper
“All experiments except Fig. 1a was repeated at least twice independently with similar results.”
§ A BET family protein degrader provokes senolysis by targeting NHEJ and autophagy in senescent cells > Methods > Statistics and reproducibility
plain- Asserted: passes — The authors put it forward as true.
- Checkable: passes — It can be checked against evidence.
- Load-bearing: fails — The paper’s conclusions may not depend on it.
- Based: passes — The paper gives a reason why it holds.
Probably not a substantial claim. The paper’s conclusions may not depend on it.
None of the sources cited for this claim have been checked yet.
In the paper
“senescent cells are viable for long periods of time and thereby accumulate with age in various organs and tissues5–7.”
§ A BET family protein degrader provokes senolysis by targeting NHEJ and autophagy in senescent cells > Introduction
What the sources say
- Not checked yetcites [5] Krishnamurthy, J. et al. Ink4a/Arf expression is a biomarker of aging. J. Clin. Invest. 114, 1299–1307 (2004). source
- Not checked yetcites [6] Herbig, U., Ferreira, M., Condel, L., Carey, D. & Sedivy, J. M. Cellular senescence in aging primates. Science 311, 1257 (2006). source
- Not checked yetcites [7] Yamakoshi, K. et al. Real-time in vivo imaging of p16Ink4a reveals cross talk with p53. J. Cell Biol. 186, 393–407 (2009). source
plaindirect- Asserted: passes — The authors put it forward as true.
- Checkable: passes — It can be checked against evidence.
- Load-bearing: passes — The paper’s conclusions depend on it.
- Based: passes — The paper gives a reason why it holds.
Probably not a substantial claim. It may state two separate claims as one.
In the paper
“BRD4 inhibition has recently been reported to induce autophagic gene expression22.”
§ A BET family protein degrader provokes senolysis by targeting NHEJ and autophagy in senescent cells > Results > Autophagy is required for ARV825-induced senolysis
What the sources say
- Not checked yetcites [22] Sakamaki, J. I. et al. Bromodomain protein BRD4 is a transcriptional repressor of autophagy and lysosomal function. Mol. Cell 66, 517–532.e519 (2017). source
plaindirect- Asserted: passes — The authors put it forward as true.
- Checkable: passes — It can be checked against evidence.
- Load-bearing: passes — The paper’s conclusions depend on it.
- Based: passes — The paper gives a reason why it holds.
Probably not a substantial claim.
A conclusion the paper draws from its own results — it cites no other source for it, so there is none to check. The quote shows it is in the paper.
In the paper
“it remains unclear whether the senolytic effects of BETd are common to all types of senescent cells in vivo.”
§ A BET family protein degrader provokes senolysis by targeting NHEJ and autophagy in senescent cells > Discussion
hedged- Asserted: passes — The authors put it forward as true.
- Checkable: passes — It can be checked against evidence.
- Load-bearing: fails — The paper’s conclusions may not depend on it.
- Based: passes — The paper gives a reason why it holds.
Probably not a substantial claim. The paper’s conclusions may not depend on it.
In the paper
“Since our current knowledge of senescent cells is largely based on cell culture systems, and efforts to characterise senescent cells in vivo have been limited due to the lack of absolute markers for senescent cells1”
§ A BET family protein degrader provokes senolysis by targeting NHEJ and autophagy in senescent cells > Discussion
What the sources say
- Not checked yetcites [1] Gorgoulis, V. et al. Cellular senescence: defining a path forward. Cell 179, 813–827 (2019). source
plaindirect- Asserted: passes — The authors put it forward as true.
- Checkable: passes — It can be checked against evidence.
- Load-bearing: fails — The paper’s conclusions may not depend on it.
- Based: passes — The paper gives a reason why it holds.
Probably not a substantial claim. The paper’s conclusions may not depend on it. It may state two separate claims as one.
A conclusion the paper draws from its own results — it cites no other source for it, so there is none to check. The quote shows it is in the paper.
In the paper
“In the present study, we have identified BETd as a promising senolytic drug, through an unbiased high-throughput screening of chemical compound libraries consisting of around 47,000 small molecules.”
- Also stated in: § Discussion · hedged
“further support the idea that BETd could be a promising senolytic drug.”
§ A BET family protein degrader provokes senolysis by targeting NHEJ and autophagy in senescent cells > Discussion
plain- Asserted: passes — The authors put it forward as true.
- Checkable: passes — It can be checked against evidence.
- Load-bearing: passes — The paper’s conclusions depend on it.
- Based: passes — The paper gives a reason why it holds.
It may state two separate claims as one.
- Also stated in: § Discussion · hedged
In the paper
“The protein encoded by the xrcc4 gene (XRCC4) forms a complex with DNA ligase IV (LIG4) and plays an important role in non-homologous end joining (NHEJ) repair for DNA double-strand breaks (DSBs)31.”
§ A BET family protein degrader provokes senolysis by targeting NHEJ and autophagy in senescent cells > Results > ARV825 inhibits the NHEJ repair machinery in senescent cells
What the sources say
- Not checked yetcites [31] Polo, S. E. & Jackson, S. P. Dynamics of DNA damage response proteins at DNA breaks: a focus on protein modifications. Genes Dev. 25, 409–433 (2011). source
plaindirect- Asserted: passes — The authors put it forward as true.
- Checkable: passes — It can be checked against evidence.
- Load-bearing: passes — The paper’s conclusions depend on it.
- Based: passes — The paper gives a reason why it holds.
It may state two separate claims as one.
What the paper did — it cites no source for this, so there is none to check. The quote shows it is in the paper.
In the paper
“We have confirmed the absence of mycoplasma contamination in our tissue culture cells.”
§ A BET family protein degrader provokes senolysis by targeting NHEJ and autophagy in senescent cells > Methods > Cell culture
plain- Asserted: passes — The authors put it forward as true.
- Checkable: passes — It can be checked against evidence.
- Load-bearing: fails — The paper’s conclusions may not depend on it.
- Based: passes — The paper gives a reason why it holds.
Probably not a substantial claim. The paper’s conclusions may not depend on it.
In the paper
“the recent observation that the aberrant activation of autophagy results in caspase-dependent apoptotic cell death38”
§ A BET family protein degrader provokes senolysis by targeting NHEJ and autophagy in senescent cells > Results > Autophagy machinery preceded the apoptosis in senolysis
What the sources say
- Not checked yetcites [38] Chung, Y. et al. Dysregulated autophagy contributes to caspase-dependent neuronal apoptosis. Cell Death Dis. 9, 1189 (2018). source
plaindirect- Asserted: passes — The authors put it forward as true.
- Checkable: passes — It can be checked against evidence.
- Load-bearing: passes — The paper’s conclusions depend on it.
- Based: passes — The paper gives a reason why it holds.
Probably not a substantial claim.
A conclusion the paper draws from its own results — it cites no other source for it, so there is none to check. The quote shows it is in the paper.
In the paper
“BETd treatment, however, over-rides this steady-state and thereby causing autophagy (right).”
§ A BET family protein degrader provokes senolysis by targeting NHEJ and autophagy in senescent cells > Results > Autophagy is required for ARV825-induced senolysis
plaindirect- Asserted: passes — The authors put it forward as true.
- Checkable: passes — It can be checked against evidence.
- Load-bearing: passes — The paper’s conclusions depend on it.
- Based: passes — The paper gives a reason why it holds.
It may state two separate claims as one.
A conclusion the paper draws from its own results — it cites no other source for it, so there is none to check. The quote shows it is in the paper.
In the paper
“It should be noted, however, that all aspects of the BRD4 inhibition-induced senolysis might not be explained by the factors described here.”
§ A BET family protein degrader provokes senolysis by targeting NHEJ and autophagy in senescent cells > Discussion
hedged- Asserted: passes — The authors put it forward as true.
- Checkable: fails — It may be too vague to check against evidence.
- Load-bearing: fails — The paper’s conclusions may not depend on it.
- Based: passes — The paper gives a reason why it holds.
Probably not a substantial claim. It may be too vague to check against evidence. The paper’s conclusions may not depend on it.
The paper relies on this without support.
DSBs occur less frequently in quiescent cells.
“However, since DSBs occur less frequently in quiescent cells, the blockade of NHEJ is likely to have a relatively minor impact in quiescent cells”
Claims other papers make about this one
Each is checked against this paper’s own text: does it say what the citing paper says it does?
The source backs part of the claim, not all of it — or backs it for a different population, condition or comparison.
In the citing paper
“However, a recent chemical screen identified a small molecule that degrades BRD4 and has senolytic activity104.”
From Cellular senescence in ageing: from mechanisms to therapeutic opportunities (2021) · cites this paper as [104]
Experimental — accuracy not yet measuredThe source backs part of the claim, not all of it — or backs it for a different population, condition or comparison.
In the citing paper
“In mice with doxorubicin- induced senescence, the BET family protein degrader ARV-825 had effective senolytic activity against senescent hepatic stellate cells and delayed liver cancer development 206 .”
From Senescence and cancer — role and therapeutic opportunities (2022) · cites this paper as [206]
Experimental — accuracy not yet measuredThe cited source says what the claim attributes to it.
In the citing paper
“autophagy is suppressed in senescent cells and reactivated by BETd to execute autophagic cell death”
From The role of cellular senescence and SASP in tumour microenvironment (2023) · cites this paper as [114]
The cited source says what the claim attributes to it.
In the citing paper
“this study showed that BETd effectively suppressed liver cancer development in mice [114]”
From The role of cellular senescence and SASP in tumour microenvironment (2023) · cites this paper as [114]
The check wasn’t confident either way, so it gives no verdict — never disputed.
In the citing paper
“A number of neutralizing antibodies directed against key components of the SASP or their receptors, including IL-6, IL-1α, IL-1β and TNF, also have shown senomorphic properties104,240–248 (TABLE 1).”
From Cellular senescence in ageing: from mechanisms to therapeutic opportunities (2021) · cites this paper as [104]
Experimental — accuracy not yet measured
The check wasn’t confident either way, so it gives no verdict — never disputed.
In the citing paper
“autophagy is suppressed in senescent cells”
From The role of cellular senescence and SASP in tumour microenvironment (2023) · cites this paper as [114]
Experimental — accuracy not yet measuredIn the citing paper
“To date, high throughput screening of commercial chemical compound libraries has led to the discovery of new families of senolytics: HSP90 inhibitors, 107 the BET family protein degraders, 108 and cardiac glycosides.37”
From The costs and benefits of senotherapeutics for human health (2022) · cites this paper as [108]
Citations
Cites
A biomarker that identifies senescent human cells in culture and in aging skin in vivo.
Dimri, G. P., Lee, X., Basile, G., Acosta, M., Scott, G., Roskelley, C., Medrano, E. E., Linskens, M., Rubelj, I., & Pereira-Smith, O. (1995) · Proceedings of the National Academy of Sciences · doi:10.1073/pnas.92.20.9363 · Cited by 7,477
LC3, a mammalian homologue of yeast Apg8p, is localized in autophagosome membranes after processing.
Kabeya, Y., Mizushima, N., Ueno, T., Yamamoto, A., Kirisako, T., Noda, T., Kominami, E., Ohsumi, Y., & Yoshimori, T. (2000) · The EMBO Journal · doi:10.1093/emboj/19.21.5720 · Cited by 6,605
Self-citationOncogenic ras provokes premature cell senescence associated with accumulation of p53 and p16INK4a
Serrano, M., Lin, A. W., McCurrach, M. E., Beach, D., & Lowe, S. W. (1997) · Cell · doi:10.1016/s0092-8674(00)81902-9 · Cited by 5,218
Cellular Senescence: Defining a Path Forward
Gorgoulis, V., Adams, P. D., Alimonti, A., Bennett, D. C., Bischof, O., Bishop, C., Campisi, J., Collado, M., Evangelou, K., Ferbeyre, G., et al. (2019) · Cell · doi:10.1016/j.cell.2019.10.005 · Cited by 3,225
Self-citationNaturally occurring p16Ink4a-positive cells shorten healthy lifespan
Baker, D. J., Childs, B. G., Durik, M., Wijers, M. E., Sieben, C. J., Zhong, J., A. Saltness, R., Jeganathan, K. B., Verzosa, G. C., Pezeshki, A., et al. (2016) · Nature · doi:10.1038/nature16932 · Cited by 2,876
The Achilles' heel of senescent cells: from transcriptome to senolytic drugs
Zhu, Y., Tchkonia, T., Pirtskhalava, T., Gower, A. C., Ding, H., Giorgadze, N., Palmer, A. K., Ikeno, Y., Hubbard, G. B., Lenburg, M., et al. (2015) · Aging Cell · doi:10.1111/acel.12344 · Cited by 2,584
Obesity-induced gut microbial metabolite promotes liver cancer through senescence secretome
Yoshimoto, S., Loo, T. M., Atarashi, K., Kanda, H., Sato, S., Oyadomari, S., Iwakura, Y., Oshima, K., Morita, H., Hattori, M., et al. (2013) · Nature · doi:10.1038/nature12347 · Cited by 2,219
Self-citationOncogene-Induced Senescence Relayed by an Interleukin-Dependent Inflammatory Network
Kuilman, T., Michaloglou, C., Vredeveld, L. C. W., Douma, S., van Doorn, R., Desmet, C. J., Aarden, L. A., Mooi, W. J., & Peeper, D. S. (2008) · Cell · doi:10.1016/j.cell.2008.03.039 · Cited by 2,086
Four faces of cellular senescence
Rodier, F., & Campisi, J. (2011) · Journal of Cell Biology · doi:10.1083/jcb.201009094 · Cited by 2,070
An Essential Role for Senescent Cells in Optimal Wound Healing through Secretion of PDGF-AA
Demaria, M., Ohtani, N., Youssef, S. A., Rodier, F., Toussaint, W., Mitchell, J. R., Laberge, R.-M., Vijg, J., Van Steeg, H., Dollé, M. E. T., et al. (2014) · Developmental Cell · doi:10.1016/j.devcel.2014.11.012 · Cited by 2,045
Self-citationClearance of senescent cells by ABT263 rejuvenates aged hematopoietic stem cells in mice
Chang, J., Wang, Y., Shao, L., Laberge, R.-M., Demaria, M., Campisi, J., Janakiraman, K., Sharpless, N. E., Ding, S., Feng, W., et al. (2016) · Nature Medicine · doi:10.1038/nm.4010 · Cited by 1,819
Chemokine signaling via the CXCR2 receptor reinforces senescence
Acosta, J. C., O'Loghlen, A., Banito, A., Guijarro, M. V., Augert, A., Raguz, S., Fumagalli, M., Da Costa, M., Brown, C., Popov, N., et al. (2008) · Cell · doi:10.1016/j.cell.2008.03.038 · Cited by 1,801
Senescence in Health and Disease
He, S., & Sharpless, N. E. (2017) · Cell · doi:10.1016/j.cell.2017.05.015 · Cited by 1,766
Ink4a/Arf expression is a biomarker of aging
Krishnamurthy, J., Torrice, C., Ramsey, M. R., Kovalev, G. I., Al-Regaiey, K., Su, L., & Sharpless, N. E. (2004) · Journal of Clinical Investigation · doi:10.1172/jci22475 · Cited by 1,486
Baar, M. P., Brandt, R. M. C., Putavet, D. A., Klein, J. D. D., Derks, K. W. J., Bourgeois, B. R. M., Stryeck, S., Rijksen, Y., van Willigenburg, H., Feijtel, D. A., et al. (2017) · Cell · doi:10.1016/j.cell.2017.02.031 · Cited by 1,454
Cloning of senescent cell-derived inhibitors of DNA synthesis using an expression screen
Noda, A., Ning, Y., Venable, S. F., Pereira-Smith, O. M., & Smith, J. R. (1994) · Experimental Cell Research · doi:10.1006/excr.1994.1063 · Cited by 1,351
Cellular senescence promotes adverse effects of chemotherapy and cancer relapse
Demaria, M., O'Leary, M. N., Chang, J., Shao, L., Liu, S., Alimirah, F., Koenig, K., Le, C., Mitin, N., Deal, A. M., et al. (2017) · Cancer Discovery · doi:10.1158/2159-8290.cd-16-0241 · Cited by 1,338
Senescent cells: an emerging target for diseases of ageing
Childs, B. G., Gluscevic, M., Baker, D. J., Laberge, R.-M., Marquess, D., Dananberg, J., & van Deursen, J. M. (2017) · Nature Reviews Drug Discovery · doi:10.1038/nrd.2017.116 · Cited by 1,284
Hijacking the E3 Ubiquitin Ligase Cereblon to Efficiently Target BRD4
Lu, J., Qian, Y., Altieri, M., Dong, H., Wang, J., Raina, K., Hines, J., Winkler, J. D., Crew, A. P., Coleman, K., et al. (2015) · Chemistry & Biology · doi:10.1016/j.chembiol.2015.05.009 · Cited by 1,140
Cellular Senescence in Aging Primates
Herbig, U., Ferreira, M., Condel, L., Carey, D., & Sedivy, J. M. (2006) · Science · doi:10.1126/science.1122446 · Cited by 1,101
Dynamics of DNA damage response proteins at DNA breaks: a focus on protein modifications
Polo, S. E., & Jackson, S. P. (2011) · Genes & Development · doi:10.1101/gad.2021311 · Cited by 1,092
Lamin B1 loss is a senescence-associated biomarker
Freund, A., Laberge, R.-M., Demaria, M., & Campisi, J. (2012) · Molecular Biology of the Cell · doi:10.1091/mbc.e11-10-0884 · Cited by 1,046
Directed elimination of senescent cells by inhibition of BCL-W and BCL-XL
Yosef, R., Pilpel, N., Tokarsky-Amiel, R., Biran, A., Ovadya, Y., Cohen, S., Vadai, E., Dassa, L., Shahar, E., Condiotti, R., et al. (2016) · Nature Communications · doi:10.1038/ncomms11190 · Cited by 1,032
Identification of HSP90 inhibitors as a novel class of senolytics
Fuhrmann-Stroissnigg, H., Ling, Y. Y., Zhao, J., McGowan, S. J., Zhu, Y., Brooks, R. W., Grassi, D., Gregg, S. Q., Stripay, J. L., Dorronsoro, A., et al. (2017) · Nature Communications · doi:10.1038/s41467-017-00314-z · Cited by 701
A brief history of autophagy from cell biology to physiology and disease
Mizushima, N. (2018) · Nature Cell Biology · doi:10.1038/s41556-018-0092-5 · Cited by 696
The dynamic nature of senescence in cancer
Lee, S., & Schmitt, C. A. (2019) · Nature Cell Biology · doi:10.1038/s41556-018-0249-2 · Cited by 588
The role of nuclear lamin B1 in cell proliferation and senescence
Shimi, T., Butin-Israeli, V., Adam, S. A., Hamanaka, R. B., Goldman, A. E., Lucas, C. A., Shumaker, D. K., Kosak, S. T., Chandel, N. S., & Goldman, R. D. (2011) · Genes & Development · doi:10.1101/gad.179515.111 · Cited by 547
Takahashi, A., Ohtani, N., Yamakoshi, K., Iida, S.-I., Tahara, H., Nakayama, K., Nakayama, K. I., Ide, T., Saya, H., & Hara, E. (2006) · Nature Cell Biology · doi:10.1038/ncb1491 · Cited by 528
Self-citationBRD4 Connects Enhancer Remodeling to Senescence Immune Surveillance
Tasdemir, N., Banito, A., Roe, J.-S., Alonso-Curbelo, D., Camiolo, M., Tschaharganeh, D. F., Huang, C.-H., Aksoy, O., Bolden, J. E., Chen, C.-C., et al. (2016) · Cancer Discovery · doi:10.1158/2159-8290.cd-16-0217 · Cited by 415
Jensen, M. M., Jørgensen, J. T., Binderup, T., & Kjær, A. (2008) · BMC Medical Imaging · doi:10.1186/1471-2342-8-16 · Cited by 394
Stathis, A., Zucca, E., Békradda, M., Gomez‐Roca, C., Delord, J., Rouge, T. D. L. M., Uro‐Coste, E., de Braud, F., Pelosi, G., & French, C. A. (2016) · Cancer Discovery · doi:10.1158/2159-8290.cd-15-1335 · Cited by 387
Identification and characterization of Cardiac Glycosides as senolytic compounds
Triana-Martínez, F., Picallos-Rabina, P., Da Silva-Álvarez, S., Pietrocola, F., Llanos, S., Rodilla, V., Soprano, E., Pedrosa, P., Ferreirós, A., Barradas, M., et al. (2019) · Nature Communications · doi:10.1038/s41467-019-12888-x · Cited by 384
Cardiac glycosides are broad-spectrum senolytics
Guerrero, A., Herranz, N., Sun, B., Wagner, V., Gallage, S., Guiho, R., Wolter, K., Pombo, J., Irvine, E. E., Innes, A. J., et al. (2019) · Nature Metabolism · doi:10.1038/s42255-019-0122-z · Cited by 359
Coppé, J.-P., Patil, C. K., Rodier, F., Sun, Y., Muñoz, D. P., Goldstein, J., Nelson, P. S., Desprez, P.-Y., & Campisi, J. (2008) · PLoS Biology · doi:10.1371/journal.pbio.0060301 · Cited by 302
Bromodomain Protein BRD4 Is a Transcriptional Repressor of Autophagy and Lysosomal Function
Sakamaki, J.-I., Wilkinson, S., Hahn, M., Tasdemir, N., O’Prey, J., Clark, W., Hedley, A., Nixon, C., Long, J. S., New, M., et al. (2017) · Molecular Cell · doi:10.1016/j.molcel.2017.04.027 · Cited by 249
Takahashi, A., Imai, Y., Yamakoshi, K., Kuninaka, S., Ohtani, N., Yoshimoto, S., Hori, S., Tachibana, M., Anderton, E., Takeuchi, T., et al. (2012) · Molecular Cell · doi:10.1016/j.molcel.2011.10.018 · Cited by 205
Self-citationReal-time in vivo imaging of p16Ink4a reveals cross talk with p53
Yamakoshi, K., Takahashi, A., Hirota, F., Nakayama, R., Ishimaru, N., Kubo, Y., Mann, D. J., Ohmura, M., Hirao, A., Saya, H., et al. (2009) · Journal of Cell Biology · doi:10.1083/jcb.200904105 · Cited by 172
Self-citationDNA Damage Response and Autophagy: A Meaningful Partnership
Eliopoulos, A. G., Havaki, S., & Gorgoulis, V. G. (2016) · Frontiers in Genetics · doi:10.3389/fgene.2016.00204 · Cited by 169
Li, X., Baek, G., Ramanand, S. G., Sharp, A., Gao, Y., Yuan, W., Welti, J., Rodrigues, D. N., Dolling, D., Figueiredo, I., et al. (2018) · Cell Reports · doi:10.1016/j.celrep.2017.12.078 · Cited by 148
BET bromodomain proteins are required for glioblastoma cell proliferation
Pastori, C., Daniel, M. L., Penas, C., Volmar, C., Johnstone, A. L., Brothers, S. P., Graham, R. M., Allen, B. K., Sarkaria, J. N., Komotar, R. J., et al. (2014) · Epigenetics · doi:10.4161/epi.27906 · Cited by 147
Stanlie, A., Yousif, A. S., Akiyama, H., Honjo, T., & Begum, N. A. (2014) · Molecular Cell · doi:10.1016/j.molcel.2014.05.018 · Cited by 101
Dysregulated autophagy contributes to caspase-dependent neuronal apoptosis
Chung, Y., Lee, J., Jung, S., Lee, Y., Cho, J. W., & Oh, Y. J. (2018) · Cell Death & Disease · doi:10.1038/s41419-018-1229-y · Cited by 99
MaRX: An Approach to Genetics in Mammalian Cells
Hannon, G. J., Sun, P., Carnero, A., Xie, L. Y., Maestro, R., Conklin, D. S., & Beach, D. (1999) · Science · doi:10.1126/science.283.5405.1129 · Cited by 93
Crosstalk between the Rb pathway and AKT signaling forms a quiescence-senescence switch.
Imai, Y., Takahashi, A., Hanyu, A., Hori, S., Sato, S., Naka, K., Hirao, A., Ohtani, N., & Hara, E. (2014) · Cell Reports · doi:10.1016/j.celrep.2014.03.006 · Cited by 84
Self-citationShort-term gain, long-term pain: the senescence life cycle and cancer
Chan, A. S. L., & Narita, M. (2019) · Genes & Development · doi:10.1101/gad.320937.118 · Cited by 80
Ohtani, N., Imamura, Y., Yamakoshi, K., Hirota, F., Nakayama, R., Kubo, Y., Ishimaru, N., Takahashi, A., Hirao, A., Shimizu, T., et al. (2007) · Proceedings of the National Academy of Sciences · doi:10.1073/pnas.0706949104 · Cited by 73
Self-citationBET Bromodomain Proteins as Cancer Therapeutic Targets
Shu, S., & Polyak, K. (2016) · Cold Spring Harbor Symposia on Quantitative Biology · doi:10.1101/sqb.2016.81.030908 · Cited by 72
Real-time in vivo imaging of P16[INK]⁴[a] reveals cross talk with p53
Hara, E. (2010) · Medical Entomology and Zoology · Cited by 72
Self-citationBET inhibitors in the treatment of hematologic malignancies: current insights and future prospects
Munshi, H., Abedin, S., & Boddy, C. (2016) · OncoTargets and Therapy · doi:10.2147/ott.s100515 · Cited by 71
Induction of genuine autophagy by cationic lipids in mammalian cells
Man, N., Chen, Y., Zheng, F., Zhou, W., & Wen, L.-P. (2010) · Autophagy · doi:10.4161/auto.6.4.11612 · Cited by 70
Hromas, R., Kim, H.-S., Sidhu, G. S., Williamson, E. A., Jaiswal, A. S., Totterdale, T. A., Nole, J., Lee, S., Nickoloff, J. A., & Kong, K. Y. (2017) · Breast Cancer Research · doi:10.1186/s13058-017-0912-8 · Cited by 41
Nuclear GSK3β induces DNA double-strand break repair by phosphorylating 53BP1 in glioblastoma
Yang, Y., Lei, T., Du, S., Tong, R., Wang, H., Yang, J., Huang, J., Sun, M., Wang, Y., & Dong, Z. (2018) · International Journal of Oncology · doi:10.3892/ijo.2018.4237 · Cited by 25
Serrano, M., & Barzilai, N. (2018) · Nature Medicine · doi:10.1038/s41591-018-0141-4 · Cited by 22
Cited by
Sorted by citations
Cellular senescence in ageing: from mechanisms to therapeutic opportunities
Di Micco, R., Krizhanovsky, V., Baker, D., & d’Adda di Fagagna, F. (2021) · Nature Reviews Molecular Cell Biology · doi:10.1038/s41580-020-00314-w · Cited by 2,277
Aging and aging-related diseases: from molecular mechanisms to interventions and treatments
Guo, J., Huang, X., Dou, L., Yan, M., Shen, T., Tang, W., & Li, J. (2022) · Signal Transduction and Targeted Therapy · doi:10.1038/s41392-022-01251-0 · Cited by 1,976
Exploiting senescence for the treatment of cancer
Wang, L., Lankhorst, L., & Bernards, R. (2022) · Nature Reviews Cancer · doi:10.1038/s41568-022-00450-9 · Cited by 867
Senescence and cancer — role and therapeutic opportunities
Schmitt, C. A., Wang, B., & Demaria, M. (2022) · Nature Reviews Clinical Oncology · doi:10.1038/s41571-022-00668-4 · Cited by 794
Tumor biomarkers for diagnosis, prognosis and targeted therapy
Zhou, Y., Tao, L., Qiu, J., Xu, J., Yang, X., Zhang, Y., Tian, X., Guan, X., Cen, X., & Zhao, Y. (2024) · Signal Transduction and Targeted Therapy · doi:10.1038/s41392-024-01823-2 · Cited by 836
Metadata
- Authors
- Wakita, M., Takahashi, A., Sano, O., Loo, T. M., Imai, Y., Narukawa, M., Iwata, H., Matsudaira, T., Kawamoto, S., Ohtani, N., Yoshimori, T., & Hara, E.
- Affiliations
- Research Institute for Microbial Diseases, The University of Osaka (JP)
- Japanese Foundation For Cancer Research (JP)
- Takeda (Japan) (JP)
- Immunology Frontier Research Center, The University of Osaka (JP)
- Osaka City University (JP)
- The University of Osaka (JP)
- Corresponding author
- Hara, Eiji
- ORCID
- Venue
- Nature Communications
- Published
- 2020-04-22
- Volume
- 11
- Issue
- 1
- Pages
- 1935-1935
- ISSN
- 2041-1723 (ISSN-L)
- PMC
- PMC7176673
- OpenAlex
- W3018442280
- Semantic Scholar
- 8d288c9c73c0318686a20d8a31079c416b93b2c8
- Cited by
- 206
- References
- 54
- Citations by year
- 2026: 16 · 2025: 36 · 2024: 35 · 2023: 30 · 2022: 42 · 2021: 34 · 2020: 12
- FWCI
- 17.74
- Type
- journal article
- Language
- en
- Open access
- gold
- doi.org
- Locations
- Nature Communications (publishedVersion, cc-by)
- PubMed Central (publishedVersion, cc-by)
- PubMed (publishedVersion)
- RePEc: Research Papers in Economics (submittedVersion)
- DOAJ (DOAJ: Directory of Open Access Journals) (submittedVersion, cc-by-sa)
- Funders
- Japan Agency for Medical Research and Development (19gm501000h0003, 19cm0106401h0004)
- Topics
- Life Sciences › Biochemistry, Genetics and Molecular Biology › Cell Biology › Telomeres, Telomerase, and Senescence
- Life Sciences › Biochemistry, Genetics and Molecular Biology › Molecular Biology › Protein Degradation and Inhibitors
- Life Sciences › Biochemistry, Genetics and Molecular Biology › Aging › Genetics, Aging, and Longevity in Model Organisms
- Keywords
- senolysis, cellular senescence, non-homologous end joining, autophagy, senolytics, hepatic stellate cells, obesity, liver cancer, chemotherapy-induced senescence, tumor xenografts
- MeSH terms
- Bromodomain Containing Proteins, Animals, Antineoplastic Agents, Autophagy, Humans, Mice, Inbred C57BL, Mice, Nude, Neoplasms, Transcription Factors, Cellular Senescence, Cell Cycle Proteins, Cell Line, Tumor, Mice, DNA End-Joining Repair
About these checks
Registry, retraction, Cites and statistics results are computed, not judged, with one exception: a printed reference that no index lists is read once by a model before it counts as a citation error. Claims are extracted by a model and kept only when their quote appears verbatim in the text; each cited source is then checked, with a model’s help, for whether it says what the claim relies on. Those verdicts can be wrong — read the claim’s quote and the cited source before relying on one.
A language model drew the claims from the paper on 2026-10-10, under version 3 of the claim definition (model deepseek-v4.1-flash, prompt extract-v3).
A second model labelled each claim on 2026-10-10 (model jev-1.13-20260917, definition revision gold-guideline-v0.2).
Cited sources are checked with a language model’s help (gpt-6-sol).
Statistics and arithmetic are recomputed, not judged.
Confidence bands are shown only for fields calibrated on our annotated test set. None is calibrated yet, so no band is shown.
What counts as a claim ›How we measure confidence ›How we check this ›
Are you an author, or do you see a problem with this page? Request a review
