

The DOI matches its Crossref record; 57 of the 57 references it cites were found in a registry or an index.
Large-scale discovery of protein interactions at residue resolution using co-evolution calculated from genomic sequences
Open accessAbstract
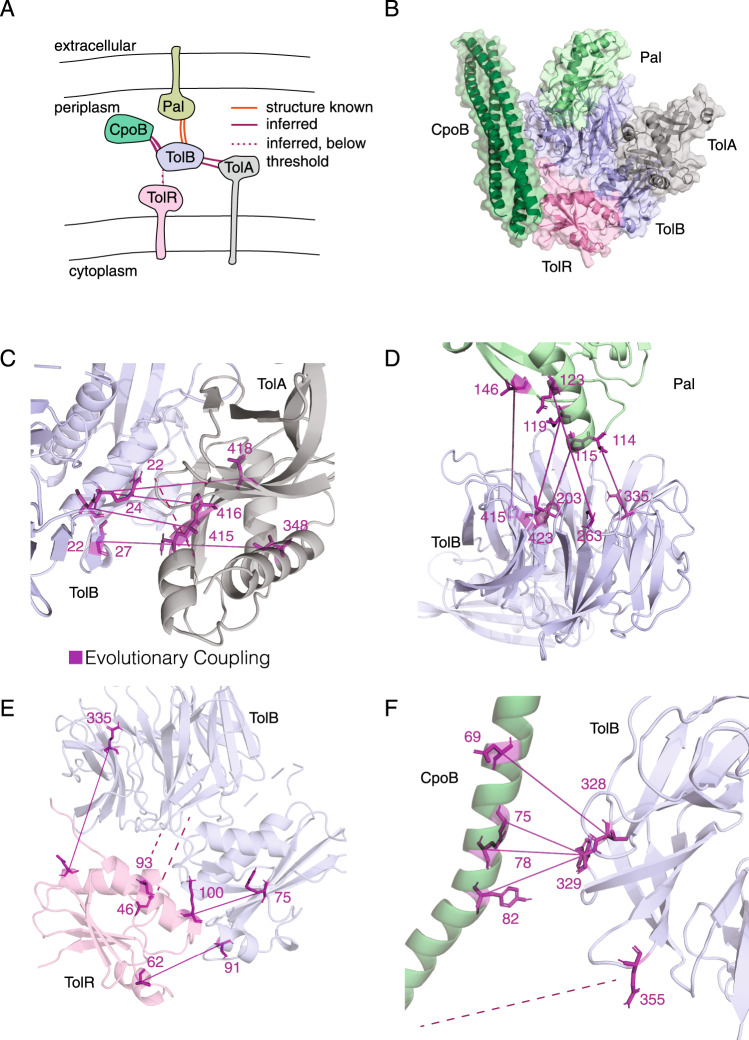
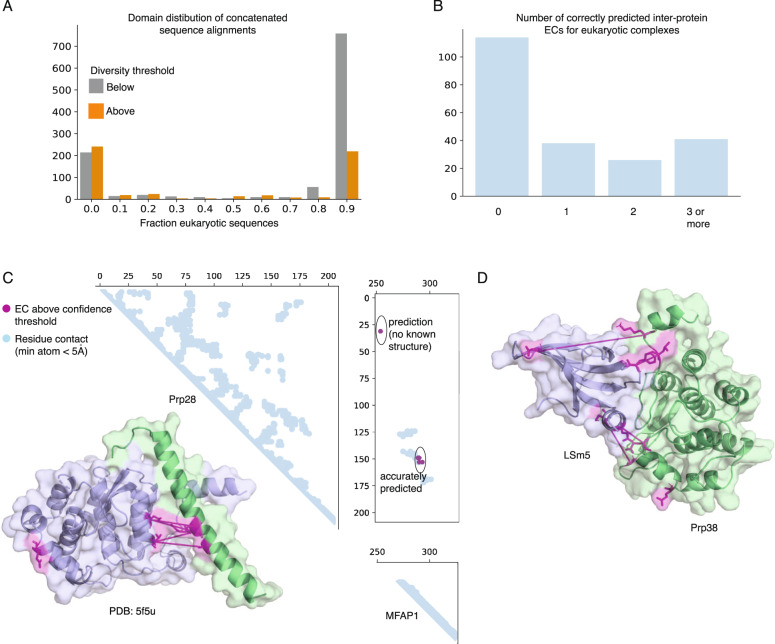
Increasing numbers of protein interactions have been identified in high-throughput experiments, but only a small proportion have solved structures. Recently, sequence coevolution-based approaches have led to a breakthrough in predicting monomer protein structures and protein interaction interfaces. Here, we address the challenges of large-scale interaction prediction at residue resolution with a fast alignment concatenation method and a probabilistic score for the interaction of residues. Importantly, this method (EVcomplex2) is able to assess the likelihood of a protein interaction, as we show here applied to large-scale experimental datasets where the pairwise interactions are unknown. We predict 504 interactions de novo in the E. coli membrane proteome, including 243 that are newly discovered. While EVcomplex2 does not require available structures, coevolving residue pairs can be used to produce structural models of protein interactions, as done here for membrane complexes including the Flagellar Hook-Filament Junction and the Tol/Pal complex.
Overview
The claims and statistics of this paper haven’t been checked yet.
Run the check — free, no account needed. It reads the open-access text and checks the sources it cites.
Integrity signals
Registry
Cites
Statistics
Figures
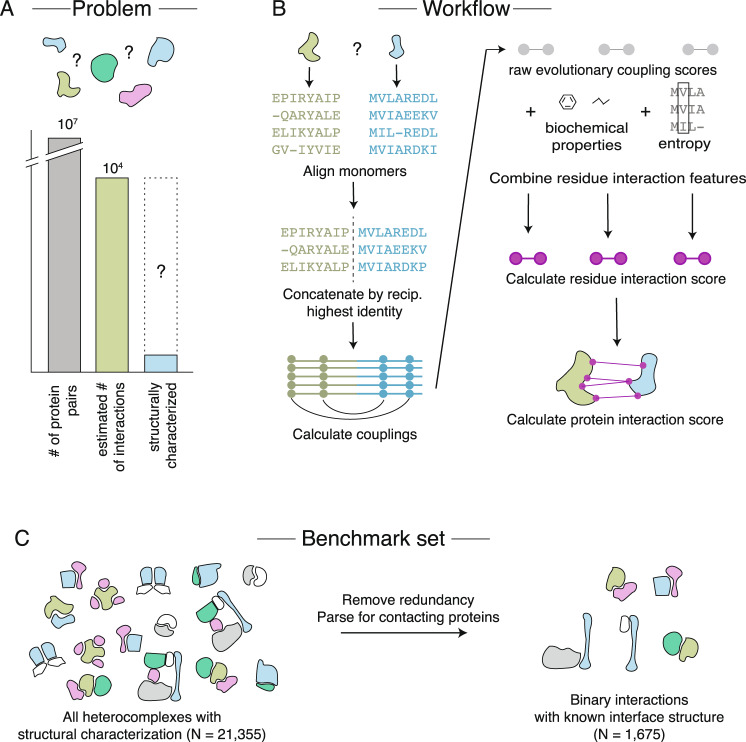
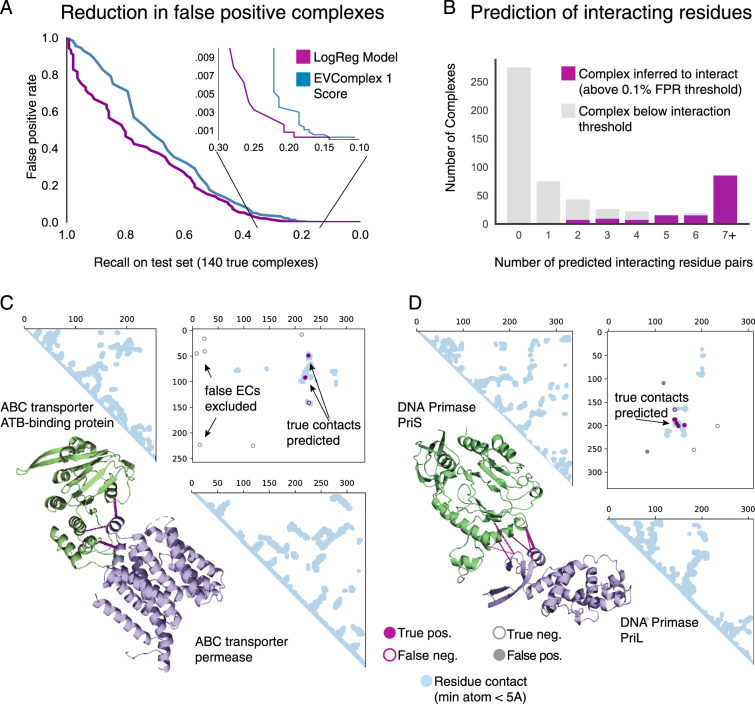
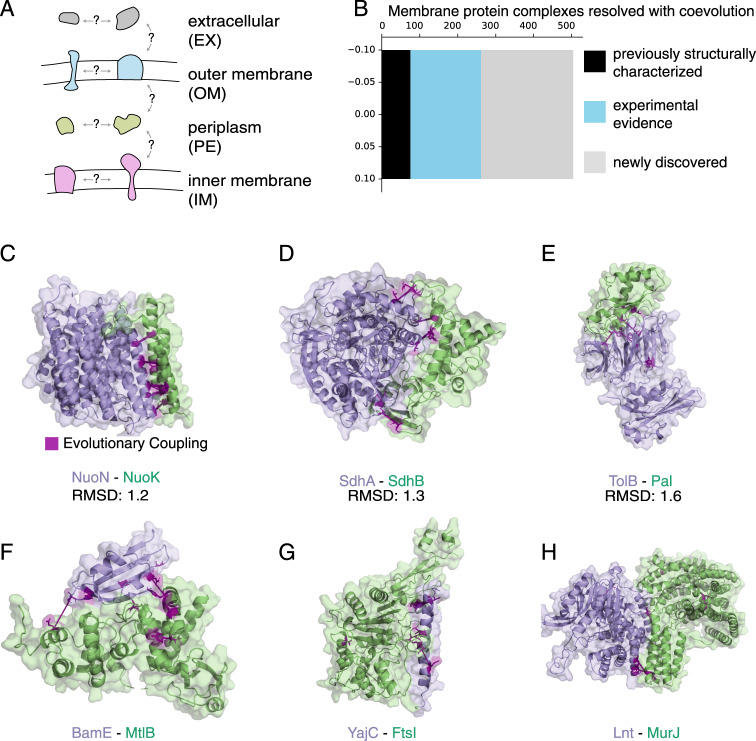
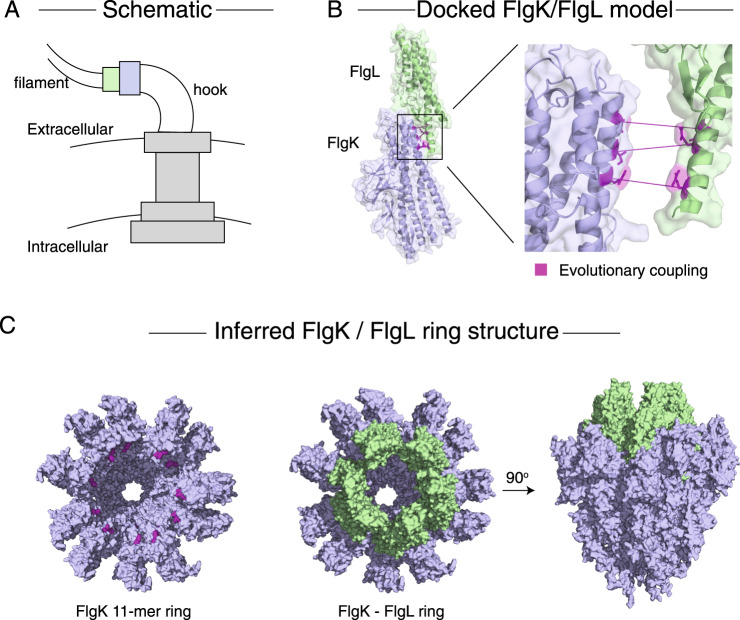
Verification
Claims the paper makes
The claims and statistics of this paper haven’t been checked yet.
Run the check — free, no account needed. It reads the open-access text and checks the sources it cites.
Claims other papers make about this one
Each is checked against this paper’s own text: does it say what the citing paper says it does?
In the citing paper
“Because residues at protein-protein interfaces are expected to coevolve, the likelihood that any two proteins interact can be assessed by identifying and aligning the ortholog sequences of the two proteins in many different species, joining them to create paired multiple sequence alignments (pMSA), and then determining the extent to which changes in the sequences of orthologs for the first protein”
From Computed structures of core eukaryotic protein complexes (2021) · cites this paper as [10]
Self-check
Percentages, sums and reported differences re-computed from the paper’s own numbers.
The self-check needs the paper’s full text.
Citations
Cites
Scikit-learn: Machine Learning in Python
Pedregosa, F., Varoquaux, G., Gramfort, A., Michel, V., Thirion, B., Grisel, O., Blondel, M., Müller, A., Nothman, J., Louppe, G., et al. (2012) · arXiv · doi:10.48550/arxiv.1201.0490 · Cited by 71,016
Kabsch, W., & Sander, C. (1983) · Biopolymers · doi:10.1002/bip.360221211 · Cited by 15,320
STRING v10: protein–protein interaction networks, integrated over the tree of life
Szklarczyk, D., Franceschini, A., Wyder, S., Forslund, K., Heller, D., Huerta-Cepas, J., Simonovic, M., Roth, A., Santos, A., Tsafou, K. P., et al. (2015) · Nucleic Acids Research · doi:10.1093/nar/gku1003 · Cited by 10,436
Inference of Macromolecular Assemblies from Crystalline State
Krissinel, E., & Henrick, K. (2007) · Journal of Molecular Biology · doi:10.1016/j.jmb.2007.05.022 · Cited by 10,007
UniProt: the Universal Protein knowledgebase
Apweiler, R. (2003) · Nucleic Acids Research · doi:10.1093/nar/gkh131 · Cited by 7,593
Accelerated Profile HMM Searches
Eddy, S. R. (2011) · PLoS Computational Biology · doi:10.1371/journal.pcbi.1002195 · Cited by 6,975
The Pfam protein families database in 2019
El-Gebali, S., Mistry, J., Bateman, A., Eddy, S. R., Luciani, A., Potter, S. C., Qureshi, M., Richardson, L. J., Salazar, G. A., Smart, A., et al. (2019) · Nucleic Acids Research · doi:10.1093/nar/gky995 · Cited by 4,602
Systematic identification of protein complexes in Saccharomyces cerevisiae by mass spectrometry
Ho, Y., Gruhler, A., Heilbut, A. M., Bader, G. D., Moore, L., Adams, S., Millar, A., Taylor, P. P., Bennett, K. L., Boutilier, K., et al. (2002) · Nature · doi:10.1038/415180a · Cited by 3,573
HADDOCK: A Protein−Protein Docking Approach Based on Biochemical or Biophysical Information
Dominguez, C., Boelens, R., & Bonvin, A. M. J. J. (2003) · Journal of the American Chemical Society · doi:10.1021/ja026939x · Cited by 3,187
Towards a proteome-scale map of the human protein–protein interaction network
Rual, J.-F. M., Venkatesan, K., Hao, T., Hirozane-Kishikawa, T., Dricot, A., Li, N., Berriz, G. F., Gibbons, F. D., Dreze, M., Ayivi-Guedehoussou, N., et al. (2005) · Nature · doi:10.1038/nature04209 · Cited by 2,904
UniProt: the universal protein knowledgebase
The UniProt Consortium (2018) · Nucleic Acids Research · doi:10.1093/nar/gky092 · Cited by 2,043
Spliceosome Structure and Function
Will, C. L., & Luhrmann, R. (2011) · Cold Spring Harbor Perspectives in Biology · doi:10.1101/cshperspect.a003707 · Cited by 1,829
Federhen, S. (2012) · Nucleic Acids Research · doi:10.1093/nar/gkr1178 · Cited by 1,436
Version 1.2 of the Crystallography and NMR system
Brünger, A. T. (2007) · Nature Protocols · doi:10.1038/nprot.2007.406 · Cited by 1,325
Kühlbrandt, W. (2014) · Science · doi:10.1126/science.1251652 · Cited by 1,325
Improved prediction of protein side‐chain conformations with SCWRL4
Krivov, G. G., Shapovalov, M. V., & Dunbrack, R. L. (2009) · Proteins Structure Function and Bioinformatics · doi:10.1002/prot.22488 · Cited by 1,312
Interaction network containing conserved and essential protein complexes in Escherichia coli
Butland, G., Peregrín-Alvarez, J. M., Li, J., Yang, W., Yang, X., Canadien, V., Starostine, A., Richards, D., Beattie, B., Krogan, N., et al. (2005) · Nature · doi:10.1038/nature03239 · Cited by 1,201
The nature of the accessible and buried surfaces in proteins
Chothia, C. (1976) · Journal of Molecular Biology · doi:10.1016/0022-2836(76)90191-1 · Cited by 1,165
Protein 3D Structure Computed from Evolutionary Sequence Variation
Marks, D. S., Colwell, L. J., Sheridan, R., Hopf, T. A., Pagnani, A., Zecchina, R., & Sander, C. (2011) · PLoS ONE · doi:10.1371/journal.pone.0028766 · Cited by 1,144
Self-citationKamisetty, H., Ovchinnikov, S., & Baker, D. A. (2013) · Proceedings of the National Academy of Sciences · doi:10.1073/pnas.1314045110 · Cited by 672
Improved contact prediction in proteins: using pseudolikelihoods to infer Potts models
Ekeberg, M., Lövkvist, C., Lan, Y., Weigt, M., & Aurell, E. (2013) · Physical Review E · doi:10.1103/physreve.87.012707 · Cited by 661
Ovchinnikov, S., Kamisetty, H., & Baker, D. (2014) · eLife · doi:10.7554/elife.02030 · Cited by 629
Xue, B., Dunker, A. K., & Uversky, V. N. (2012) · Journal of Biomolecular Structure and Dynamics · doi:10.1080/07391102.2012.675145 · Cited by 557
Similarity of phylogenetic trees as indicator of protein–protein interaction
Pazos, F., & Valencia, A. (2001) · Protein Engineering Design and Selection · doi:10.1093/protein/14.9.609 · Cited by 521
Sequence co-evolution gives 3D contacts and structures of protein complexes
Hopf, T. A., Schärfe, C. P. I., Rodrigues, J. P. G. L. M., Green, A. G., Kohlbacher, O., Sander, C., Bonvin, A. M. J. J., & Marks, D. S. (2014) · eLife · doi:10.7554/elife.03430 · Cited by 515
Self-citationThree-Dimensional Structures of Membrane Proteins from Genomic Sequencing
Hopf, T. A., Colwell, L. J., Sheridan, R., Rost, B., Sander, C., & Marks, D. S. (2012) · Cell · doi:10.1016/j.cell.2012.04.012 · Cited by 509
Self-citationGlobal Functional Atlas of Escherichia coli Encompassing Previously Uncharacterized Proteins
Hu, P., Janga, S. C., Babu, M., Díaz-Mejía, J. J., Butland, G., Yang, W., Pogoutse, O., Guo, X., Phanse, S., Wong, P., et al. (2009) · PLoS Biology · doi:10.1371/journal.pbio.1000096 · Cited by 387
Gerding, M. A., Ogata, Y., Pecora, N., Niki, H., & de Boer, P. D. (2007) · Molecular Microbiology · doi:10.1111/j.1365-2958.2006.05571.x · Cited by 380
Learning generative models for protein fold families
Balakrishnan, S., Kamisetty, H., Carbonell, J. G., Lee, S., & Langmead, C. J. (2011) · Proteins: Structure, Function, and Bioinformatics · doi:10.1002/prot.22934 · Cited by 316
The EVcouplings Python framework for coevolutionary sequence analysis
Hopf, T. A., Green, A. G., Schubert, B., Mersmann, S., Schärfe, C., Ingraham, J., Tóth-Petróczy, Á., Brock, K. P., Riesselman, A. J., Palmedo, P., et al. (2018) · Bioinformatics · doi:10.1093/bioinformatics/bty862 · Cited by 286
Self-citationSIFTS: Structure Integration with Function, Taxonomy and Sequences resource
Velankar, S. S., Dana, J. M., Jacobsen, J. O. B., van Ginkel, G., Gane, P. J., Luo, J., Oldfield, T. J., O’Donovan, C., Martin, M. J., & Kleywegt, G. J. (2012) · Nucleic Acids Research · doi:10.1093/nar/gks1258 · Cited by 277
Protein interaction networks revealed by proteome coevolution
Cong, Q., Anishchenko, I., Ovchinnikov, S., & Baker, D. (2019) · Science · doi:10.1126/science.aaw6718 · Cited by 241
The binary protein-protein interaction landscape of Escherichia coli
Rajagopala, S. V., Sikorski, P., Kumar, A., Mosca, R., Vlasblom, J., Arnold, R., Franca-Koh, J., Pakala, S. B., Phanse, S., Ceol, A., et al. (2014) · Nature Biotechnology · doi:10.1038/nbt.2831 · Cited by 233
Large-scale determination of previously unsolved protein structures using evolutionary information
Ovchinnikov, S., Kinch, L., Park, H., Liao, Y., Pei, J., Kim, D. E., Kamisetty, H., Grishin, N. V., & Baker, D. (2015) · eLife · doi:10.7554/elife.09248 · Cited by 222
Lloubès, R., Cascalès, E., Walburger, A., Bouveret, E., Lazdunski, C. J., Bernadac, A., & Journet, L. (2001) · Research in Microbiology · doi:10.1016/s0923-2508(01)01226-8 · Cited by 188
Gray, A. N., Egan, A. J. F., Veer, I. L. V., Verheul, J., Colavin, A., Koumoutsi, A., Biboy, J., Altelaar, M. A. F., Damen, M. J. A., Huang, K. C., et al. (2015) · eLife · doi:10.7554/elife.07118 · Cited by 183
Homma, M., DeRosier, D. J., & Macnab, R. M. (1990) · Journal of Molecular Biology · doi:10.1016/s0022-2836(05)80266-9 · Cited by 168
Inferring protein 3D structure from deep mutation scans
Rollins, N. J., Brock, K. P., Poelwijk, F. J., Stiffler, M. A., Gauthier, N. P., Sander, C., & Marks, D. S. (2019) · Nature Genetics · doi:10.1038/s41588-019-0432-9 · Cited by 166
Self-citation3D RNA and Functional Interactions from Evolutionary Couplings
Weinreb, C., Riesselman, A. J., Ingraham, J. B., Gross, T., Sander, C., & Marks, D. S. (2016) · Cell · doi:10.1016/j.cell.2016.03.030 · Cited by 159
Self-citationDetermining protein structures using deep mutagenesis
Schmiedel, J. M., & Lehner, B. (2019) · Nature Genetics · doi:10.1038/s41588-019-0431-x · Cited by 148
Inferring interaction partners from protein sequences
Bitbol, A., Dwyer, R. S., Colwell, L. J., & Wingreen, N. S. (2016) · Proceedings of the National Academy of Sciences · doi:10.1073/pnas.1606762113 · Cited by 137
ComplexContact: a web server for inter-protein contact prediction using deep learning
Zeng, H., Wang, S., Zhou, T., Zhao, F., Li, X., Wu, Q., & Xu, J. (2018) · Nucleic Acids Research · doi:10.1093/nar/gky420 · Cited by 137
Berman, H. M., Westbrook, J., Feng, Z., Gilliland, G. L., Bhat, T. N., Weissig, H., Shindyalov, I. N., & Bourne, P. E. (2006) · International Tables for Crystallography · doi:10.1107/97809553602060000722 · Cited by 135
Structure of the peptidoglycan polymerase RodA resolved by evolutionary coupling analysis
Sjodt, M., Brock, K. P., Dobihal, G. S., Rohs, P. D. A., Green, A. G., Hopf, T. A., Meeske, A. J., Srisuknimit, V., Kahne, D. E., Walker, S., et al. (2018) · Nature · doi:10.1038/nature25985 · Cited by 135
Self-citationGlobal landscape of cell envelope protein complexes in Escherichia coli
Babu, M., Bundalovic-Torma, C., Calmettes, C., Phanse, S., Zhang, Q., Jiang, Y., Minić, Z., Kim, S., Mehla, J., Gagarinova, A. G., et al. (2017) · Nature Biotechnology · doi:10.1038/nbt.4024 · Cited by 130
Walburger, A., Lazdunski, C. J., & Corda, Y. (2002) · Molecular Microbiology · doi:10.1046/j.1365-2958.2002.02895.x · Cited by 123
Expansion of Biological Pathways Based on Evolutionary Inference
Li, Y., Calvo, S. E., Gutman, R., Liu, J. S., & Mootha, V. K. (2014) · Cell · doi:10.1016/j.cell.2014.05.034 · Cited by 122
Gueudré, T., Baldassi, C., Zamparo, M., Weigt, M., & Pagnani, A. (2016) · Proceedings of the National Academy of Sciences · doi:10.1073/pnas.1607570113 · Cited by 116
Allosteric β‐propeller signalling in TolB and its manipulation by translocating colicins
Bonsor, D. A., Hecht, O., Vankemmelbeke, M. N., Sharma, A., Krachler, A. M., Housden, N. G., Lilly, K. J., James, R., Moore, G. R., & Kleanthous, C. (2009) · The EMBO Journal · doi:10.1038/emboj.2009.224 · Cited by 95
Predicting functional linkages from gene fusions with confidence.
Marcotte, C. V., & Marcotte, E. M. (2002) · PubMed · Cited by 66
Feinauer, C., Szurmant, H., Weigt, M., & Pagnani, A. (2016) · PLoS ONE · doi:10.1371/journal.pone.0149166 · Cited by 60
Díaz-Mejía, J. J., Babu, M., & Emili, A. (2008) · FEMS Microbiology Reviews · doi:10.1111/j.1574-6976.2008.00141.x · Cited by 54
Malinverni, D., López, A. J., Rios, P. D. L., Hummer, G., & Barducci, A. (2017) · eLife · doi:10.7554/elife.23471 · Cited by 54
Inferring interaction partners from protein sequences using mutual information
Bitbol, A. (2018) · PLoS Computational Biology · doi:10.1371/journal.pcbi.1006401 · Cited by 54
Rodriguez-Rivas, J., Marsili, S., Juan, D., & Valencia, A. (2016) · Proceedings of the National Academy of Sciences · doi:10.1073/pnas.1611861114 · Cited by 36
Scaffolding in the Spliceosome via Single α Helices
Ulrich, A. K. C., Seeger, M., Schütze, T., Bartlick, N., & Wahl, M. C. (2016) · Structure · doi:10.1016/j.str.2016.09.007 · Cited by 27
Structure of FlgK reveals the divergence of the bacterial Hook-Filament Junction of Campylobacter
Bulieris, P. V., Shaikh, N. H., Freddolino, P. L., & Samatey, F. A. (2017) · Scientific Reports · doi:10.1038/s41598-017-15837-0 · Cited by 21
Research works printed but not linked: 1
- Marcotte, C. & Marcotte, E. Predicting functional linkages from gene fusion. Appl. Bioinf. 1, 1–8 (2002).
Cited by
Sorted by citations
Protein complex prediction with AlphaFold-Multimer
Evans, R., O’Neill, M., Pritzel, A., Antropova, N., Senior, A., Green, T., Žídek, A., Bates, R., Blackwell, S., Yim, J., et al. (2021) · doi:10.1101/2021.10.04.463034 · Cited by 3,808
Improved prediction of protein-protein interactions using AlphaFold2
Bryant, P., Pozzati, G., & Elofsson, A. (2021) · doi:10.1101/2021.09.15.460468 · Cited by 1,022
AlphaFold2 and its applications in the fields of biology and medicine
Yang, Z., Zeng, X., Zhao, Y. C., & Chen, R. (2023) · Signal Transduction and Targeted Therapy · doi:10.1038/s41392-023-01381-z · Cited by 633
Computed structures of core eukaryotic protein complexes
Humphreys, I. R., Pei, J., Baek, M., Krishnakumar, A., Anishchenko, I., Ovchinnikov, S., Zhang, J., Ness, T. J., Banjade, S., Bagde, S. R., et al. (2021) · Science · doi:10.1126/science.abm4805 · Cited by 542
Protein design and variant prediction using autoregressive generative models
Shin, J.-E., Riesselman, A. J., Kollasch, A. W., McMahon, C., Simon, E., Sander, C., Manglik, A., Kruse, A. C., & Marks, D. S. (2021) · Nature Communications · doi:10.1038/s41467-021-22732-w · Cited by 320
Self-citation
Metadata
- Authors
- Green, A. G., Elhabashy, H., Brock, K. P., Maddamsetti, R., Kohlbacher, O., & Marks, D. S.
- Affiliations
- Harvard University (US)
- Max Planck Institute for Developmental Biology (DE)
- Universitätsklinikum Tübingen (DE)
- Broad Institute (US)
- Corresponding author
- Kohlbacher, Oliver
- Marks, Debora S.
- ORCID
- Venue
- Nature Communications
- Published
- 2021-03-02
- Volume
- 12
- Issue
- 1
- Pages
- 1396-1396
- ISSN
- 2041-1723 (ISSN-L)
- PMC
- PMC7925567
- OpenAlex
- W3133793061
- Cited by
- 114
- References
- 57
- Citations by year
- 2026: 14 · 2025: 17 · 2024: 24 · 2023: 25 · 2022: 21 · 2021: 13
- FWCI
- 6.51
- Type
- journal article
- Language
- en
- Open access
- gold
- doi.org
- Locations
- Nature Communications (publishedVersion, cc-by)
- PubMed Central (publishedVersion, cc-by)
- PubMed (publishedVersion)
- RePEc: Research Papers in Economics (submittedVersion)
- DOAJ (DOAJ: Directory of Open Access Journals) (submittedVersion, cc-by-sa)
- Funders
- National Science Foundation (DGE1144152)
- U.S. Department of Health & Human Services | National Institutes of Health (T15LM007092)
- Topics
- Life Sciences › Biochemistry, Genetics and Molecular Biology › Molecular Biology › Protein Structure and Dynamics
- Life Sciences › Biochemistry, Genetics and Molecular Biology › Molecular Biology › Machine Learning in Bioinformatics
- Life Sciences › Biochemistry, Genetics and Molecular Biology › Molecular Biology › Genomics and Phylogenetic Studies
- Keywords
- protein-protein interaction, membrane protein complexes
- MeSH terms
- Amino Acids, Bacterial Proteins, Base Sequence, Escherichia coli, Eukaryotic Cells, Membrane Proteins, Protein Binding, Genome, Bacterial, Evolution, Molecular, Proteome, Protein Interaction Mapping, Molecular Docking Simulation
About these checks
Registry, retraction, Cites and statistics results are computed, not judged, with one exception: a printed reference that no index lists is read once by a model before it counts as a citation error. Claims are extracted by a model and kept only when their quote appears verbatim in the text; each cited source is then checked, with a model’s help, for whether it says what the claim relies on. Those verdicts can be wrong — read the claim’s quote and the cited source before relying on one.
Statistics and arithmetic are recomputed, not judged.
Confidence bands are shown only for fields calibrated on our annotated test set. None is calibrated yet, so no band is shown.
What counts as a claim ›How we measure confidence ›How we check this ›
Are you an author, or do you see a problem with this page? Request a review
