

The DOI matches its Crossref record; 91 of the 91 references it cites were found in a registry or an index.
Microfluidic device with brain extracellular matrix promotes structural and functional maturation of human brain organoids
Open accessAbstract
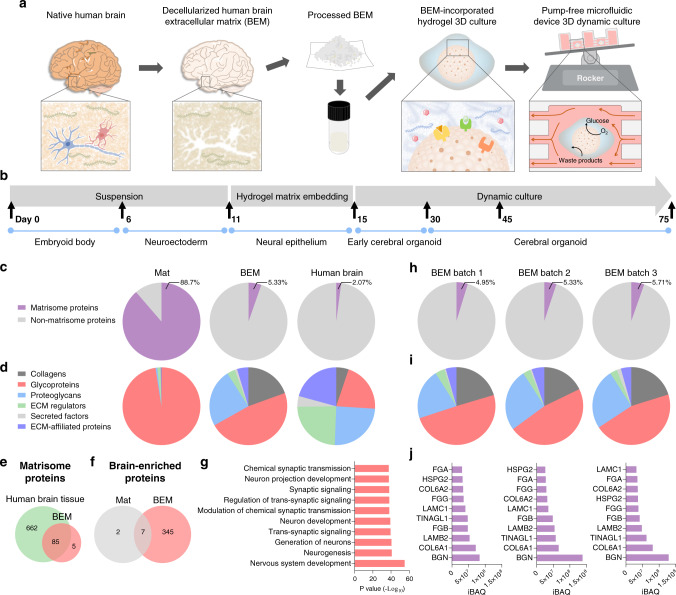
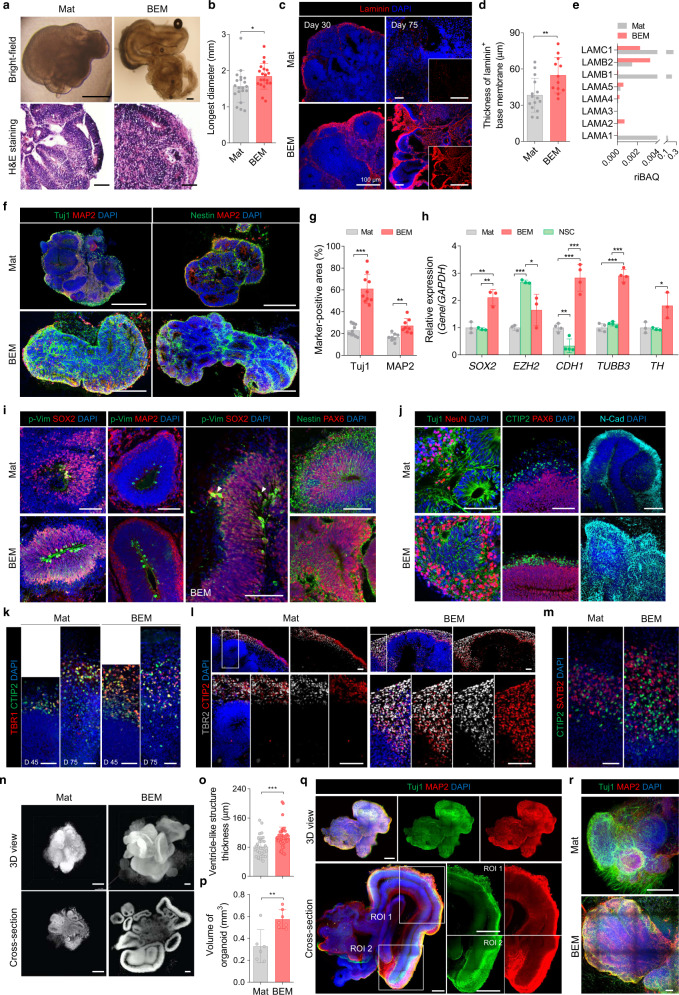
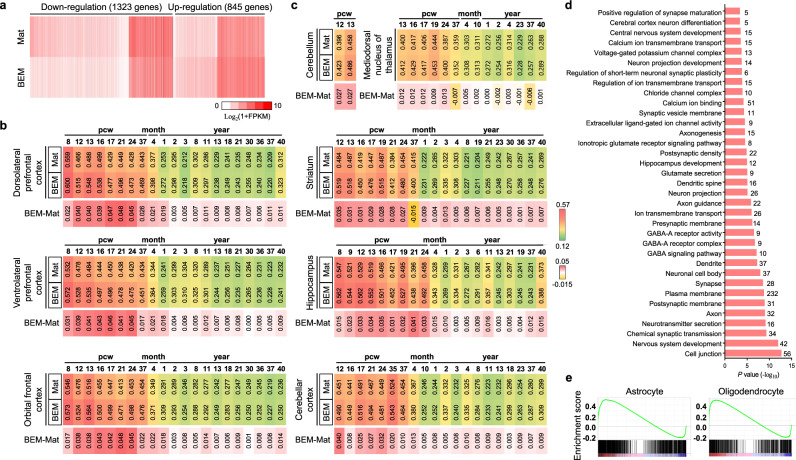
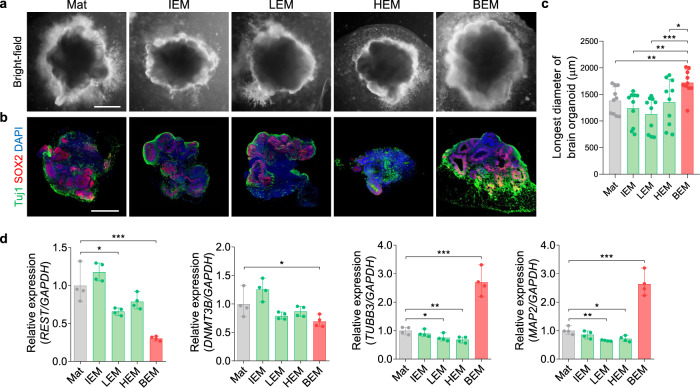
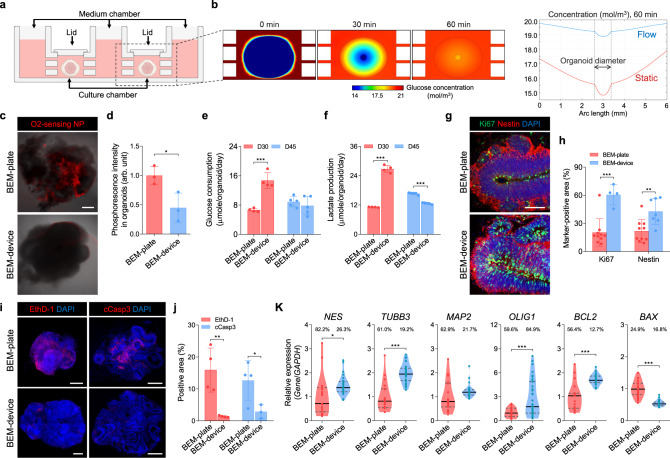
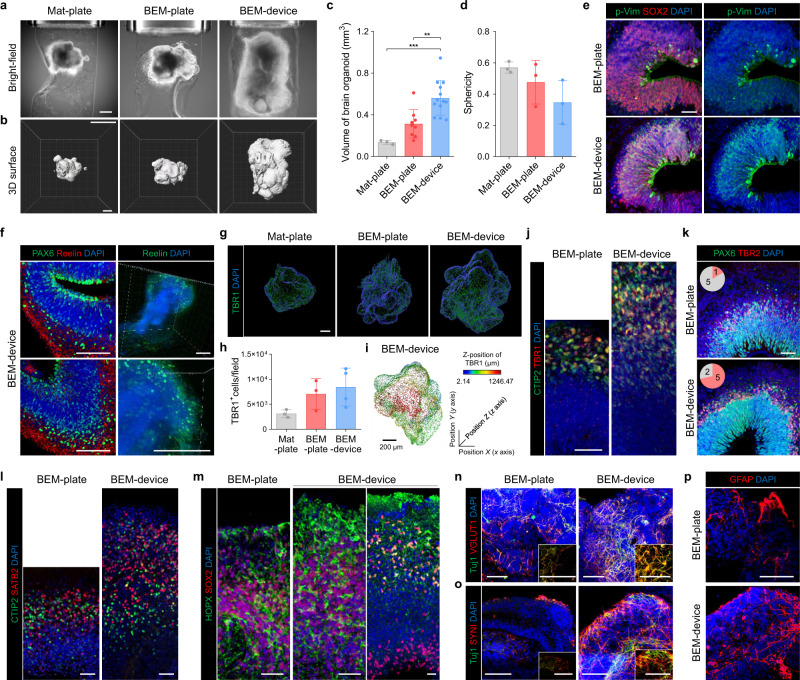
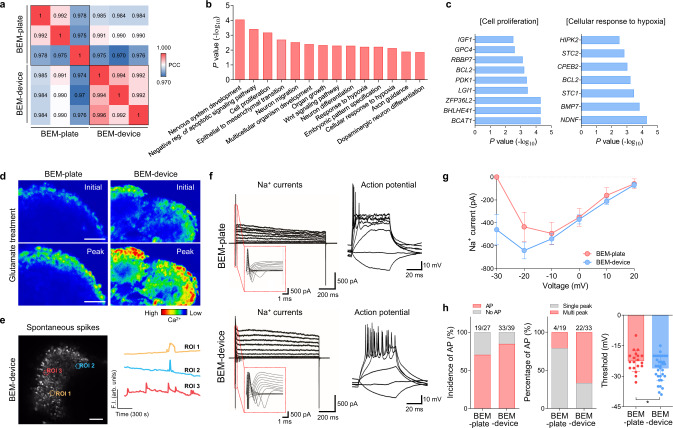
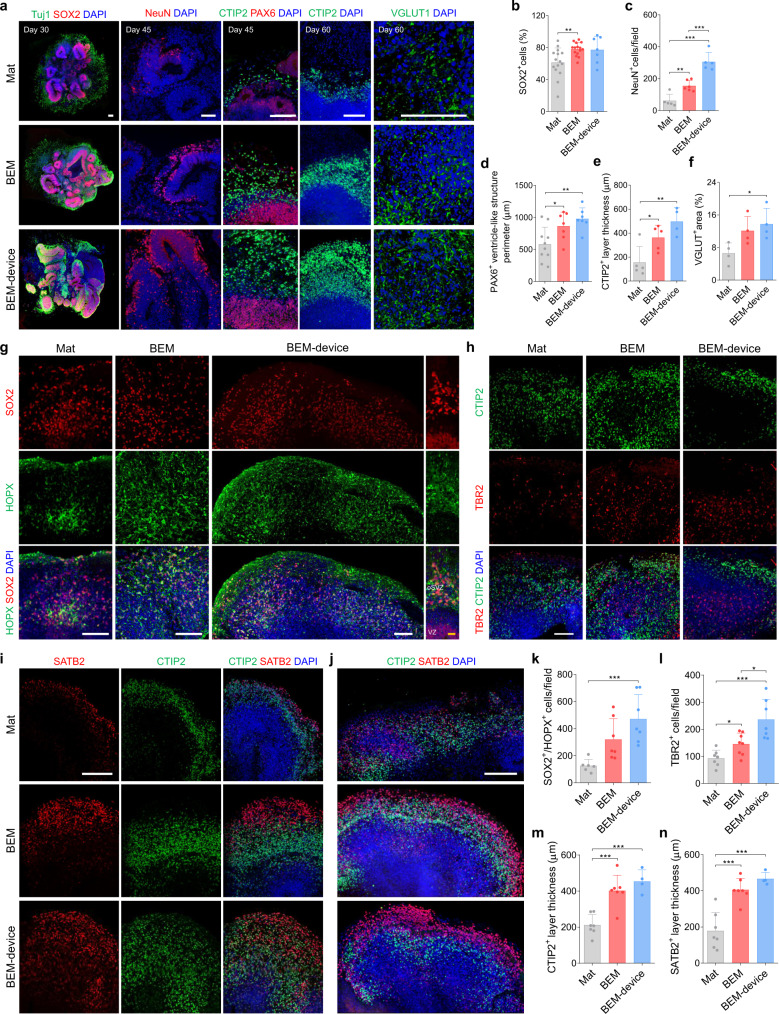
Brain organoids derived from human pluripotent stem cells provide a highly valuable in vitro model to recapitulate human brain development and neurological diseases. However, the current systems for brain organoid culture require further improvement for the reliable production of high-quality organoids. Here, we demonstrate two engineering elements to improve human brain organoid culture, (1) a human brain extracellular matrix to provide brain-specific cues and (2) a microfluidic device with periodic flow to improve the survival and reduce the variability of organoids. A three-dimensional culture modified with brain extracellular matrix significantly enhanced neurogenesis in developing brain organoids from human induced pluripotent stem cells. Cortical layer development, volumetric augmentation, and electrophysiological function of human brain organoids were further improved in a reproducible manner by dynamic culture in microfluidic chamber devices. Our engineering concept of reconstituting brain-mimetic microenvironments facilitates the development of a reliable culture platform for brain organoids, enabling effective modeling and drug development for human brain diseases.
Overview
The claims and statistics of this paper haven’t been checked yet.
Run the check — free, no account needed. It reads the open-access text and checks the sources it cites.
Integrity signals
Registry
Cites
Statistics
Figures
Verification
Claims the paper makes
The claims and statistics of this paper haven’t been checked yet.
Run the check — free, no account needed. It reads the open-access text and checks the sources it cites.
Claims other papers make about this one
Each is checked against this paper’s own text: does it say what the citing paper says it does?
The source backs part of the claim, not all of it — or backs it for a different population, condition or comparison.
In the citing paper
“While many other organoid models, including brain[13], intestinal [14], mammary gland [15], and retinal organoids [16], employ 3D ECM-based hydrogels to induce complex tissue architecture that cannot be achieved in ECM-free floating culture, the same has not been explored for skin yet.”
From Efficient Generation of Skin Organoids from Pluripotent Cells via Defined Extracellular Matrix Cues and Morphogen Gradients in a Spindle‐Shaped Microfluidic Device (2024) · cites this paper as [13]
Experimental — accuracy not yet measured
Self-check
Percentages, sums and reported differences re-computed from the paper’s own numbers.
The self-check needs the paper’s full text.
Citations
Cites
Gene Ontology: tool for the unification of biology
Ashburner, M., Ball, C. A., Blake, J. A., Botstein, D., Butler, H., Cherry, J. M., Davis, A. P., Dolinski, K., Dwight, S. S., Eppig, J. T., et al. (2000) · Nature Genetics · doi:10.1038/75556 · Cited by 43,206
Tissue-based map of the human proteome
Uhlén, M., Fagerberg, L., Hallström, B. M., Lindskog, C., Oksvold, P., Mardinoglu, A., Sivertsson, Å., Kampf, C., Sjöstedt, E., Asplund, A., et al. (2015) · Science · doi:10.1126/science.1260419 · Cited by 15,286
The Molecular Signatures Database Hallmark Gene Set Collection
Liberzon, A., Birger, C., Thorvaldsdóttir, H., Ghandi, M., Mesirov, J. P., & Tamayo, P. (2015) · Cell Systems · doi:10.1016/j.cels.2015.12.004 · Cited by 13,807
Shrestha, S., & Offer, S. M. (2016) · Medical Epigenetics · doi:10.1159/000444713 · Cited by 8,951
Pérez-Riverol, Y., Csordas, A., Bai, J.-W., Bernal-Llinares, M., Hewapathirana, S., Kundu, D. J., Inuganti, A., Griss, J., Mayer, G., Eisenacher, M., et al. (2018) · Nucleic Acids Res. · doi:10.1093/nar/gky1106 · Cited by 6,216
Cerebral organoids model human brain development and microcephaly
Lancaster, M. A., Renner, M., Martin, C.-A., Wenzel, D., Bicknell, L. S., Hurles, M. E., Homfray, T., Penninger, J. M., Jackson, A. P., & Knoblich, J. A. (2013) · Nature · doi:10.1038/nature12517 · Cited by 5,372
The Gene Ontology resource: enriching a GOld mine
The Gene Ontology Consortium, Carbon, S., Douglass, E., Good, B. M., Unni, D. R., Harris, N. L., Mungall, C. J., Basu, S., Chisholm, R. L., Dodson, R. J., et al. (2021) · Nucleic Acids Research · doi:10.1093/nar/gkaa1113 · Cited by 3,555
Organoid Models and Applications in Biomedical Research
Xinaris, C., Brizi, V., & Remuzzi, G. (2015) · The Nephron journals/Nephron journals · doi:10.1159/000433566 · Cited by 3,519
Mi, H., Muruganujan, A., Ebert, D., Huang, X., & Thomas, P. D. (2018) · Nucleic Acids Research · doi:10.1093/nar/gky1038 · Cited by 3,030
A draft map of the human proteome
Kim, M.-S., Pinto, S. M., Getnet, D., Nirujogi, R. S., Manda, S. S., Chaerkady, R., Madugundu, A. K., Kelkar, D. S., Isserlin, R., Jain, S., et al. (2014) · Nature · doi:10.1038/nature13302 · Cited by 2,198
Cited by
Sorted by citations
Items 201–300 of 397
Recent Insights into Organoid-Derived Extracellular Vesicles and Their Biomedical Applications
Dayem, A. A., Kwak, Y., Jeun, H., & Cho, S. (2025) · Journal of Personalized Medicine · doi:10.3390/jpm15100492 · Cited by 12
Self-citationHydrogel Stamping for Rapid, Multiplexed, Point-of-Care Immunostaining of Cells and Tissues
Chin, L. K., Li, H., Choi, J.-H., Iwamoto, Y., Oh, J., Min, J., Beak, S. K., Yoo, D., Castro, C. M., Lee, D., et al. (2022) · ACS Applied Materials & Interfaces · doi:10.1021/acsami.2c05071 · Cited by 9
Functional bioengineered tissue models of neurodegenerative diseases
Mullis, A. S., & Kaplan, D. L. (2023) · Biomaterials · doi:10.1016/j.biomaterials.2023.122143 · Cited by 10
Myelin organoids for the study of Alzheimer's disease
Cerneckis, J., & Shi, Y. (2023) · Frontiers in Neuroscience · doi:10.3389/fnins.2023.1283742 · Cited by 9
Three-Dimensional Culture Systems for Dissecting Notch Signalling in Health and Disease
Marconi, G. D., Porcheri, C., Trubiani, O., & Mitsiadis, T. A. (2021) · International Journal of Molecular Sciences · doi:10.3390/ijms222212473 · Cited by 10
Jun, Y., Nguyen-Ngoc, K.-V., Sai, S., Bender, R., Gong, W., Kravets, V., Zhu, H., Hatch, C. J., Schlichting, M., Gaetani, R., et al. (2022) · bioRxiv · doi:10.1101/2022.10.28.513298 · Cited by 42
The Relevance of Astrocytic Cell Culture Models for Neuroinflammation in Neurodegeneration Research
Preato, A. M., Pinheiro, E. D. S., Rosenstock, T. R., & Glezer, I. (2024) · Neuroglia · doi:10.3390/neuroglia5010003 · Cited by 8
Hong, S.-J., Lee, J. H., Kim, Y., Kim, E. H., & Shin, K. (2024) · Bioengineering & Translational Medicine · doi:10.1002/btm2.10690 · Cited by 8
Self-citationSaglam‐Metiner, P., Yanasik, S., Odabasi, Y. C., Modamio, J., Negwer, M., Avcı, Ç. B., Güler, A., Ertürk, A., Yıldırım, E., & Yeşil-Çeliktaş, Ö. (2024) · Communications Biology · doi:10.1038/s42003-024-07313-z · Cited by 13
Biomaterials meet organ-on-chips – a perspective on tumor modeling
Monteiro, C. F., Deus, I. A., Custódio, C. A., & Mano, J. F. (2024) · International Materials Reviews · doi:10.1177/09506608241303436 · Cited by 9
Pai, V., Singh, B. N., & Singh, A. K. (2025) · Ageing Research Reviews · doi:10.1016/j.arr.2025.102753 · Cited by 8
Mishra, S., Mondal, G., & Kumarasamy, M. (2025) · Organoids · doi:10.3390/organoids4020013 · Cited by 9
Jang, M., Lee, H., Seo, E. U., & Kim, H. N. (2025) · Biomaterials · doi:10.1016/j.biomaterials.2025.123504 · Cited by 8
Human dorsal forebrain organoids show differentiation-state-specific protein secretion
Yentür, Z., Kagermeier, T., Sarieva, K., Jarboui, M. A., Becker, K., & Mayer, S. (2025) · iScience · doi:10.1016/j.isci.2025.112935 · Cited by 8
3D Bioprinting for Personalized Medicine: Advances, Challenges, and Future Directions
Gao, X., Chen, J., Zhang, X., & Xu, T. (2025) · ACS Biomaterials Science & Engineering · doi:10.1021/acsbiomaterials.5c00740 · Cited by 8
Tomatis, F., Angiolillo, S., Maniou, E., Gagliano, O., & Elvassore, N. (2025) · Current Opinion in Biomedical Engineering · doi:10.1016/j.cobme.2025.100630 · Cited by 9
Microbiota‐gut‐brain axis multi‐organ chip construction and applications in drug evaluation
Tang, Y., Chen, H., Zhao, Z., Kang, X., Wang, W., Dai, K., Guo, Y., Liang, A., Luo, A., & Hao, Z. (2025) · iMetaOmics. · doi:10.1002/imo2.70065 · Cited by 9
Stem cells in organogenesis and regeneration
Mim, T. J., Ahmad, I., Basher, S. R., Rahman, M. F., Ambati, S. R., Venkatagiri, K., Seher, N., Kumar, D., Choudhary, N., & Kondaveeti, S. B. (2026) · Stem Cell Research & Therapy · doi:10.1186/s13287-025-04889-z · Cited by 9
Engineering pluripotent stem cells with synthetic biology for regenerative medicine
Mao, Y., Wang, S., Yu, J., & Li, W. (2024) · Medical Review · doi:10.1515/mr-2023-0050 · Cited by 8
Modeling tuberous sclerosis complex with human induced pluripotent stem cells
Niu, W., Siciliano, B., & Wen, Z. (2022) · World Journal of Pediatrics · doi:10.1007/s12519-022-00576-8 · Cited by 8
Noorani, B., Cucullo, L., Ahn, Y., Kadry, H., Bhalerao, A., Raut, S., Nozohouri, E., & Chowdhury, E. A. (2022) · Current Neuropharmacology · doi:10.2174/1570159x20666220706112711 · Cited by 9
Human induced pluripotent stem cell-derived kidney organoids toward clinical implementations
Garreta, E., Nauryzgaliyeva, Z., & Montserrat, N. (2021) · Current Opinion in Biomedical Engineering · doi:10.1016/j.cobme.2021.100346 · Cited by 8
Samancioglu, A., Aydin, B., Özüdoğru, E., & Arslan, Y. E. (2023) · Materials Research Express · doi:10.1088/2053-1591/acf277 · Cited by 7
Han, S., Kim, J., Kim, S. H., Youn, W., Kim, J., Ji, G. Y., Yang, S., Park, J., Lee, G. M., Kim, Y., et al. (2023) · Acta Biomaterialia · doi:10.1016/j.actbio.2023.09.046 · Cited by 7
Self-citationHuman Brain In Vitro Model for Pathogen Infection-Related Neurodegeneration Study
Yan, Y., & Cho, A. (2024) · International Journal of Molecular Sciences · doi:10.3390/ijms25126522 · Cited by 7
Self-citationHuman-Organoid-Based In Vitro Modeling for Environmental Toxicology
Kwak, E., & Peng, G. (2024) · Environmental Science & Technology Letters · doi:10.1021/acs.estlett.4c00154 · Cited by 7
Thio, S. K., & Park, S.-Y. (2022) · Micromachines · doi:10.3390/mi13010112 · Cited by 7
Superoxide dismutase isozymes in cerebral organoids from autism spectrum disorder patients
Ejlersen, M., Ilieva, M. S., & Michel, T. M. (2022) · Journal of Neural Transmission · doi:10.1007/s00702-022-02472-x · Cited by 7
Wu, H., Hamilton, C., Porritt, H., Winbo, A., & Zeltner, N. (2024) · The Journal of Physiology · doi:10.1113/jp286416 · Cited by 7
Bar-Kochba, E., Carneal, C. M., Alphonse, V. D., Timm, A. C., Ernlund, A. W., Rodriguez, C. L., Pantoja, I. E. M., Smirnova, L., Härtung, T., & Merkle, A. C. (2025) · Frontiers in Bioengineering and Biotechnology · doi:10.3389/fbioe.2025.1553609 · Cited by 6
Fang, C., Wang, Q., Xiao, Q., Cai, X.-X., Du, R., Xue, L., Tian, X., & Xiong, L. (2025) · Neural Regeneration Research · doi:10.4103/nrr.nrr-d-24-01490 · Cited by 7
Tumor organoids on-a-chip and the role of AI in predictive oncology and personalized cancer medicine
Mirlohi, M. S., Hamdi, E., Karimi, M. H., Salami, S., Aref, A. R., Kohan, H. G., Ghayoor, A., Seyfoori, A., & Akbari, M. (2026) · Biofabrication · doi:10.1088/1758-5090/ae3644 · Cited by 6
The extracellular matrix as a dynamic regulator of brain function and plasticity
Ge, C., & Tajerian, M. (2026) · Neurobiology of Disease · doi:10.1016/j.nbd.2026.107374 · Cited by 8
Mazzini, L., Marchi, F. D., Bużańska, L., Follenzi, A., Glover, J. C., Gelati, M., Lombardi, I., Maioli, M., Mesa-Herrera, F., Mitrečić, D., et al. (2024) · Expert Opinion on Biological Therapy · doi:10.1080/14712598.2024.2392307 · Cited by 6
Using 2D and 3D pluripotent stem cell models to study neurotropic viruses
LaNoce, E., Dumeng-Rodriguez, J., & Christian, K. M. (2022) · Frontiers in Virology · doi:10.3389/fviro.2022.869657 · Cited by 7
Kakehbaraei, S., Arab‐Zozani, M., & Kakebaraei, S. (2024) · International Journal of Polymeric Materials · doi:10.1080/00914037.2024.2360956 · Cited by 6
Regenerative human liver organoids (HLOs) in a pillar/perfusion plate for hepatotoxicity assaysPreprint
Shrestha, S., Acharya, P., Kang, S. Y., Vanga, M. G., Lekkala, V. K. R., Liu, J., Yang, Y. S., Joshi, P., & Lee, M. (2024) · bioRxiv (Cold Spring Harbor Laboratory) · doi:10.1101/2024.03.25.586638 · Cited by 5
Fausto, C. C., Glykofrydis, F., Kumar, N., Schnell, J., Csipán, R. L., Kuyper, F. D., Grubbs, B. H., Thornton, M. E., Achieng, M. A., Morsut, L., et al. (2024) · bioRxiv (Cold Spring Harbor Laboratory) · doi:10.1101/2024.11.30.626171 · Cited by 6
Bonneuil, W. V., Katiyar, N., Tenje, M., & Bagheri, S. (2025) · Journal of The Royal Society Interface · doi:10.1098/rsif.2024.0463 · Cited by 5
Dynamic culture system advances the applications of breast cancer organoids for precision medicine
Yang, J. J., Qu, J., Zhang, M., Li, X., Jiang, Q., Kang, J., Nie, P., Jing, N., & Wang, X. (2025) · Scientific Reports · doi:10.1038/s41598-025-86730-4 · Cited by 5
Beyond Structure: Next-Generation Electrophysiological Platforms for Functional Brain Organoids
Cha, J.-H., Kim, K., & Cho, I. (2025) · International Journal of Stem Cells · doi:10.15283/ijsc25056 · Cited by 6
Recent advances in applications of nanoparticles and decellularized ECM for organoid engineering
Lee, S.-J., Cho, J., Heo, T.-H., Yang, D. H., Chun, H. J., Yoon, J., & Jeong, G. (2025) · Materials Today Bio · doi:10.1016/j.mtbio.2025.102274 · Cited by 6
Facing the possibility of consciousness in human brain organoids
Wood, C., Wang, H., Yang, W., & Xi, Y. (2025) · Patterns · doi:10.1016/j.patter.2025.101365 · Cited by 7
Silvani, G., Stenzel, M. H., & Kilian, K. A. (2025) · ACS Nano Medicine · doi:10.1021/acsnanomed.5c00019 · Cited by 6
Jin, Y., Park, S., & Cho, S. (2026) · Nature Reviews Bioengineering · doi:10.1038/s44222-025-00384-5 · Cited by 7
Self-citationBrain Extracellular Matrix-Based Electronic Brain Biochip
Liu, X., Dong, R., Hang, C., Lim, C. T., & Jiang, X. (2026) · ACS Nano · doi:10.1021/acsnano.5c21848 · Cited by 5
Phenotypic and transcriptional characterization of oligodendrocyte precursor cells in a 3D culture
Nakano, S., Uyeda, A., Matsunaga, Y. T., & Muramatsu, R. (2023) · Biomaterials Science · doi:10.1039/d2bm01897g · Cited by 5
Human Chorionic Membrane‐derived Tunable Hydrogels for Vascular Tissue Engineering Strategies
Martins, E. A. G., Deus, I. A., Gomes, M. C., Silva, A. S., Mano, J. F., & Custódio, C. A. (2024) · Advanced Healthcare Materials · doi:10.1002/adhm.202401510 · Cited by 5
Saridis, M. R., Salmina, A. B., Korsakova, S. A., & Yurchenko, S. O. (2025) · Biotechnology Journal · doi:10.1002/biot.70065 · Cited by 6
Asteroid impact: the potential of astrocytes to modulate human neural networks within organoids
Lavekar, S. S., Patel, M. D., Parra, M. D. M., & Krencik, R. (2023) · Frontiers in Neuroscience · doi:10.3389/fnins.2023.1305921 · Cited by 5
Yoon, H., Kang, J. H., Cho, S. W., Park, C. G., Kim, D., & Park, T. (2024) · Advanced Healthcare Materials · doi:10.1002/adhm.202304371 · Cited by 5
Self-citationBarry, A., Samuel, S. F., Hosni, I., Moursi, A., Feugere, L., Sennett, C., Deepak, S., Achawal, S., Rajaraman, C., Iles, A., et al. (2023) · Lab on a Chip · doi:10.1039/d3lc00204g · Cited by 7
Salmina, A. B., Saridis, M. R., Ryzhkov, V. V., Korsakova, S. A., Сергеевич, А. А., Bystrov, D. A., Barbasheva, A. A., Libet, P. A., Kuguk, A. K., Polynkin, L. Y., et al. (2025) · Biotechnology Journal · doi:10.1002/biot.70126 · Cited by 6
Kim, M., Choi, H., Yang, W. S., & Koh, H. J. (2026) · Gels · doi:10.3390/gels12040287 · Cited by 4
Sissoko, C. A., Spitz, S., Zhang, Z., Abedi, K., Kamm, R. D., & Barrile, R. (2026) · Advanced Drug Delivery Reviews · doi:10.1016/j.addr.2026.115881 · Cited by 6
Patterning human kidney organoids with synthetic Wnt-secreting organizers
Fausto, C. C., Glykofrydis, F., Kumar, N., Schnell, J., Csipán, R. L., Kuyper, F. D., Kunnan, M., Grubbs, B. H., Thornton, M. E., Thompson, M., et al. (2026) · Science · doi:10.1126/science.adu9122 · Cited by 4
Advancements in brain organoid models for neurodegenerative disease research
Park, S., & Park, J. (2024) · Organoid · doi:10.51335/organoid.2024.4.e12 · Cited by 4
Microfluidic manipulation of the multicellular spheroids and organoids for modeling human diseases
Zhao, L., Xiong, S., Wang, D., & Wang, X. (2025) · Microchemical Journal · doi:10.1016/j.microc.2025.113718 · Cited by 4
Coronel, R., González-Sastre, R., Mateos-Martínez, P., Maeso, L., Llorente-Beneyto, E., Martín-Benito, S., Gagosian, V. S. C., Foti, L., González, M. D. C., López-Alonso, V., et al. (2025) · Neural Regeneration Research · doi:10.4103/nrr.nrr-d-24-01639 · Cited by 5
Cells in the 3D biomatrix on-chip: better mimicking the real micro-physiological system
D’Orazio, M., Filippi, J., Antonelli, G., Curci, G., Casti, P., Mencattini, A., Cidonio, G., & Martinelli, E. (2024) · Next Materials · doi:10.1016/j.nxmate.2024.100229 · Cited by 4
Li, W., Shen, Q., Tong, T., Tian, H., Lian, X., Wang, H., Yang, K., Dai, Z., Li, Y., Chen, X., et al. (2025) · Bioactive Materials · doi:10.1016/j.bioactmat.2025.04.018 · Cited by 4
Accelerated neuronal aging in vitro ∼melting watch ∼
Inagaki, E., Yoshimatsu, S., & Okano, H. (2022) · Frontiers in Aging Neuroscience · doi:10.3389/fnagi.2022.868770 · Cited by 4
Effects of matrigel on growth and development of cerebral organoids
Chang, N. L., He, J., Guo, Y., Huang, Y., & Zhao, X. (2022) · Materials Express · doi:10.1166/mex.2022.2190 · Cited by 4
Li, X., Liu, H., Han, C., Luo, J., Guan, X., Wang, L., Li, Y., Wang, J., Piao, H. Z., Zou, W., et al. (2023) · International Journal of Molecular Sciences · doi:10.3390/ijms241814208 · Cited by 5
Wang, J., Yang, X., Xu, M., Liu, H., Liu, L., & Tan, Z. (2024) · Materials Today Bio · doi:10.1016/j.mtbio.2024.101033 · Cited by 4
Logun, M. T., Begley, S. L., Hicks, K., Park, J., Zhang, L., Binder, Z. A., & O’Rourke, D. M. (2025) · bioRxiv (Cold Spring Harbor Laboratory) · doi:10.1101/2025.02.11.637648 · Cited by 4
Application of brain organoids in neurodevelopmental disorders
Zhao, C., Qi, Y., Xia, L., Zhu, T., & Xia, K. (2025) · Biochemical and Biophysical Research Communications · doi:10.1016/j.bbrc.2025.152405 · Cited by 3
Habib, A., Mateos, P. C., Dubey, V. K., Ahmad, A., Acharya, G., Ahluwalia, B. S., Varshney, M., & Melandsø, F. (2025) · Materials Today Advances · doi:10.1016/j.mtadv.2025.100651 · Cited by 3
Pluripotent stem cells-based neural organoids for modelling human brain development and diseases
Tong, L., Tian, P., Wang, R., Niu, S., Wang, R., Ye, Y., Wu, Y., Zhang, W., Wang, Y., Foggetti, A., et al. (2025) · Cell & Bioscience · doi:10.1186/s13578-025-01515-6 · Cited by 3
Esophagus extracellular matrix with microenvironmental complexity for esophageal organoids
Park, S., Jeon, E. J., Koh, W., & Cho, S. (2026) · Bioactive Materials · doi:10.1016/j.bioactmat.2025.12.046 · Cited by 3
Self-citationDecellularized Extracellular Matrix for Organoids Development and 3D Bioprinting
Gkantzou, E., Alexandro, R.-R., Chmielewska, A., Pratscher, B., Surina, S., Freund, P., & Burgener, I. A. (2026) · Organoids · doi:10.3390/organoids5010002 · Cited by 3
Liu, J., Li, Q., Zhu, H., Li, A., Geng, B., Li, Z. A., & Tian, T. (2026) · Advanced Healthcare Materials · doi:10.1002/adhm.202503966 · Cited by 3
A modular platform for automated organoid culture and longitudinal imaging
Torres, S., Hernandez, S., Seiler, S. T., Schweiger, H., Vera-Choqqueccota, S., Kaurala, G. A., Sharf, T., Haussler, D. H., Mostajo-Radji, M. A., & Teodorescu, M. (2026) · Scientific Reports · doi:10.1038/s41598-026-40231-0 · Cited by 6
Kim, H., Vasquez, F. J. A., Bello, A. B., & Lee, S.-H. (2026) · Tissue and Cell · doi:10.1016/j.tice.2026.103401 · Cited by 3
Erol, A. Y. G. (2024) · International Journal of Developmental Neuroscience · doi:10.1002/jdn.10383 · Cited by 3
The Application and Challenges of Brain Organoids in Exploring the Mechanism of Arbovirus Infection
Cui, B., Wang, Z., Farid, A., Wang, Z., Wei, K., Ren, N., Yang, F., & Liu, H. D. (2025) · Microorganisms · doi:10.3390/microorganisms13061281 · Cited by 4
Brain organoids and genome editing: A new era in understanding human brain development and disorders
Zhou, M., Cao, Y., Yue, K., Wu, W., Xie, Y., Hu, D., Zhao, J., Xu, F., Guo, J., Li, Z., et al. (2025) · Neural Regeneration Research · doi:10.4103/nrr.nrr-d-24-01546 · Cited by 3
da Rosa, I. F., de Souza, B. M., Doretto, L. B., Rodrigues, M. D. S., Barquilha, C. N., Fioretto, M. N., Portela, L. M. F., Vieira, J. C. S., Justulin, L. A., Padilha, P. D. M., et al. (2025) · Frontiers in Bioengineering and Biotechnology · doi:10.3389/fbioe.2025.1631542 · Cited by 3
Tumor organoid and tumor-on-a-chip equipped next generation precision medicine
Zhao, W., Zhang, Z., Xu, S., Sun, X., Wang, Y., Ye, J., Wang, X., Gu, Z., & Chen, Z. (2025) · Biofabrication · doi:10.1088/1758-5090/ae0bb3 · Cited by 4
Progress of 3D Organoid Technology for Preclinical Investigations: Towards Human In Vitro Models
Liu, Y., Xu, H., Abraham, S., Wang, X., & Keavney, B. D. (2022) · International Journal of Drug Discovery and Pharmacology · doi:10.53941/ijddp.v1i1.188 · Cited by 4
Targeting and eradicating latent CNS reservoirs of HIV-1: Original strategies and new models
Saeb, S., Wallet, C., Rohr, O., Schwartz, C., & Loustau, T. (2023) · Biochemical Pharmacology · doi:10.1016/j.bcp.2023.115679 · Cited by 6
Ghuloum, F. I., Stevens, L. A., Johnson, C. A., Galdo, N. A. R., & Amer, M. H. (2023) · Biomaterials Advances · doi:10.1016/j.bioadv.2023.213652 · Cited by 5
Li, K., Gu, L., Cai, H., Lu, H., Mackie, K., & Guo, F. (2024) · Drug Metabolism and Pharmacokinetics · doi:10.1016/j.dmpk.2024.101031 · Cited by 3
In Vitro Cell Line Culture for Brain Research and Its Limitations
Dabhekar, S. V., Dhokne, M. D., Dalal, V., Lokhande, S., Taksande, B. G., Nakhate, K. T., Umekar, M. J., & Mangrulkar, S. V. (2024) · Springer eBooks · doi:10.1007/978-981-97-2859-6_11 · Cited by 3
Spatiotemporally-patterned biomaterials for organoid culture
Arrieta-Viana, L. F., & Garcı́a, A. J. (2025) · Current Opinion in Biomedical Engineering · doi:10.1016/j.cobme.2025.100594 · Cited by 3
Bueno, R. J., Fernández‐Zapata, C., Salla, M., Garcia, J. C., Alacam, A., Klein, O., Böttcher, C., Radbruch, H., Paul, F., Starossom, S. C., et al. (2025) · Frontiers in Bioengineering and Biotechnology · doi:10.3389/fbioe.2025.1578467 · Cited by 2
Wheelock, J. M., Pritchard, R., Kumar, S., & Lu, H. (2025) · Biophysical Journal · doi:10.1016/j.bpj.2025.09.015 · Cited by 2
Established and emerging new approach methodologies in neuroscience
Imberechts, D., Ny, A., & Copmans, D. (2025) · Frontiers in Neuroscience · doi:10.3389/fnins.2025.1696937 · Cited by 4
Maskell, K. G., Cook, A. L., King, A. E., Dickson, T. C., & Blizzard, C. L. (2026) · Lab on a Chip · doi:10.1039/d5lc00577a · Cited by 2
Patel, G., & Amin, H. (2026) · Stem Cell Reviews and Reports · doi:10.1007/s12015-026-11096-7 · Cited by 2
Wei, R., Mei, Q., Zhou, T., Zhang, X., Liu, W., Yu, M., Wang, B., Xie, H.-Q., & Yao, R. (2026) · Bioactive Materials · doi:10.1016/j.bioactmat.2026.04.006 · Cited by 2
Droplet-based microfluidics in pharmaceutical research and development: Current status and advances
Wang, X. E., Zhang, Y., Chen, S., & Meng, X. (2026) · Journal of Pharmaceutical Analysis · doi:10.1016/j.jpha.2026.101637 · Cited by 2
Functional vasculature in tumor organoids: Enabling precision medicine in oncology
Wu, W., Yao, G., Liu, Y., Zhang, L., Li, Z., Feng, X., Tao, S., Song, J., Kong, T., & Zhou, Z. (2026) · Biochimica et Biophysica Acta (BBA) - Reviews on Cancer · doi:10.1016/j.bbcan.2026.189597 · Cited by 2
Kim, J., Zhang, S., Jung, J.-H., Lee, M.-J., Han, I., & Cho, S. (2026) · Materials Today Bio · doi:10.1016/j.mtbio.2026.103168 · Cited by 4
Self-citationUsing iPSC models to examine neuron–glia interactions in neurodegenerative diseases
Lopez, D. M., Keavey, L., & Bowles, K. R. (2026) · Bioscience Reports · doi:10.1042/bsr20250131 · Cited by 2
In vitro models of the gut-liver axis: what we’ve learned and what remains to be built
Sung, J. H., & Kim, R. (2026) · Frontiers in Immunology · doi:10.3389/fimmu.2026.1858289 · Cited by 2
Microfluidics and Lab-on-a-Chip for Biomedical Applications
Patel, D. K., Espinal, M. M., Patil, T. V., Ganguly, K., Dutta, S. D., Luthfikasari, R., & Lim, K. (2022) · Springer eBooks · doi:10.1007/978-3-031-16084-4_11 · Cited by 2
Rontard, J., Maisonneuve, B. G. C., & Honegger, T. (2023) · Archives of Pharmacy and Pharmaceutical Sciences · doi:10.29328/journal.apps.1001039 · Cited by 2
Tang, J., Wang, Z., Khutsishvili, D., Zhu, Y., Li, J., Yu, F., Sang, G., Zeng, J., Yi, Z., Huang, Y.-C., et al. (2024) · The Innovation Medicine · doi:10.59717/j.xinn-med.2024.100076 · Cited by 3
Application of Microfluidics in Drug Development
Parhizkar, M., Wang, F., Tsitouridou, A., & Tsaoulidis, D. A. (2024) · AAPS introductions in the pharmaceutical sciences · doi:10.1007/978-3-031-60717-2_12 · Cited by 2
Metadata
- Authors
- Cho, A.-N., Jin, Y., An, Y., Kim, J., Choi, Y. S., Lee, J. S., Kim, J., Choi, W.-Y., Koo, D.-J., Yu, W., Chang, G.-E., Kim, D.-Y., Jo, S.-H., Kim, J., Kim, S.-Y., Kim, Y.-G., Kim, J. Y., Choi, N., Cheong, E., Kim, Y.-J., Je, H. S., Kang, H.-C., & Cho, S.-W.
- Affiliations
- Yonsei University (KR)
- Kangwon National University (KR)
- Seoul National University (KR)
- Duke-NUS Medical School (SG)
- Soongsil University (KR)
- Korea Institute of Science and Technology (KR)
- Corresponding author
- Cho, Seung-Woo
- ORCID
- Venue
- Nature Communications
- Published
- 2021-08-05
- Volume
- 12
- Issue
- 1
- Pages
- 4730-4730
- ISSN
- 2041-1723 (ISSN-L)
- PMC
- PMC8342542
- OpenAlex
- W3188744629
- Cited by
- 397
- References
- 91
- Citations by year
- 2026: 77 · 2025: 83 · 2024: 96 · 2023: 66 · 2022: 69 · 2021: 6
- FWCI
- 18.60
- Type
- journal article
- Language
- en
- Open access
- gold
- doi.org
- Locations
- Nature Communications (publishedVersion, cc-by)
- PubMed Central (publishedVersion, cc-by)
- PubMed (publishedVersion)
- RePEc: Research Papers in Economics (submittedVersion)
- DOAJ (DOAJ: Directory of Open Access Journals) (submittedVersion, cc-by-sa)
- YUHSpace (Yonsei University Medical Library) (submittedVersion, cc-by-nc-nd)
- Funders
- National Research Foundation of Korea (2016M3C9A4921712, 2017M3C7A1047659, 2018M3A9H1021382)
- Institute for Basic Science (IBS-R026-D1)
- Samsung (SRFC-TC2003-03)
- Topics
- Life Sciences › Biochemistry, Genetics and Molecular Biology › Molecular Biology › Pluripotent Stem Cells Research
- Physical Sciences › Engineering › Biomedical Engineering › 3D Printing in Biomedical Research
- Life Sciences › Neuroscience › Developmental Neuroscience › Neurogenesis and neuroplasticity mechanisms
- Keywords
- brain organoids, microfluidics, brain extracellular matrix, induced pluripotent stem cells, neurogenesis, organoid maturation, dynamic culture, periodic flow, electrophysiological function, 3D cell culture
- MeSH terms
- Animals, Brain, Culture Media, Extracellular Matrix, Feasibility Studies, Humans, Models, Anatomic, Models, Neurological, Neuroglia, Organ Culture Techniques, Organoids, Swine, Hydrogels, Gene Expression Profiling, Neurogenesis, Electrophysiological Phenomena, Lab-On-A-Chip Devices, Induced Pluripotent Stem Cells
About these checks
Registry, retraction, Cites and statistics results are computed, not judged, with one exception: a printed reference that no index lists is read once by a model before it counts as a citation error. Claims are extracted by a model and kept only when their quote appears verbatim in the text; each cited source is then checked, with a model’s help, for whether it says what the claim relies on. Those verdicts can be wrong — read the claim’s quote and the cited source before relying on one.
Statistics and arithmetic are recomputed, not judged.
Confidence bands are shown only for fields calibrated on our annotated test set. None is calibrated yet, so no band is shown.
What counts as a claim ›How we measure confidence ›How we check this ›
Are you an author, or do you see a problem with this page? Request a review
