

The DOI matches its Crossref record; 56 of the 56 references it cites were found in a registry or an index; 11 of the 53 sources its claims cite were checked for support.
Combining gut microbiota modulation and chemotherapy by capecitabine-loaded prebiotic nanoparticle improves colorectal cancer therapy
Open accessAbstract
Colorectal cancer (CRC) therapy efficiency can be influenced by the microbiota in the gastrointestinal tract. Compared with traditional intervention, prebiotics delivery into the gut is a more controllable method for gut microbiota modulatory therapy. Capecitabine (Cap), the first-line chemotherapeutic agent for CRC, lacks a carrier that can prolong its half-life. Here, we construct a Cap-loaded nanoparticle using the prebiotic xylan-stearic acid conjugate (SCXN). The oral administration of SCXN delays the drug clearance in the blood and increases the intra-tumoral Cap concentration in the CRC mouse model. SCXN also facilitates the probiotic proliferation and short chain fatty acid production. Compared with free Cap, SCXN enhances the anti-tumor immunity and increases the tumor inhibition rate from 5.29 to 71.78%. SCXN exhibits good biocompatibility and prolongs the median survival time of CRC mice from 14 to 33.5 d. This prebiotics-based nanoparticle provides a promising CRC treatment by combining gut microbiota modulation and chemotherapy.
Overview
AI snapshot
Written from the paper’s full text.
TL;DR
The paper constructs SCXN, an oral capecitabine-loaded nanoparticle made from a xylan–stearic acid conjugate, to combine chemotherapy with gut microbiota modulation for colorectal cancer. In mouse CRC models, SCXN improved drug pharmacokinetics, tumor inhibition, anti-tumor immunity, probiotic abundance, short-chain fatty acid production, and survival compared with free capecitabine.
Key findings
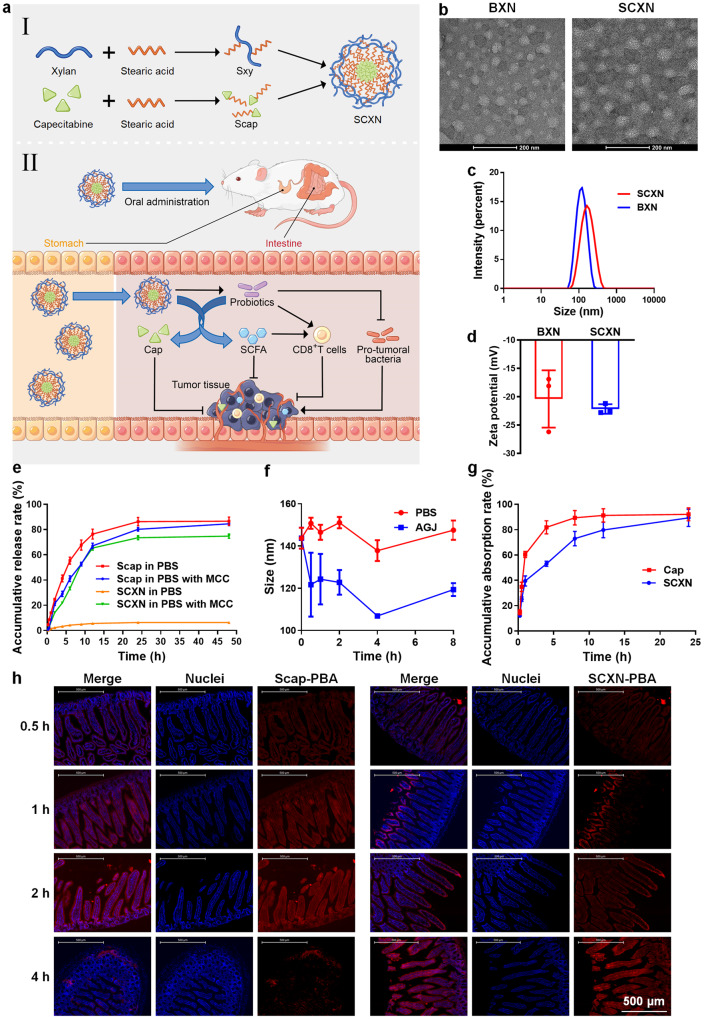
- SCXN had a capecitabine drug loading of 9.49% and encapsulation efficiency of 87.59%, with a mean size of 152.37 ± 1.88 nm and zeta potential of −22.17 ± 0.69 mV. It released less than 7% of Scap in PBS over 48 h but up to 75% in mouse caecal content medium, and delayed small-intestinal Cap absorption (53.1% at 4 h vs. >80% for free Cap).
- SCXN increased Cap AUC(0-∞) and T1/2 to 2.31 and 2.73 times those of free Cap, respectively, and reduced plasma clearance to 43.18% of free Cap. It also maintained higher intratumoral 5-Fu at 8–24 h.
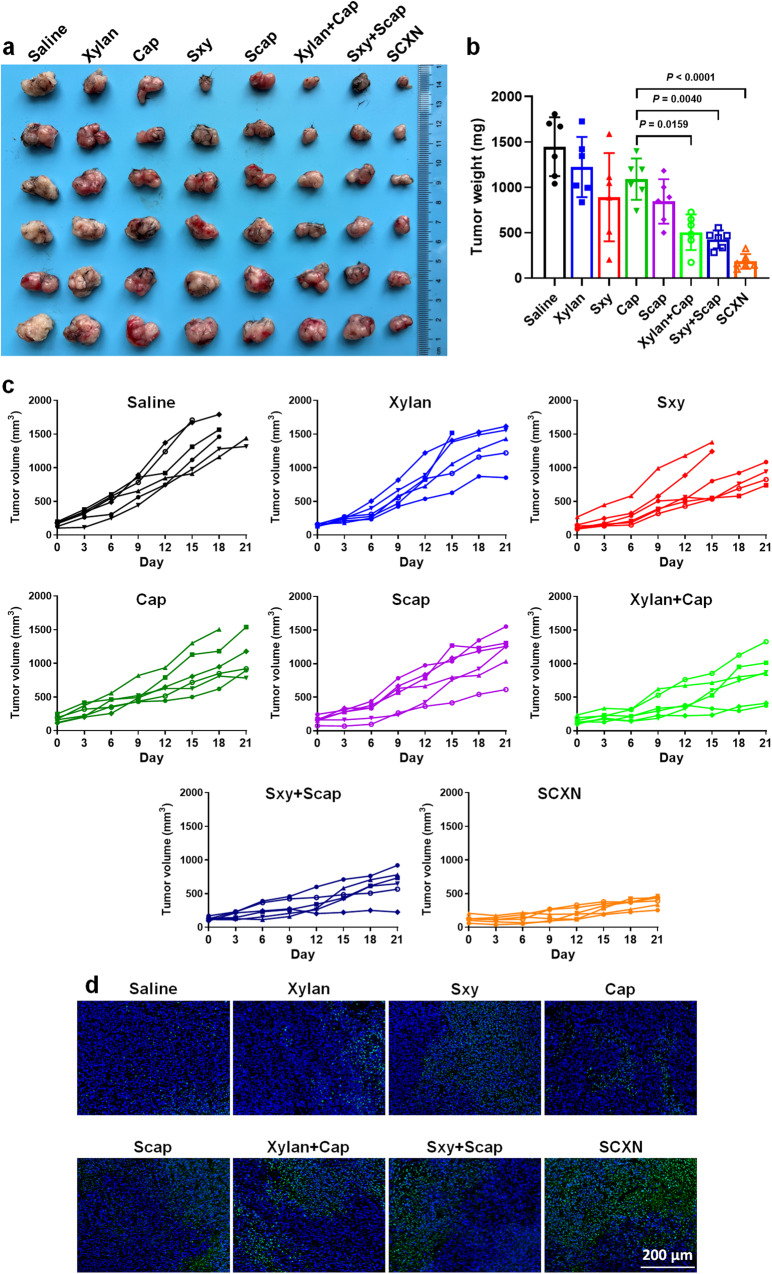
- In CT26-luc tumor-bearing mice, SCXN achieved a tumor inhibition rate of 71.78%, compared with 5.29% for Scap and 8.24% for Cap, and prolonged median survival to 33.5 d versus 14–15 d for saline, xylan, and Sxy groups. In MC38 tumors, SCXN achieved a TIR of 87.33%, with tumor volumes controlled below 500 mm³ versus 1547 mm³ for saline and 1111 mm³ for free Cap.
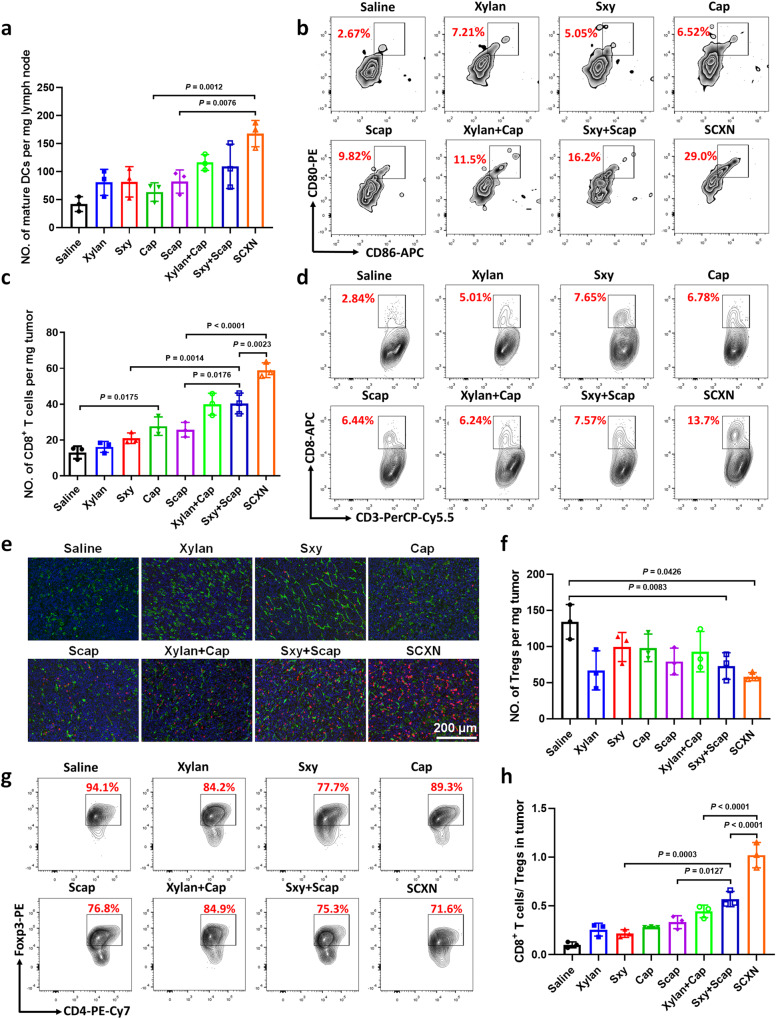
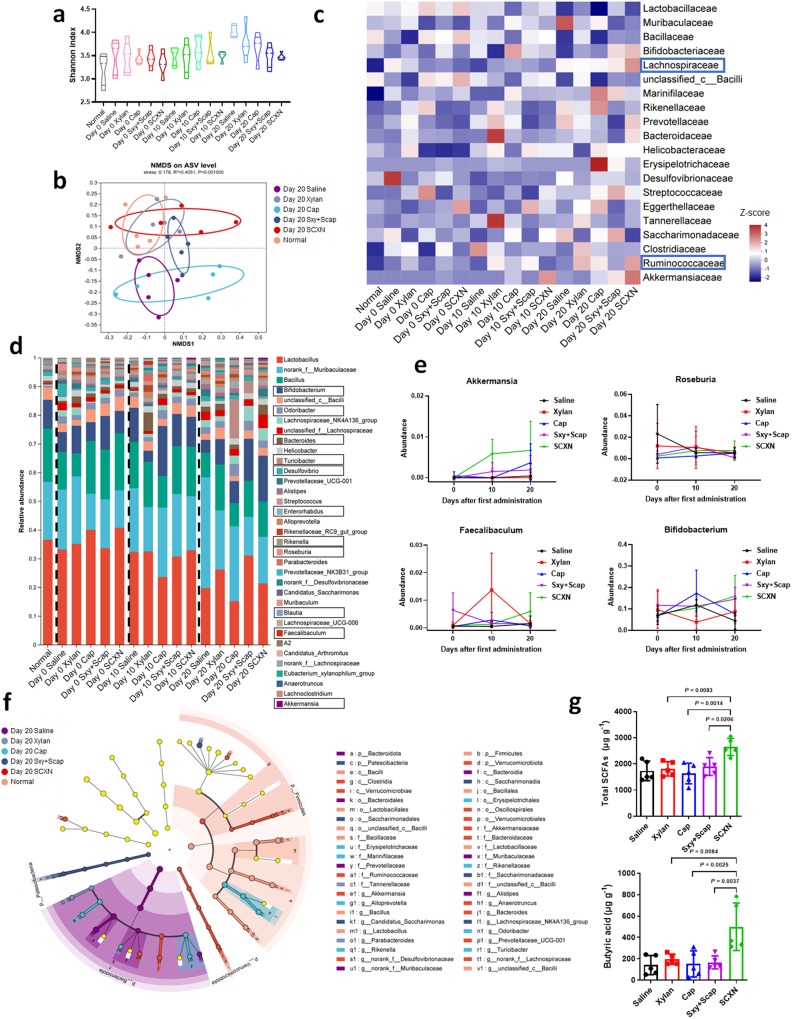
- SCXN increased matured dendritic cells by 1.44× versus xylan+Cap and 2.64× versus Cap, increased intratumoral CD8+ T cells by 2.13× versus Cap, reduced Tregs to 56.6% of saline, and increased the CD8+ T cell/Treg ratio to 3.60× and 2.30× those of Cap and xylan+Cap, respectively. Fecal SCFA content increased by at least 37%, and butyric acid was 3.53× and 3.27× that of saline and Cap groups; beneficial taxa including Bifidobacterium, Roseburia, Akkermansia, and Faecalibaculum increased, while Desulfovibrio decreased.
Methods
- The authors synthesized amphiphilic xylan–stearic acid (Sxy) and capecitabine–stearic acid (Scap) conjugates, prepared SCXN by film dispersion, and characterized it using NMR, MALDI-TOF MS, TEM, DLS, and HPLC.
- In vitro release was tested in PBS, artificial gastric juice, and mouse caecal content medium. In vivo studies used CT26, CT26-luc, and MC38 mouse tumor models for biodistribution, pharmacokinetics, biocompatibility, anti-tumor efficacy, survival, immune cell analysis, 16S rDNA sequencing, and GC-MS SCFA measurement.
- Mice were orally treated with 50 mg/kg Cap and 500 mg/kg xylan daily for three weeks. Statistical analyses included unpaired two-sided t-tests, one-way ANOVA with Tukey’s test, and log-rank tests, with n = 3–9 mice per group depending on the experiment.
Limitations
- The paper does not include a dedicated limitations section. It states that no statistical method was used to predetermine sample size and that investigators were not blinded to allocation during experiments and outcome assessment.
- Evident from the text: all efficacy and safety data come from mouse models (CT26, CT26-luc, MC38), sample sizes are small (often n = 3–9), and survival evaluation ended at Day 45. The anti-tumor dose of 50 mg/kg/day is less than a tenth of the clinical 61 mg/kg/day, so the free Cap comparison was at a low dose.
- Evident from the text: microbiota and SCFA analyses are limited to fecal samples and 16S rDNA/GC-MS measurements, and the causal link between specific microbial taxa and tumor control is not fully established.
Model-written summary. Check it against the paper before relying on it.
Integrity signals
Registry
Cites
Statistics
Figures
Verification
Claims the paper makes
76 Own result · 26 Own interpretation · 14 Not checked yet · 10 No full text of the sources · 9 Own method · 9 No basis given · 6 Partly supported · 1 Supported so far · accuracy not yet measured
The cited sources support only part of this claim — read each source’s verdict below.
In the paper
“Therefore, regulation of gut microbiota is a promising approach to improving the efficacy of CRC therapy10.”
§ Combining gut microbiota modulation and chemotherapy by capecitabine-loaded prebiotic nanoparticle improves colorectal cancer therapy > Introduction
What the sources say
- Partly supportedcites [10] McQuade, J. L., Daniel, C. R., Helmink, B. A. & Wargo, J. A. Modulating the microbiome to improve therapeutic response in cancer. Lancet Oncol. 20, e77–e91 (2019). sourceExperimental — accuracy not yet measured
The Introduction and Conclusion support microbiome modulation as a promising way to improve cancer therapy, citing enhanced responses in preclinical models. The Chemotherapy section links a bacterium to treatment resistance in colorectal cancer, but the review does not establish that regulating gut microbiota improves the efficacy of colorectal cancer therapy specifically. (LLM, conf=0.84)
plainconditional- Asserted: passes — The authors put it forward as true.
- Checkable: passes — It can be checked against evidence.
- Load-bearing: passes — The paper’s conclusions depend on it.
- Based: passes — The paper gives a reason why it holds.
- Partly supported
The cited sources support only part of this claim — read each source’s verdict below.
In the paper
“Several probiotics or their products can inhibit tumor development by suppressing inflammation and promoting anti-tumor immune responses6,7.”
§ Combining gut microbiota modulation and chemotherapy by capecitabine-loaded prebiotic nanoparticle improves colorectal cancer therapy > Introduction
What the sources say
- Partly supportedcites [6] Sun, S. et al. Bifidobacterium alters the gut microbiota and modulates the functional metabolism of T regulatory cells in the context of immune checkpoint blockade. Proc. Natl Acad. Sci. USA 117, 27509–27515 (2020). sourceExperimental — accuracy not yet measured
The Abstract (page unavailable) reports that Bifidobacterium attenuated intestinal inflammation in mice without impairing the antitumor function of CTLA-4 blockade. The Discussion (page unavailable) describes enhanced suppressive function of intestinal regulatory T cells. The paper does not establish that several probiotics or their products inhibit tumor development by promoting antitumor immune responses. (LLM, conf=0.87)
- Partly supportedcites [7] Griffin, M. E. et al. Enterococcus peptidoglycan remodeling promotes checkpoint inhibitor cancer immunotherapy. Science 373, 1040–1046 (2021). sourceExperimental — accuracy not yet measured
The study text indexed under Abstract (page unavailable) reports that SagA-expressing bacteria and synthetic muropeptides improved anti–PD-L1 antitumor efficacy in mice, with evidence of an enhanced tumor-specific immune response. It does not show that they suppress inflammation, and the reported tumor inhibition occurred alongside checkpoint-inhibitor treatment rather than from probiotics or their products alone. (LLM, conf=0.87)
plaindirect- Asserted: passes — The authors put it forward as true.
- Checkable: passes — It can be checked against evidence.
- Load-bearing: passes — The paper’s conclusions depend on it.
- Based: passes — The paper gives a reason why it holds.
- Partly supported
The cited sources support only part of this claim — read each source’s verdict below.
In the paper
“the important xylan-degrading bacteria, Bacteroides, have been found to support the growth of other probiotics like Roseburia and Bifidobacterium, partly explaining the changes of these species in the SCXN-treated group17,43,44.”
§ Combining gut microbiota modulation and chemotherapy by capecitabine-loaded prebiotic nanoparticle improves colorectal cancer therapy > Discussion
What the sources say
- Partly supportedcites [17] Zeybek, N., Rastall, R. A. & Buyukkileci, A. O. Utilization of xylan-type polysaccharides in co-culture fermentations of Bifidobacterium and Bacteroides species. Carbohydr. Polym. 236, 116076 (2020). sourceExperimental — accuracy not yet measured
The Conclusion (section 5; page unavailable) reports that Bacteroides enabled B. animalis subsp. lactis to grow on xylan, but says other tested Bifidobacterium species did not benefit. The Discussion (section 4; page unavailable) mentions Roseburia as an acetate-to-butyrate converter, not as a species whose growth Bacteroides supported. The paper does not examine the SCXN-treated group or explain its observed changes. (LLM, conf=0.88)
- Not checked — no full text of the sourcecites [43] Leth, M. L. et al. Differential bacterial capture and transport preferences facilitate co-growth on dietary xylan in the human gut. Nat. Microbiol. 3, 570–580 (2018). source
- Partly supportedcites [44] Dodd, D., Mackie, R. I. & Cann, I. K. Xylan degradation, a metabolic property shared by rumen and human colonic Bacteroidetes. Mol. Microbiol. 79, 292–304 (2011). sourceExperimental — accuracy not yet measured
The section “Xylan degradation by gut-associated Bacteroidetes” identifies Bacteroides as an important xylan-degrading group. The “Unresolved issues” section notes the presence of xylo-oligosaccharide-fermenting bacteria but treats effects on community populations as an open question. Neither passage establishes that Bacteroides supports the growth of Roseburia or Bifidobacterium, or explains their changes in the SCXN-treated group. Page numbers are unavailable in our copy. (LLM, conf=0.88)
plaindirect- Asserted: passes — The authors put it forward as true.
- Checkable: passes — It can be checked against evidence.
- Load-bearing: unclear — It is unclear whether the paper’s conclusions depend on it.
- Based: passes — The paper gives a reason why it holds.
- Partly supported
A result the paper reports from its own data — it cites no other source for it, so there is none to check. The quote shows it is in the paper.
In the paper
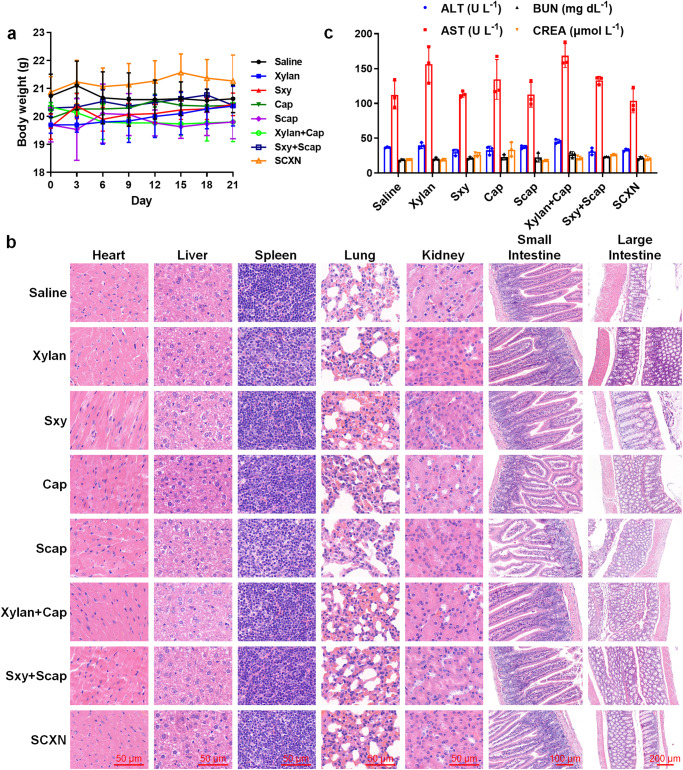
“there was no difference in the blood biochemical index between the saline and SCXN groups”
§ Combining gut microbiota modulation and chemotherapy by capecitabine-loaded prebiotic nanoparticle improves colorectal cancer therapy > Results > Biocompatibility
plainn = 3- Asserted: passes — The authors put it forward as true.
- Checkable: passes — It can be checked against evidence.
- Load-bearing: passes — The paper’s conclusions depend on it.
- Based: passes — The paper gives a reason why it holds.
A result the paper reports from its own data — it cites no other source for it, so there is none to check. The quote shows it is in the paper.
In the paper
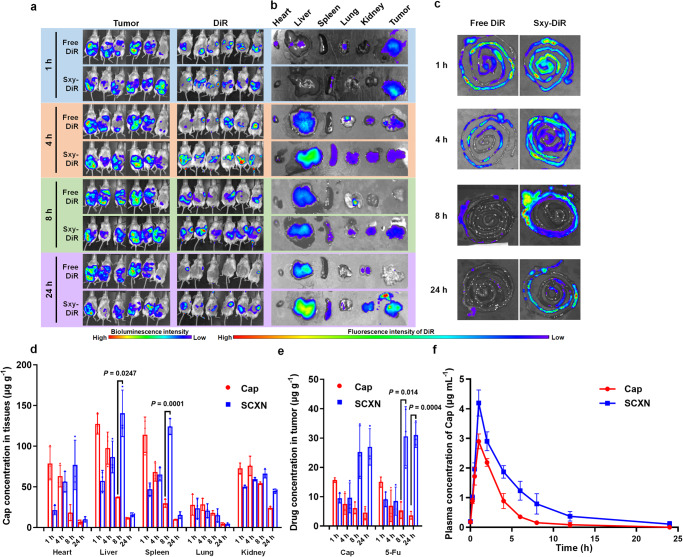
“almost equal DiR signals appeared in the abdomens of the two groups at 1 h post administration”
§ Combining gut microbiota modulation and chemotherapy by capecitabine-loaded prebiotic nanoparticle improves colorectal cancer therapy > Results > SCXN increases the intra-tumoral drug accumulation
hedged- Asserted: passes — The authors put it forward as true.
- Checkable: passes — It can be checked against evidence.
- Load-bearing: unclear — It is unclear whether the paper’s conclusions depend on it.
- Based: passes — The paper gives a reason why it holds.
A result the paper reports from its own data — it cites no other source for it, so there is none to check. The quote shows it is in the paper.
In the paper
“As a contrast, the release of free Scap was rapid and complete (nearly 85%) in both media.”
§ Combining gut microbiota modulation and chemotherapy by capecitabine-loaded prebiotic nanoparticle improves colorectal cancer therapy > Results > Construction and characterization of SCXN
plain- Asserted: passes — The authors put it forward as true.
- Checkable: passes — It can be checked against evidence.
- Load-bearing: unclear — It is unclear whether the paper’s conclusions depend on it.
- Based: passes — The paper gives a reason why it holds.
A result the paper reports from its own data — it cites no other source for it, so there is none to check. The quote shows it is in the paper.
In the paper
“Plasma clearance of the SCXN group was 43.18% of that of the free Cap group.”
§ Combining gut microbiota modulation and chemotherapy by capecitabine-loaded prebiotic nanoparticle improves colorectal cancer therapy > Results > SCXN increases the intra-tumoral drug accumulation
plain- Asserted: passes — The authors put it forward as true.
- Checkable: passes — It can be checked against evidence.
- Load-bearing: passes — The paper’s conclusions depend on it.
- Based: passes — The paper gives a reason why it holds.
A result the paper reports from its own data — it cites no other source for it, so there is none to check. The quote shows it is in the paper.
In the paper
“SCXN also facilitates the probiotic proliferation and short chain fatty acid production.”
- Also stated in: § SCXN enhances the proliferation of probiotics · plain
“the SCFA content in the feces of mice treated with SCXN was increased by 37% at least”
§ Combining gut microbiota modulation and chemotherapy by capecitabine-loaded prebiotic nanoparticle improves colorectal cancer therapy > Abstract
plaindirect- Asserted: passes — The authors put it forward as true.
- Checkable: passes — It can be checked against evidence.
- Load-bearing: passes — The paper’s conclusions depend on it.
- Based: passes — The paper gives a reason why it holds.
- Also stated in: § SCXN enhances the proliferation of probiotics · plain
A result the paper reports from its own data — it cites no other source for it, so there is none to check. The quote shows it is in the paper.
In the paper
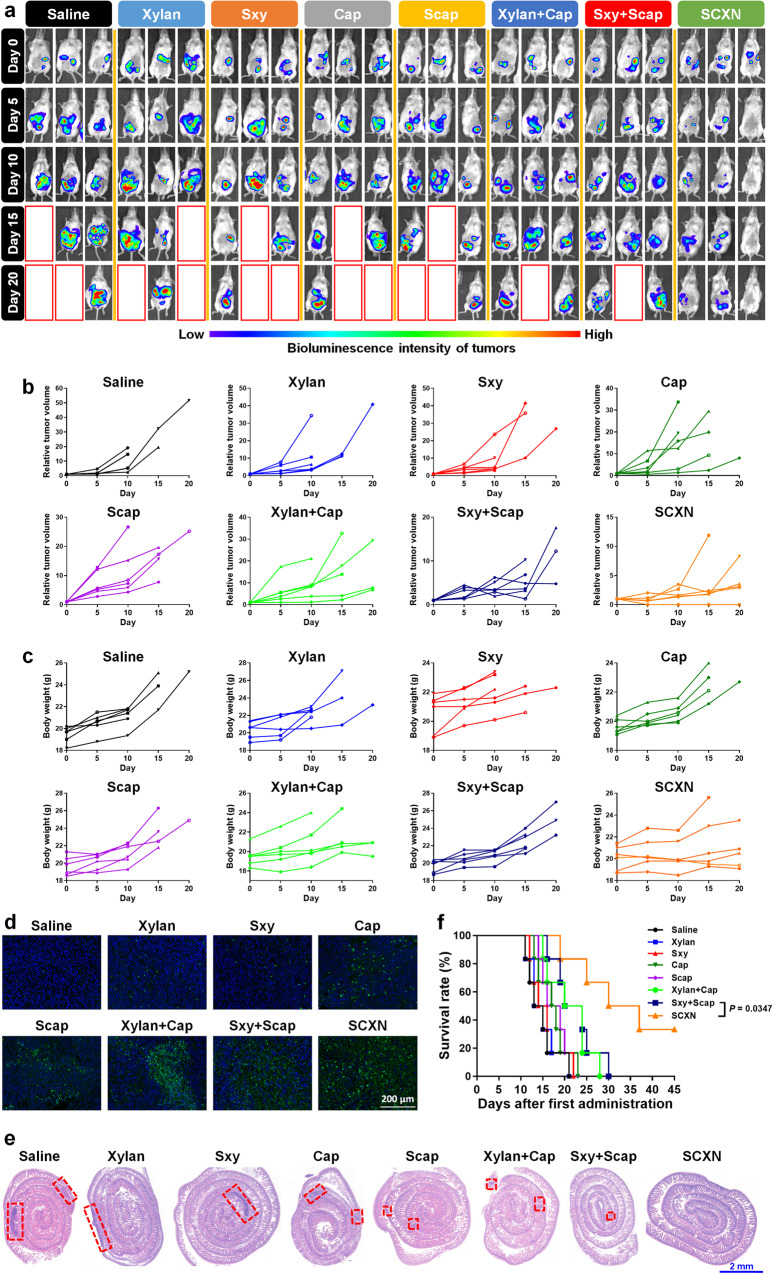
“Compared with free Cap, SCXN enhances the anti-tumor immunity and increases the tumor inhibition rate from 5.29 to 71.78%.”
- Also stated in: § SCXN enhances the in vivo anti-tumor effects · plain
“reaching a TIR of 71.78%”
§ Combining gut microbiota modulation and chemotherapy by capecitabine-loaded prebiotic nanoparticle improves colorectal cancer therapy > Abstract
plaindirect- Asserted: passes — The authors put it forward as true.
- Checkable: passes — It can be checked against evidence.
- Load-bearing: passes — The paper’s conclusions depend on it.
- Based: passes — The paper gives a reason why it holds.
- Also stated in: § SCXN enhances the in vivo anti-tumor effects · plain
A result the paper reports from its own data — it cites no other source for it, so there is none to check. The quote shows it is in the paper.
In the paper
“The oral administration of SCXN delays the drug clearance in the blood and increases the intra-tumoral Cap concentration in the CRC mouse model.”
- Also stated in: § SCXN increases the intra-tumoral drug accumulation · plain
“The concentrations of 5-Fu, the active metabolite of Cap, in tumors of the SCXN group were kept at a relatively high level at 8–24 h”
§ Combining gut microbiota modulation and chemotherapy by capecitabine-loaded prebiotic nanoparticle improves colorectal cancer therapy > Abstract
plaindirect- Asserted: passes — The authors put it forward as true.
- Checkable: passes — It can be checked against evidence.
- Load-bearing: passes — The paper’s conclusions depend on it.
- Based: passes — The paper gives a reason why it holds.
- Also stated in: § SCXN increases the intra-tumoral drug accumulation · plain
- Probably not a substantial claim. 23
- It may state two separate claims as one. 55
- The quote only partly states this claim. 1
The sources with a verdict support this claim; the rest weren’t checked yet, have no full text we could read, or their verdicts aren’t rated yet.
In the paper
“Prebiotics are a group of substances that can be used by host bacteria to enhance the proportion of beneficial species to improve the anti-tumor immunity13–15.”
§ Combining gut microbiota modulation and chemotherapy by capecitabine-loaded prebiotic nanoparticle improves colorectal cancer therapy > Introduction
What the sources say
- Not checked — no full text of the sourcecites [13] Zheng, D. W. et al. Phage-guided modulation of the gut microbiota of mouse models of colorectal cancer augments their responses to chemotherapy. Nat. Biomed. Eng. 3, 717–728 (2019). source
- Not checked — no full text of the sourcecites [14] Zheng, D. W. et al. Prebiotics-encapsulated probiotic spores regulate gut microbiota and suppress colon cancer. Adv. Mater. 32, e2004529 (2020). source
- Supportedcites [15] Han, K. et al. Generation of systemic antitumour immunity via the in situ modulation of the gut microbiome by an orally administered inulin gel. Nat. Biomed. Eng. 5, 1377–1388 (2021). source
The Abstract describes inulin as a dietary fiber that promotes beneficial commensal microbes and improves anti-tumour responses with α-PD-1 therapy. The Results sections report increased relative abundances of Akkermansia, Lactobacillus and Roseburia, and link microbial fermentation of inulin gel to an anti-tumour CD8+ T-cell response. This supports the claim as a statement about what prebiotics can do, based on the paper’s inulin example. (LLM, conf=0.88)
plaindirect- Asserted: passes — The authors put it forward as true.
- Checkable: passes — It can be checked against evidence.
- Load-bearing: passes — The paper’s conclusions depend on it.
- Based: passes — The paper gives a reason why it holds.
Probably not a substantial claim.
The cited sources support only part of this claim — read each source’s verdict below.
In the paper
“Fecal microbiota transplant (FMT) is the most direct approach for gut microbiota modulation in the treatment of several digestive diseases11,12.”
§ Combining gut microbiota modulation and chemotherapy by capecitabine-loaded prebiotic nanoparticle improves colorectal cancer therapy > Introduction
What the sources say
- Partly supportedcites [11] Littmann, E. R. et al. Host immunity modulates the efficacy of microbiota transplantation for treatment of Clostridioides difficile infection. Nat. Commun. 12, 755 (2021). sourceExperimental — accuracy not yet measured
The Introduction (page unavailable) describes FMT as a microbiota-based treatment clinically proven for recurrent C. difficile infection, and says successful FMT restores the intestinal microbial community. It does not call FMT the most direct approach or establish it as a treatment for several digestive diseases; instead, it says microbiota-based therapies are not yet treatment options for most diseases affected by dysbiosis. (LLM, conf=0.87)
- Not checked — no full text of the sourcecites [12] Borody, T. J., Eslick, G. D. & Clancy, R. L. Fecal microbiota transplantation as a new therapy: from Clostridioides difficile infection to inflammatory bowel disease, irritable bowel syndrome, and colon cancer. Curr. Opin. Pharmacol. 49, 43–51 (2019). source
plaindirect- Asserted: passes — The authors put it forward as true.
- Checkable: passes — It can be checked against evidence.
- Load-bearing: fails — The paper’s conclusions may not depend on it.
- Based: passes — The paper gives a reason why it holds.
Probably not a substantial claim. The paper’s conclusions may not depend on it.
- Partly supported
The cited sources support only part of this claim — read each source’s verdict below.
In the paper
“Bifidobacterium, Akkermansia, and Roseburia have been associated with improved tumor immunotherapy in clinic34–37.”
§ Combining gut microbiota modulation and chemotherapy by capecitabine-loaded prebiotic nanoparticle improves colorectal cancer therapy > Discussion
What the sources say
- Not checked yetcites [34] Sivan, A. et al. Commensal Bifidobacterium promotes antitumor immunity and facilitates anti-PD-L1 efficacy. Science 350, 1084–1089 (2015). source
Checked before — its earlier verdict is held back until a new check runs.
- Not checked — no full text of the sourcecites [35] Routy, B. et al. Gut microbiome influences efficacy of PD−1-based immunotherapy against epithelial tumors. Science 359, 91–97 (2018). source
- Partly supportedcites [36] Matson, V. et al. The commensal microbiome is associated with anti-PD−1 efficacy in metastatic melanoma patients. Science 359, 104–108 (2018). sourceExperimental — accuracy not yet measured
In the passages labeled Abstract, Bifidobacterium species were more abundant in patients who responded to anti–PD-1 therapy. Akkermansia muciniphila was detected in four patients, all responders, though the paper says that was too few for a cohort-wide statistical analysis. Roseburia intestinalis, by contrast, was more abundant in nonresponders, so this source does not support including Roseburia among bacteria associated with improved clinical response. (LLM, conf=0.88)
- Supportedcites [37] Lee, K. A. et al. Cross-cohort gut microbiome associations with immune checkpoint inhibitor response in advanced melanoma. Nat. Med. 28, 535–544 (2022). source
The Results section identifies a panel of species associated with ICI responders that includes Bifidobacterium pseudocatenulatum, Roseburia spp. and Akkermansia muciniphila. These are clinical associations in patients with advanced melanoma, not evidence that the bacteria cause improved response; the paper also cautions that no single bacterium was a fully consistent biomarker across cohorts. (LLM, conf=0.91)
plaincorrelational- Asserted: passes — The authors put it forward as true.
- Checkable: passes — It can be checked against evidence.
- Load-bearing: fails — The paper’s conclusions may not depend on it.
- Based: passes — The paper gives a reason why it holds.
Probably not a substantial claim. The paper’s conclusions may not depend on it.
- Not checked yet
The cited sources support only part of this claim — read each source’s verdict below.
In the paper
“Compared to the acetate production pathway, which is common to most species, butyrate and propionate production is restricted to a much smaller group of bacterial types51,52.”
§ Combining gut microbiota modulation and chemotherapy by capecitabine-loaded prebiotic nanoparticle improves colorectal cancer therapy > Discussion
What the sources say
- Partly supportedcites [51] Pryde, S. E., Duncan, S. H., Hold, G. L., Stewart, C. S. & Flint, H. J. The microbiology of butyrate formation in the human colon. FEMS Microbiol. Lett. 217, 133–139 (2002). sourceExperimental — accuracy not yet measured
Section 3 (page unavailable) says most cultured human-gut butyrate producers are related to Clostridia, supporting some taxonomic restriction. But it also describes them as spread across several clusters, and neither that section nor the Conclusions compares their range with acetate producers or establishes that propionate production is similarly restricted. (LLM, conf=0.79)
- Supportedcites [52] Al-Qadami, G. H., Secombe, K. R., Subramaniam, C. B., Wardill, H. R. & Bowen, J. M. Gut microbiota-derived short-chain fatty acids: impact on cancer treatment response and toxicities. Microorganisms 10, 2048 (2022). source
Section 2, “Short-Chain Fatty Acids” (page not provided), says acetate-production pathways are widely distributed among bacterial types, whereas butyrate and propionate production is restricted to a small group. This directly supports the attributed comparison. (LLM, conf=0.95)
plain- Asserted: passes — The authors put it forward as true.
- Checkable: passes — It can be checked against evidence.
- Load-bearing: fails — The paper’s conclusions may not depend on it.
- Based: passes — The paper gives a reason why it holds.
Probably not a substantial claim. The paper’s conclusions may not depend on it.
- Partly supported
A result the paper reports from its own data — it cites no other source for it, so there is none to check. The quote shows it is in the paper.
In the paper
“The molecular ratios of Sa:xylan and Sa:Cap in Sxy and Scap were calculated to be 1:1 and 2:1, respectively.”
§ Combining gut microbiota modulation and chemotherapy by capecitabine-loaded prebiotic nanoparticle improves colorectal cancer therapy > Results > Construction and characterization of SCXN
plain- Asserted: passes — The authors put it forward as true.
- Checkable: passes — It can be checked against evidence.
- Load-bearing: unclear — It is unclear whether the paper’s conclusions depend on it.
- Based: passes — The paper gives a reason why it holds.
It may state two separate claims as one.
A result the paper reports from its own data — it cites no other source for it, so there is none to check. The quote shows it is in the paper.
In the paper
“More than 60% of the free Cap was absorbed into the small intestine within 1 h, and more than 80% in 4 h”
§ Combining gut microbiota modulation and chemotherapy by capecitabine-loaded prebiotic nanoparticle improves colorectal cancer therapy > Results > Construction and characterization of SCXN
plain- Asserted: passes — The authors put it forward as true.
- Checkable: passes — It can be checked against evidence.
- Load-bearing: passes — The paper’s conclusions depend on it.
- Based: passes — The paper gives a reason why it holds.
It may state two separate claims as one.
A result the paper reports from its own data — it cites no other source for it, so there is none to check. The quote shows it is in the paper.
In the paper
“In the MCC-containing medium, Scap was gradually released from SCXN, with an accumulative release rate of up to 75% at 48 h”
§ Combining gut microbiota modulation and chemotherapy by capecitabine-loaded prebiotic nanoparticle improves colorectal cancer therapy > Results > Construction and characterization of SCXN
plaindirect- Asserted: unclear — It is unclear whether the authors put it forward as true.
- Checkable: passes — It can be checked against evidence.
- Load-bearing: passes — The paper’s conclusions depend on it.
- Based: passes — The paper gives a reason why it holds.
It may state two separate claims as one.
A result the paper reports from its own data — it cites no other source for it, so there is none to check. The quote shows it is in the paper.
In the paper
“The zeta potentials of BXN and SCXN were −20.40 ± 4.13 and −22.17 ± 0.69 mV, respectively”
§ Combining gut microbiota modulation and chemotherapy by capecitabine-loaded prebiotic nanoparticle improves colorectal cancer therapy > Results > Construction and characterization of SCXN
plain- Asserted: passes — The authors put it forward as true.
- Checkable: passes — It can be checked against evidence.
- Load-bearing: unclear — It is unclear whether the paper’s conclusions depend on it.
- Based: passes — The paper gives a reason why it holds.
It may state two separate claims as one.
A result the paper reports from its own data — it cites no other source for it, so there is none to check. The quote shows it is in the paper.
In the paper
“The mean particle sizes of BXN and SCXN determined via dynamic light scattering (DLS) were 112.83 ± 1.26 and 152.37 ± 1.88 nm, respectively”
§ Combining gut microbiota modulation and chemotherapy by capecitabine-loaded prebiotic nanoparticle improves colorectal cancer therapy > Results > Construction and characterization of SCXN
plain- Asserted: passes — The authors put it forward as true.
- Checkable: passes — It can be checked against evidence.
- Load-bearing: unclear — It is unclear whether the paper’s conclusions depend on it.
- Based: passes — The paper gives a reason why it holds.
It may state two separate claims as one.
A result the paper reports from its own data — it cites no other source for it, so there is none to check. The quote shows it is in the paper.
In the paper
“When delivered by SCXN, Cap showed a much slower absorption rate in the small intestine than the free drug, with only 53.1% detected at 4 h.”
§ Combining gut microbiota modulation and chemotherapy by capecitabine-loaded prebiotic nanoparticle improves colorectal cancer therapy > Results > Construction and characterization of SCXN
plaindirect- Asserted: passes — The authors put it forward as true.
- Checkable: passes — It can be checked against evidence.
- Load-bearing: passes — The paper’s conclusions depend on it.
- Based: passes — The paper gives a reason why it holds.
It may state two separate claims as one.
A result the paper reports from its own data — it cites no other source for it, so there is none to check. The quote shows it is in the paper.
In the paper
“The signals of Sxy-DiR were stronger than those of free DiR in the small intestine within 4 h and in the large intestine, where CT26 tumors were located, from 8 to 24 h”
§ Combining gut microbiota modulation and chemotherapy by capecitabine-loaded prebiotic nanoparticle improves colorectal cancer therapy > Results > SCXN increases the intra-tumoral drug accumulation
plaincorrelational- Asserted: passes — The authors put it forward as true.
- Checkable: passes — It can be checked against evidence.
- Load-bearing: passes — The paper’s conclusions depend on it.
- Based: passes — The paper gives a reason why it holds.
It may state two separate claims as one.
A result the paper reports from its own data — it cites no other source for it, so there is none to check. The quote shows it is in the paper.
In the paper
“Compared with the free Cap group, SCXN showed an enlarged area under the concentration-time curve (AUC) of Cap, with increased half-life (T1/2) and decreased plasma clearance”
§ Combining gut microbiota modulation and chemotherapy by capecitabine-loaded prebiotic nanoparticle improves colorectal cancer therapy > Results > SCXN increases the intra-tumoral drug accumulation
plaindirect- Asserted: passes — The authors put it forward as true.
- Checkable: passes — It can be checked against evidence.
- Load-bearing: passes — The paper’s conclusions depend on it.
- Based: passes — The paper gives a reason why it holds.
It may state two separate claims as one.
A result the paper reports from its own data — it cites no other source for it, so there is none to check. The quote shows it is in the paper.
In the paper
“the DiR signal intensity of the free DiR group weakened and could hardly be detected in the mice after 24 h. In contrast, the high signal intensity lasted for 24 h in the Sxy-DiR group.”
§ Combining gut microbiota modulation and chemotherapy by capecitabine-loaded prebiotic nanoparticle improves colorectal cancer therapy > Results > SCXN increases the intra-tumoral drug accumulation
plaincorrelational- Asserted: passes — The authors put it forward as true.
- Checkable: passes — It can be checked against evidence.
- Load-bearing: passes — The paper’s conclusions depend on it.
- Based: passes — The paper gives a reason why it holds.
It may state two separate claims as one.
A result the paper reports from its own data — it cites no other source for it, so there is none to check. The quote shows it is in the paper.
In the paper
“Compared with free DiR, the distribution of Sxy-DiR in tumors was obviously higher after 8 h, maintaining a strong fluorescence intensity at 24 h.”
§ Combining gut microbiota modulation and chemotherapy by capecitabine-loaded prebiotic nanoparticle improves colorectal cancer therapy > Results > SCXN increases the intra-tumoral drug accumulation
plaincorrelational- Asserted: passes — The authors put it forward as true.
- Checkable: passes — It can be checked against evidence.
- Load-bearing: passes — The paper’s conclusions depend on it.
- Based: passes — The paper gives a reason why it holds.
It may state two separate claims as one.
The paper states this without a source or data behind it here, so there is nothing to check it against. The quote shows it is in the paper.
In the paper
“Particle size of SCXN decreased to approximately 120 nm after incubation with the artificial gastric juice (AGJ) for 30 min, but remained stable without any significant size change in the following 7.5 h”
§ Combining gut microbiota modulation and chemotherapy by capecitabine-loaded prebiotic nanoparticle improves colorectal cancer therapy > Results > Construction and characterization of SCXN
plaindirect- Asserted: passes — The authors put it forward as true.
- Checkable: passes — It can be checked against evidence.
- Load-bearing: passes — The paper’s conclusions depend on it.
- Based: passes — The paper gives a reason why it holds.
It may state two separate claims as one.
A result the paper reports from its own data — it cites no other source for it, so there is none to check. The quote shows it is in the paper.
In the paper
“AUC(0-∞) and T1/2 of Cap of the SCXN group were 2.31 and 2.73 times of those of the free Cap group, respectively.”
§ Combining gut microbiota modulation and chemotherapy by capecitabine-loaded prebiotic nanoparticle improves colorectal cancer therapy > Results > SCXN increases the intra-tumoral drug accumulation
plaindirect- Asserted: passes — The authors put it forward as true.
- Checkable: passes — It can be checked against evidence.
- Load-bearing: passes — The paper’s conclusions depend on it.
- Based: passes — The paper gives a reason why it holds.
It may state two separate claims as one.
A result the paper reports from its own data — it cites no other source for it, so there is none to check. The quote shows it is in the paper.
In the paper
“At 2 h, the fluorescence of free Scap-PBA became brighter, and SCXN-PBA started to diffuse.”
§ Combining gut microbiota modulation and chemotherapy by capecitabine-loaded prebiotic nanoparticle improves colorectal cancer therapy > Results > Construction and characterization of SCXN
plain- Asserted: passes — The authors put it forward as true.
- Checkable: passes — It can be checked against evidence.
- Load-bearing: unclear — It is unclear whether the paper’s conclusions depend on it.
- Based: passes — The paper gives a reason why it holds.
It may state two separate claims as one.
A result the paper reports from its own data — it cites no other source for it, so there is none to check. The quote shows it is in the paper.
In the paper
“The transport of free Scap-PBA across the villi was nearly complete at 4 h, exhibiting concentrated fluorescence at the base and a negligible signal in the villi.”
§ Combining gut microbiota modulation and chemotherapy by capecitabine-loaded prebiotic nanoparticle improves colorectal cancer therapy > Results > Construction and characterization of SCXN
plain- Asserted: passes — The authors put it forward as true.
- Checkable: passes — It can be checked against evidence.
- Load-bearing: passes — The paper’s conclusions depend on it.
- Based: passes — The paper gives a reason why it holds.
It may state two separate claims as one.
A result the paper reports from its own data — it cites no other source for it, so there is none to check. The quote shows it is in the paper.
In the paper
“The drug loading (DL) and encapsulation efficiency (EE) of Cap in SCXN were 9.49 and 87.59%, respectively”
§ Combining gut microbiota modulation and chemotherapy by capecitabine-loaded prebiotic nanoparticle improves colorectal cancer therapy > Results > Construction and characterization of SCXN
plain- Asserted: passes — The authors put it forward as true.
- Checkable: passes — It can be checked against evidence.
- Load-bearing: unclear — It is unclear whether the paper’s conclusions depend on it.
- Based: passes — The paper gives a reason why it holds.
It may state two separate claims as one.
A result the paper reports from its own data — it cites no other source for it, so there is none to check. The quote shows it is in the paper.
In the paper
“BXN and SCXN investigated via transmission electron microscopy (TEM) appeared as spherical and homogeneous particles”
§ Combining gut microbiota modulation and chemotherapy by capecitabine-loaded prebiotic nanoparticle improves colorectal cancer therapy > Results > Construction and characterization of SCXN
hedged- Asserted: passes — The authors put it forward as true.
- Checkable: passes — It can be checked against evidence.
- Load-bearing: unclear — It is unclear whether the paper’s conclusions depend on it.
- Based: passes — The paper gives a reason why it holds.
It may state two separate claims as one.
A result the paper reports from its own data — it cites no other source for it, so there is none to check. The quote shows it is in the paper.
In the paper
“none of healthy mice receiving various formulations showed obvious body weight loss, and almost no pathological variation in the main organs was observed according to the hematoxylin and eosin (H&E)-stained sections”
§ Combining gut microbiota modulation and chemotherapy by capecitabine-loaded prebiotic nanoparticle improves colorectal cancer therapy > Results > Biocompatibility
plainn = 3- Asserted: passes — The authors put it forward as true.
- Checkable: passes — It can be checked against evidence.
- Load-bearing: passes — The paper’s conclusions depend on it.
- Based: passes — The paper gives a reason why it holds.
It may state two separate claims as one.
The paper states this without a source or data behind it here, so there is nothing to check it against. The quote shows it is in the paper.
In the paper
“We conjugate stearic acid (Sa) with xylan and Cap to synthesize their amphiphilic derivatives, termed Sxy and Scap, respectively.”
§ Combining gut microbiota modulation and chemotherapy by capecitabine-loaded prebiotic nanoparticle improves colorectal cancer therapy > Introduction
plaindirect- Asserted: passes — The authors put it forward as true.
- Checkable: passes — It can be checked against evidence.
- Load-bearing: passes — The paper’s conclusions depend on it.
- Based: passes — The paper gives a reason why it holds.
Probably not a substantial claim. It may state two separate claims as one.
A result the paper reports from its own data — it cites no other source for it, so there is none to check. The quote shows it is in the paper.
In the paper
“The weight-average molecular weights (Mw) of Sxy and Scap measured by matrix-assisted laser desorption ionization time-of-flight mass spectrometry (MALDI-TOF MS) were 1299.5 and 904.3, respectively”
§ Combining gut microbiota modulation and chemotherapy by capecitabine-loaded prebiotic nanoparticle improves colorectal cancer therapy > Results > Construction and characterization of SCXN
plain- Asserted: passes — The authors put it forward as true.
- Checkable: passes — It can be checked against evidence.
- Load-bearing: unclear — It is unclear whether the paper’s conclusions depend on it.
- Based: passes — The paper gives a reason why it holds.
It may state two separate claims as one.
A result the paper reports from its own data — it cites no other source for it, so there is none to check. The quote shows it is in the paper.
In the paper
“Free Scap-PBA was distributed throughout the villi, while SCXN-PBA mainly aggregated around the villi surface.”
§ Combining gut microbiota modulation and chemotherapy by capecitabine-loaded prebiotic nanoparticle improves colorectal cancer therapy > Results > Construction and characterization of SCXN
plain- Asserted: passes — The authors put it forward as true.
- Checkable: passes — It can be checked against evidence.
- Load-bearing: passes — The paper’s conclusions depend on it.
- Based: passes — The paper gives a reason why it holds.
It may state two separate claims as one.
A result the paper reports from its own data — it cites no other source for it, so there is none to check. The quote shows it is in the paper.
In the paper
“The concentrations of 5-Fu, the active metabolite of Cap, in tumors of the SCXN group were kept at a relatively high level at 8–24 h, while those of the free Cap group decreased rapidly over time”
§ Combining gut microbiota modulation and chemotherapy by capecitabine-loaded prebiotic nanoparticle improves colorectal cancer therapy > Results > SCXN increases the intra-tumoral drug accumulation
plaindirect- Asserted: passes — The authors put it forward as true.
- Checkable: passes — It can be checked against evidence.
- Load-bearing: passes — The paper’s conclusions depend on it.
- Based: passes — The paper gives a reason why it holds.
It may state two separate claims as one.
A result the paper reports from its own data — it cites no other source for it, so there is none to check. The quote shows it is in the paper.
In the paper
“For SCXN-PBA, the spreading in the villi continued, showing stronger fluorescence than that at 2 h.”
§ Combining gut microbiota modulation and chemotherapy by capecitabine-loaded prebiotic nanoparticle improves colorectal cancer therapy > Results > Construction and characterization of SCXN
plaincorrelational- Asserted: passes — The authors put it forward as true.
- Checkable: passes — It can be checked against evidence.
- Load-bearing: unclear — It is unclear whether the paper’s conclusions depend on it.
- Based: passes — The paper gives a reason why it holds.
It may state two separate claims as one.
A result the paper reports from its own data — it cites no other source for it, so there is none to check. The quote shows it is in the paper.
In the paper
“the Tregs numbers in the tumors were significantly reduced, which was only 56.6% of that of the saline group”
§ Combining gut microbiota modulation and chemotherapy by capecitabine-loaded prebiotic nanoparticle improves colorectal cancer therapy > Results > SCXN promotes the anti-tumor immune responses
plaindirect- Asserted: passes — The authors put it forward as true.
- Checkable: passes — It can be checked against evidence.
- Load-bearing: passes — The paper’s conclusions depend on it.
- Based: passes — The paper gives a reason why it holds.
It may state two separate claims as one.
A result the paper reports from its own data — it cites no other source for it, so there is none to check. The quote shows it is in the paper.
In the paper
“SCXN achieved the a TIR of 87.33%, with a high rate of cell apoptosis in tumor sections examined by TUNEL”
§ Combining gut microbiota modulation and chemotherapy by capecitabine-loaded prebiotic nanoparticle improves colorectal cancer therapy > Results > SCXN enhances the in vivo anti-tumor effects
plaindirectn = 3- Asserted: passes — The authors put it forward as true.
- Checkable: passes — It can be checked against evidence.
- Load-bearing: passes — The paper’s conclusions depend on it.
- Based: passes — The paper gives a reason why it holds.
It may state two separate claims as one.
A result the paper reports from its own data — it cites no other source for it, so there is none to check. The quote shows it is in the paper.
In the paper
“The tumor volumes were controlled at less than 500 mm3 by SCXN, while those in the saline and free Cap groups grew to 1547 mm3 and 1111 mm3”
§ Combining gut microbiota modulation and chemotherapy by capecitabine-loaded prebiotic nanoparticle improves colorectal cancer therapy > Results > SCXN enhances the in vivo anti-tumor effects
plaindirectn = 6- Asserted: passes — The authors put it forward as true.
- Checkable: passes — It can be checked against evidence.
- Load-bearing: passes — The paper’s conclusions depend on it.
- Based: passes — The paper gives a reason why it holds.
It may state two separate claims as one.
A result the paper reports from its own data — it cites no other source for it, so there is none to check. The quote shows it is in the paper.
In the paper
“the CD8+ T cells to Tregs ratio of the SCXN group was 3.60 and 2.30 times of those of the Cap and xylan+Cap groups, respectively”
§ Combining gut microbiota modulation and chemotherapy by capecitabine-loaded prebiotic nanoparticle improves colorectal cancer therapy > Results > SCXN promotes the anti-tumor immune responses
plaincorrelational- Asserted: passes — The authors put it forward as true.
- Checkable: passes — It can be checked against evidence.
- Load-bearing: passes — The paper’s conclusions depend on it.
- Based: passes — The paper gives a reason why it holds.
It may state two separate claims as one.
A result the paper reports from its own data — it cites no other source for it, so there is none to check. The quote shows it is in the paper.
In the paper
“The results were further confirmed by linear discriminant analysis effect size (LEfSe) analysis”
§ Combining gut microbiota modulation and chemotherapy by capecitabine-loaded prebiotic nanoparticle improves colorectal cancer therapy > Results > SCXN enhances the proliferation of probiotics
plaincorrelational- Asserted: passes — The authors put it forward as true.
- Checkable: passes — It can be checked against evidence.
- Load-bearing: fails — The paper’s conclusions may not depend on it.
- Based: passes — The paper gives a reason why it holds.
Probably not a substantial claim. The paper’s conclusions may not depend on it.
A result the paper reports from its own data — it cites no other source for it, so there is none to check. The quote shows it is in the paper.
In the paper
“Cap or Sxy+Scap-treated mice exhibited a continuous increase in Turicibacter, Rikenella, and Odoribacter, while SCXN hardly induced a similar change.”
§ Combining gut microbiota modulation and chemotherapy by capecitabine-loaded prebiotic nanoparticle improves colorectal cancer therapy > Results > SCXN enhances the proliferation of probiotics
plaindirect- Asserted: passes — The authors put it forward as true.
- Checkable: passes — It can be checked against evidence.
- Load-bearing: unclear — It is unclear whether the paper’s conclusions depend on it.
- Based: passes — The paper gives a reason why it holds.
It may state two separate claims as one.
A result the paper reports from its own data — it cites no other source for it, so there is none to check. The quote shows it is in the paper.
In the paper
“Although the relative abundance of the probiotics Bifidobacterium and Blautia increased at the middle therapy stage with Cap, it decreased to a comparatively low level at the end of treatment.”
§ Combining gut microbiota modulation and chemotherapy by capecitabine-loaded prebiotic nanoparticle improves colorectal cancer therapy > Results > SCXN enhances the proliferation of probiotics
plaindirect- Asserted: passes — The authors put it forward as true.
- Checkable: passes — It can be checked against evidence.
- Load-bearing: unclear — It is unclear whether the paper’s conclusions depend on it.
- Based: passes — The paper gives a reason why it holds.
It may state two separate claims as one.
A result the paper reports from its own data — it cites no other source for it, so there is none to check. The quote shows it is in the paper.
In the paper
“The concentration of butyric acid, one of the most concerned beneficial SCFA for stimulating CD8+ T cells, in the fecal samples of the SCXN group was 3.53 and 3.27 times of those in the saline and Cap groups, respectively”
§ Combining gut microbiota modulation and chemotherapy by capecitabine-loaded prebiotic nanoparticle improves colorectal cancer therapy > Results > SCXN enhances the proliferation of probiotics
plaincorrelational- Asserted: passes — The authors put it forward as true.
- Checkable: passes — It can be checked against evidence.
- Load-bearing: passes — The paper’s conclusions depend on it.
- Based: passes — The paper gives a reason why it holds.
It may state two separate claims as one.
A result the paper reports from its own data — it cites no other source for it, so there is none to check. The quote shows it is in the paper.
In the paper
“In contrast, SCXN achieved fine modulation without causing an increase of opportunistic pathogenic bacteria, and maintained Bifidobacterium.”
§ Combining gut microbiota modulation and chemotherapy by capecitabine-loaded prebiotic nanoparticle improves colorectal cancer therapy > Discussion
plaindirect- Asserted: passes — The authors put it forward as true.
- Checkable: passes — It can be checked against evidence.
- Load-bearing: passes — The paper’s conclusions depend on it.
- Based: passes — The paper gives a reason why it holds.
It may state two separate claims as one.
The paper states this without a source or data behind it here, so there is nothing to check it against. The quote shows it is in the paper.
In the paper
“The improved anti-tumor immune responses and tumor growth-suppressing efficacy of xylan+Cap compared with xylan”
§ Combining gut microbiota modulation and chemotherapy by capecitabine-loaded prebiotic nanoparticle improves colorectal cancer therapy > Discussion
plaindirect- Asserted: passes — The authors put it forward as true.
- Checkable: passes — It can be checked against evidence.
- Load-bearing: passes — The paper’s conclusions depend on it.
- Based: passes — The paper gives a reason why it holds.
It may state two separate claims as one.
A result the paper reports from its own data — it cites no other source for it, so there is none to check. The quote shows it is in the paper.
In the paper
“At the genus level, the abundance of Roseburia and Bifidobacterium decreased in the saline group throughout the therapy period but increased in the SCXN group”
§ Combining gut microbiota modulation and chemotherapy by capecitabine-loaded prebiotic nanoparticle improves colorectal cancer therapy > Results > SCXN enhances the proliferation of probiotics
plaindirect- Asserted: passes — The authors put it forward as true.
- Checkable: passes — It can be checked against evidence.
- Load-bearing: passes — The paper’s conclusions depend on it.
- Based: passes — The paper gives a reason why it holds.
It may state two separate claims as one.
A result the paper reports from its own data — it cites no other source for it, so there is none to check. The quote shows it is in the paper.
In the paper
“Once mice were treated with co-delivered Sxy and Scap in the nanoparticle form, the ascites decreased, and the bioluminescence emitted from tumor cells was maintained at a low level during the therapy period, reaching a TIR of 71.78%.”
§ Combining gut microbiota modulation and chemotherapy by capecitabine-loaded prebiotic nanoparticle improves colorectal cancer therapy > Results > SCXN enhances the in vivo anti-tumor effects
plaindirect- Asserted: passes — The authors put it forward as true.
- Checkable: passes — It can be checked against evidence.
- Load-bearing: passes — The paper’s conclusions depend on it.
- Based: passes — The paper gives a reason why it holds.
It may state two separate claims as one.
The paper states this without a source or data behind it here, so there is nothing to check it against. The quote shows it is in the paper.
In the paper
“and that of Sxy+Scap vs. Sxy”
§ Combining gut microbiota modulation and chemotherapy by capecitabine-loaded prebiotic nanoparticle improves colorectal cancer therapy > Discussion
plaindirect- Asserted: passes — The authors put it forward as true.
- Checkable: passes — It can be checked against evidence.
- Load-bearing: passes — The paper’s conclusions depend on it.
- Based: passes — The paper gives a reason why it holds.
It may state two separate claims as one.
None of the sources cited for this claim have been checked yet.
In the paper
“SCXN promoted the growth of various SCFAs producers, among which Roseburia (Lachnospiraceae) and Ruminococcaceae belong to the main butyrate-producing taxa, Clostridia, and Bifidobacterium and Bacteroides are the main acetate and propionate producers52–54.”
§ Combining gut microbiota modulation and chemotherapy by capecitabine-loaded prebiotic nanoparticle improves colorectal cancer therapy > Discussion
What the sources say
- Not checked yetcites [52] Al-Qadami, G. H., Secombe, K. R., Subramaniam, C. B., Wardill, H. R. & Bowen, J. M. Gut microbiota-derived short-chain fatty acids: impact on cancer treatment response and toxicities. Microorganisms 10, 2048 (2022). source
Checked before — its earlier verdict is held back until a new check runs.
- Not checked yetcites [53] Duncan, S. H. et al. Contribution of acetate to butyrate formation by human faecal bacteria. Br. J. Nutr. 91, 915–923 (2004). source
Checked before — its earlier verdict is held back until a new check runs.
- Not checked yetcites [54] Liu, T. et al. A More Robust Gut microbiota in calorie-restricted mice is associated with attenuated intestinal injury caused by the chemotherapy drug cyclophosphamide. mBio 10, e02903–e02918 (2019). source
Checked before — its earlier verdict is held back until a new check runs.
plaindirect- Asserted: passes — The authors put it forward as true.
- Checkable: passes — It can be checked against evidence.
- Load-bearing: passes — The paper’s conclusions depend on it.
- Based: passes — The paper gives a reason why it holds.
It may state two separate claims as one.
- Not checked yet
A result the paper reports from its own data — it cites no other source for it, so there is none to check. The quote shows it is in the paper.
In the paper
“SCXN also induced a significant increase in the abundance of beneficial Akkermansia and Faecalibaculum and a decrease in the proportion of harmful Desulfovibro.”
§ Combining gut microbiota modulation and chemotherapy by capecitabine-loaded prebiotic nanoparticle improves colorectal cancer therapy > Results > SCXN enhances the proliferation of probiotics
plaindirect- Asserted: passes — The authors put it forward as true.
- Checkable: passes — It can be checked against evidence.
- Load-bearing: passes — The paper’s conclusions depend on it.
- Based: passes — The paper gives a reason why it holds.
It may state two separate claims as one.
In the paper
“Capecitabine (Cap), an inactive oral fluoropyrimidine carbamate, is metabolized via a three-step cascade after absorption, and converts into 5-fluorouracil predominantly in the tumor tissues23.”
§ Combining gut microbiota modulation and chemotherapy by capecitabine-loaded prebiotic nanoparticle improves colorectal cancer therapy > Introduction
What the sources say
- Not checked — no full text of the sourcecites [23] Schuller, J. et al. Preferential activation of capecitabine in tumor following oral administration to colorectal cancer patients. Cancer Chemother. Pharmacol. 45, 291–297 (2000). source
plaindirect- Asserted: passes — The authors put it forward as true.
- Checkable: passes — It can be checked against evidence.
- Load-bearing: passes — The paper’s conclusions depend on it.
- Based: passes — The paper gives a reason why it holds.
It may state two separate claims as one.
In the paper
“However, systematically administrated chemotherapeutic agents exhibit insufficient curative efficacy and severe side effects, indicating the necessity to develop rational alternatives22.”
§ Combining gut microbiota modulation and chemotherapy by capecitabine-loaded prebiotic nanoparticle improves colorectal cancer therapy > Introduction
What the sources say
- Not checked — no full text of the sourcecites [22] Ribeiro, R. A. et al. Irinotecan- and 5-fluorouracil-induced intestinal mucositis: insights into pathogenesis and therapeutic perspectives. Cancer Chemother. Pharmacol. 78, 881–893 (2016). source
plaindirect- Asserted: passes — The authors put it forward as true.
- Checkable: passes — It can be checked against evidence.
- Load-bearing: passes — The paper’s conclusions depend on it.
- Based: passes — The paper gives a reason why it holds.
It may state two separate claims as one.
In the paper
“Intriguingly, xylan remains intact in the upper gastrointestinal tract (GIT) and is only degraded by microbes in the lower GIT, making it suitable for intestine-targeting drug delivery18.”
§ Combining gut microbiota modulation and chemotherapy by capecitabine-loaded prebiotic nanoparticle improves colorectal cancer therapy > Introduction
What the sources say
- Not checked — no full text of the sourcecites [18] Dos Santos, A. M. et al. Oral delivery of micro/nanoparticulate systems based on natural polysaccharides for intestinal diseases therapy: challenges, advances and future perspectives. J. Control. Release 334, 353–366 (2021). source
plaindirect- Asserted: passes — The authors put it forward as true.
- Checkable: passes — It can be checked against evidence.
- Load-bearing: passes — The paper’s conclusions depend on it.
- Based: passes — The paper gives a reason why it holds.
It may state two separate claims as one.
None of the sources cited for this claim have been checked yet.
In the paper
“Xylan is a polysaccharide prebiotic that exhibits favorable water solubility, good biocompatibility, and probiotic-boosting capacity, suggesting its potential for biomedical applications16,17.”
§ Combining gut microbiota modulation and chemotherapy by capecitabine-loaded prebiotic nanoparticle improves colorectal cancer therapy > Introduction
What the sources say
- Not checked — no full text of the sourcecites [16] Sun, X. F., Wang, H. H., Jing, Z. X. & Mohanathas, R. Carbohydr. Polym. 92, 1357–1366 (2013). source
- Not checked yetcites [17] Zeybek, N., Rastall, R. A. & Buyukkileci, A. O. Utilization of xylan-type polysaccharides in co-culture fermentations of Bifidobacterium and Bacteroides species. Carbohydr. Polym. 236, 116076 (2020). source
Checked before — its earlier verdict is held back until a new check runs.
plain- Asserted: passes — The authors put it forward as true.
- Checkable: passes — It can be checked against evidence.
- Load-bearing: passes — The paper’s conclusions depend on it.
- Based: passes — The paper gives a reason why it holds.
It may state two separate claims as one.
In the paper
“Cap is the first-line treatment regimen for metastatic CRC24.”
§ Combining gut microbiota modulation and chemotherapy by capecitabine-loaded prebiotic nanoparticle improves colorectal cancer therapy > Introduction
What the sources say
- Not checked — no full text of the sourcecites [24] Cassidy, J. et al. First-line oral capecitabine therapy in metastatic colorectal cancer: a favorable safety profile compared with intravenous 5-fluorouracil/leucovorin. Ann. Oncol. 13, 566–575 (2002). source
plain- Asserted: passes — The authors put it forward as true.
- Checkable: passes — It can be checked against evidence.
- Load-bearing: fails — The paper’s conclusions may not depend on it.
- Based: passes — The paper gives a reason why it holds.
Probably not a substantial claim. The paper’s conclusions may not depend on it.
None of the sources cited for this claim have been checked yet.
In the paper
“Currently, chemotherapy is the predominant anti-CRC therapeutic regimen21.”
§ Combining gut microbiota modulation and chemotherapy by capecitabine-loaded prebiotic nanoparticle improves colorectal cancer therapy > Introduction
What the sources say
- Not checked yetcites [21] Gustavsson, B. et al. A review of the evolution of systemic chemotherapy in the management of colorectal cancer. Clin. Colorectal Cancer 14, 1–10 (2015). source
Checked before — its earlier verdict is held back until a new check runs.
plain- Asserted: passes — The authors put it forward as true.
- Checkable: passes — It can be checked against evidence.
- Load-bearing: fails — The paper’s conclusions may not depend on it.
- Based: passes — The paper gives a reason why it holds.
Probably not a substantial claim. The paper’s conclusions may not depend on it.
- Not checked yet
A claim is checked only against the cited paper’s full text, never its abstract, and none is available for its sources.
In the paper
“Despite its tumor-specific toxicity and high response rate, the blood plasma half-life of Cap is too short (0.5–1 h), therefore, a high-dose administration is necessary twice daily, but it may cause dose-related toxicity25,26.”
§ Combining gut microbiota modulation and chemotherapy by capecitabine-loaded prebiotic nanoparticle improves colorectal cancer therapy > Introduction
What the sources say
- Not checked — no full text of the sourcecites [25] Upadhyay, M., Adena, S. K. R., Vardhan, H., Yadav, S. K. & Mishra, B. Locust bean gum and sodium alginate based interpenetrating polymeric network microbeads encapsulating Capecitabine: improved pharmacokinetics, cytotoxicity &in vivo antitumor activity. Mater. Sci. Eng. C. Mater. Biol. Appl. 104, 109958 (2019). source
- Not checked — no full text of the sourcecites [26] Kevadiya, B. D. et al. Evaluation of montmorillonite/poly (L-Lactide) microcomposite spheres as ambidextrous reservoirs for controlled release of Capecitabine (Xeloda) and assessment of cell cytotoxic and oxidative stress markers. Compos. Sci. Technol. 90, 193–201 (2014). source
hedgedconditional- Asserted: passes — The authors put it forward as true.
- Checkable: passes — It can be checked against evidence.
- Load-bearing: passes — The paper’s conclusions depend on it.
- Based: passes — The paper gives a reason why it holds.
It may state two separate claims as one.
A conclusion the paper draws from its own results — it cites no other source for it, so there is none to check. The quote shows it is in the paper.
In the paper
“thus, both are essential for treatment.”
§ Combining gut microbiota modulation and chemotherapy by capecitabine-loaded prebiotic nanoparticle improves colorectal cancer therapy > Discussion
plaindirect- Asserted: passes — The authors put it forward as true.
- Checkable: passes — It can be checked against evidence.
- Load-bearing: passes — The paper’s conclusions depend on it.
- Based: passes — The paper gives a reason why it holds.
It may state two separate claims as one.
What the paper did — it cites no source for this, so there is none to check. The quote shows it is in the paper.
In the paper
“No samples were excluded from the analyses.”
§ Combining gut microbiota modulation and chemotherapy by capecitabine-loaded prebiotic nanoparticle improves colorectal cancer therapy > Methods > Statistics and reproducibility
plain- Asserted: passes — The authors put it forward as true.
- Checkable: passes — It can be checked against evidence.
- Load-bearing: fails — The paper’s conclusions may not depend on it.
- Based: passes — The paper gives a reason why it holds.
Probably not a substantial claim. The paper’s conclusions may not depend on it.
A conclusion the paper draws from its own results — it cites no other source for it, so there is none to check. The quote shows it is in the paper.
In the paper
“SCXN relieved the immune escape and efficiently promoted the anti-tumor immune response.”
§ Combining gut microbiota modulation and chemotherapy by capecitabine-loaded prebiotic nanoparticle improves colorectal cancer therapy > Discussion
plaindirect- Asserted: passes — The authors put it forward as true.
- Checkable: passes — It can be checked against evidence.
- Load-bearing: passes — The paper’s conclusions depend on it.
- Based: passes — The paper gives a reason why it holds.
It may state two separate claims as one.
A conclusion the paper draws from its own results — it cites no other source for it, so there is none to check. The quote shows it is in the paper.
In the paper
“SCXN ensured a high Cap concentration in the blood for a longer time, thus promoting the drug accumulation in tumors.”
§ Combining gut microbiota modulation and chemotherapy by capecitabine-loaded prebiotic nanoparticle improves colorectal cancer therapy > Discussion
plaindirect- Asserted: passes — The authors put it forward as true.
- Checkable: passes — It can be checked against evidence.
- Load-bearing: passes — The paper’s conclusions depend on it.
- Based: passes — The paper gives a reason why it holds.
It may state two separate claims as one.
None of the sources cited for this claim have been checked yet.
In the paper
“Desulfovibrio is an endotoxin/H2S-producing proteobacteria that is probably related to inflammation40.”
§ Combining gut microbiota modulation and chemotherapy by capecitabine-loaded prebiotic nanoparticle improves colorectal cancer therapy > Discussion
What the sources say
- Not checked yetcites [40] Zhang, H., Hui, D., Li, Y., Xiong, G. & Fu, X. Canmei formula reduces colitis-associated colorectal carcinogenesis in mice by modulating the composition of gut microbiota. Front. Oncol. 9, 1149 (2019). source
Checked before — its earlier verdict is held back until a new check runs.
hedgedcorrelational- Asserted: passes — The authors put it forward as true.
- Checkable: passes — It can be checked against evidence.
- Load-bearing: fails — The paper’s conclusions may not depend on it.
- Based: passes — The paper gives a reason why it holds.
Probably not a substantial claim. The paper’s conclusions may not depend on it. It may state two separate claims as one.
- Not checked yet
A conclusion the paper draws from its own results — it cites no other source for it, so there is none to check. The quote shows it is in the paper.
In the paper
“SCXN was quite stable in the upper GIT, and the Scap release rate might be dependent on the degree to which Sxy was decomposed by the microbiota in the intestine.”
§ Combining gut microbiota modulation and chemotherapy by capecitabine-loaded prebiotic nanoparticle improves colorectal cancer therapy > Discussion
hedgedconditional- Asserted: passes — The authors put it forward as true.
- Checkable: passes — It can be checked against evidence.
- Load-bearing: passes — The paper’s conclusions depend on it.
- Based: passes — The paper gives a reason why it holds.
It may state two separate claims as one.
What the paper did — it cites no source for this, so there is none to check. The quote shows it is in the paper.
In the paper
“Investigators were not blinded to allocation during experiments and outcome assessment”
§ Combining gut microbiota modulation and chemotherapy by capecitabine-loaded prebiotic nanoparticle improves colorectal cancer therapy > Methods > Statistics and reproducibility
plain- Asserted: passes — The authors put it forward as true.
- Checkable: passes — It can be checked against evidence.
- Load-bearing: fails — The paper’s conclusions may not depend on it.
- Based: passes — The paper gives a reason why it holds.
Probably not a substantial claim. The paper’s conclusions may not depend on it.
A conclusion the paper draws from its own results — it cites no other source for it, so there is none to check. The quote shows it is in the paper.
In the paper
“the free drug was quickly eliminated from the body, while the systemic distribution and metabolic process of SCXN in the blood slowed down, which demonstrated that the controlled release of Scap from the Sxy nanoparticle prevented premature drug clearance.”
§ Combining gut microbiota modulation and chemotherapy by capecitabine-loaded prebiotic nanoparticle improves colorectal cancer therapy > Discussion
boosteddirect- Asserted: passes — The authors put it forward as true.
- Checkable: passes — It can be checked against evidence.
- Load-bearing: passes — The paper’s conclusions depend on it.
- Based: passes — The paper gives a reason why it holds.
It may state two separate claims as one.
None of the sources cited for this claim have been checked yet.
In the paper
“The negative impact probably resulted in the damage to the gut barrier and poor control of tumor progression at an advanced stage50.”
§ Combining gut microbiota modulation and chemotherapy by capecitabine-loaded prebiotic nanoparticle improves colorectal cancer therapy > Discussion
What the sources say
- Not checked yetcites [50] Aarnoutse, R. et al. The Role of intestinal microbiota in metastatic colorectal cancer patients treated with capecitabine. Clin. Colorectal Cancer 21, e87–e97 (2022). source
Checked before — its earlier verdict is held back until a new check runs.
hedgedconditional- Asserted: passes — The authors put it forward as true.
- Checkable: passes — It can be checked against evidence.
- Load-bearing: passes — The paper’s conclusions depend on it.
- Based: passes — The paper gives a reason why it holds.
It may state two separate claims as one.
- Not checked yet
What the paper did — it cites no source for this, so there is none to check. The quote shows it is in the paper.
In the paper
“The maximal tumour size did not exceed this limit in this research.”
§ Combining gut microbiota modulation and chemotherapy by capecitabine-loaded prebiotic nanoparticle improves colorectal cancer therapy > Methods > Anti-tumor effect
plain- Asserted: passes — The authors put it forward as true.
- Checkable: passes — It can be checked against evidence.
- Load-bearing: fails — The paper’s conclusions may not depend on it.
- Based: passes — The paper gives a reason why it holds.
Probably not a substantial claim. The paper’s conclusions may not depend on it.
What the paper did — it cites no source for this, so there is none to check. The quote shows it is in the paper.
In the paper
“All animal studies were performed in accordance with the regulations approved by the Institutional Animal Care and Use Committee (IACUC) of Shanghai Institute of Materia Medica, CAS (Approval number: 2020-04-LYP-40).”
§ Combining gut microbiota modulation and chemotherapy by capecitabine-loaded prebiotic nanoparticle improves colorectal cancer therapy > Methods > Animals
plain- Asserted: passes — The authors put it forward as true.
- Checkable: passes — It can be checked against evidence.
- Load-bearing: fails — The paper’s conclusions may not depend on it.
- Based: passes — The paper gives a reason why it holds.
Probably not a substantial claim. The paper’s conclusions may not depend on it.
What the paper did — it cites no source for this, so there is none to check. The quote shows it is in the paper.
In the paper
“No statistical method was used to predetermine sample size.”
§ Combining gut microbiota modulation and chemotherapy by capecitabine-loaded prebiotic nanoparticle improves colorectal cancer therapy > Methods > Statistics and reproducibility
plain- Asserted: passes — The authors put it forward as true.
- Checkable: passes — It can be checked against evidence.
- Load-bearing: fails — The paper’s conclusions may not depend on it.
- Based: passes — The paper gives a reason why it holds.
Probably not a substantial claim. The paper’s conclusions may not depend on it.
In the paper
“Bifidobacterium is a widely recognized probiotic that exerts protective functions in the digestive tract, and Roseburia exerts an anti-inflammatory effect in colitis pathology33.”
§ Combining gut microbiota modulation and chemotherapy by capecitabine-loaded prebiotic nanoparticle improves colorectal cancer therapy > Discussion
What the sources say
- Not checked — no full text of the sourcecites [33] Shen, Z. et al. Insights into Roseburia intestinalis which alleviates experimental colitis pathology by inducing anti-inflammatory responses. J. Gastroenterol. Hepatol. 33, 1751–1760 (2018). source
boosteddirect- Asserted: passes — The authors put it forward as true.
- Checkable: passes — It can be checked against evidence.
- Load-bearing: fails — The paper’s conclusions may not depend on it.
- Based: passes — The paper gives a reason why it holds.
Probably not a substantial claim. The paper’s conclusions may not depend on it. It may state two separate claims as one.
A conclusion the paper draws from its own results — it cites no other source for it, so there is none to check. The quote shows it is in the paper.
In the paper
“Therefore, cooperation with tumor-killing agents or supplementation with exogenous probiotics is essential for the action of xylan in CRC therapy.”
§ Combining gut microbiota modulation and chemotherapy by capecitabine-loaded prebiotic nanoparticle improves colorectal cancer therapy > Discussion
plaindirect- Asserted: passes — The authors put it forward as true.
- Checkable: passes — It can be checked against evidence.
- Load-bearing: passes — The paper’s conclusions depend on it.
- Based: passes — The paper gives a reason why it holds.
It may state two separate claims as one.
What the paper did — it cites no source for this, so there is none to check. The quote shows it is in the paper.
In the paper
“This research complies with all relevant ethical regulations approved by the Institutional Animal Care and Use Committee (IACUC) of Shanghai Institute of Materia Medica, CAS.”
§ Combining gut microbiota modulation and chemotherapy by capecitabine-loaded prebiotic nanoparticle improves colorectal cancer therapy > Methods
plain- Asserted: passes — The authors put it forward as true.
- Checkable: passes — It can be checked against evidence.
- Load-bearing: fails — The paper’s conclusions may not depend on it.
- Based: passes — The paper gives a reason why it holds.
Probably not a substantial claim. The paper’s conclusions may not depend on it.
None of the sources cited for this claim have been checked yet.
In the paper
“The anti-tumor effect of Fecalibaculum has been discovered38,39.”
§ Combining gut microbiota modulation and chemotherapy by capecitabine-loaded prebiotic nanoparticle improves colorectal cancer therapy > Discussion
What the sources say
- Not checked yetcites [38] Zagato, E. et al. Endogenous murine microbiota member Faecalibaculum rodentium and its human homologue protect from intestinal tumour growth. Nat. Microbiol. 5, 511–524 (2020). source
Checked before — its earlier verdict is held back until a new check runs.
- Not checked yetcites [39] McKee, A. M. et al. Antibiotic-induced disturbances of the gut microbiota result in accelerated breast tumor growth. iScience 24, 103012 (2021). source
Checked before — its earlier verdict is held back until a new check runs.
plaindirect- Asserted: passes — The authors put it forward as true.
- Checkable: passes — It can be checked against evidence.
- Load-bearing: fails — The paper’s conclusions may not depend on it.
- Based: passes — The paper gives a reason why it holds.
Probably not a substantial claim. The paper’s conclusions may not depend on it.
- Not checked yet
A conclusion the paper draws from its own results — it cites no other source for it, so there is none to check. The quote shows it is in the paper.
In the paper
“Consequently, the development of CRC was inhibited, and the lifespan of mice was prolonged.”
§ Combining gut microbiota modulation and chemotherapy by capecitabine-loaded prebiotic nanoparticle improves colorectal cancer therapy > Discussion
plaindirect- Asserted: passes — The authors put it forward as true.
- Checkable: passes — It can be checked against evidence.
- Load-bearing: passes — The paper’s conclusions depend on it.
- Based: passes — The paper gives a reason why it holds.
It may state two separate claims as one.
What the paper did — it cites no source for this, so there is none to check. The quote shows it is in the paper.
In the paper
“Mice were assigned randomly to experimental groups.”
§ Combining gut microbiota modulation and chemotherapy by capecitabine-loaded prebiotic nanoparticle improves colorectal cancer therapy > Methods > Statistics and reproducibility
plain- Asserted: passes — The authors put it forward as true.
- Checkable: passes — It can be checked against evidence.
- Load-bearing: fails — The paper’s conclusions may not depend on it.
- Based: passes — The paper gives a reason why it holds.
Probably not a substantial claim. The paper’s conclusions may not depend on it.
What the paper did — it cites no source for this, so there is none to check. The quote shows it is in the paper.
In the paper
“All in vitro and in vivo experiments were carried out with at least 3 biological replicates for each experimental group.”
§ Combining gut microbiota modulation and chemotherapy by capecitabine-loaded prebiotic nanoparticle improves colorectal cancer therapy > Methods > Statistics and reproducibility
plain- Asserted: passes — The authors put it forward as true.
- Checkable: passes — It can be checked against evidence.
- Load-bearing: fails — The paper’s conclusions may not depend on it.
- Based: passes — The paper gives a reason why it holds.
Probably not a substantial claim. The paper’s conclusions may not depend on it.
A conclusion the paper draws from its own results — it cites no other source for it, so there is none to check. The quote shows it is in the paper.
In the paper
“which contributed to the enhanced anti-tumor immunity”
§ Combining gut microbiota modulation and chemotherapy by capecitabine-loaded prebiotic nanoparticle improves colorectal cancer therapy > Results > SCXN enhances the proliferation of probiotics
plaindirect- Asserted: passes — The authors put it forward as true.
- Checkable: passes — It can be checked against evidence.
- Load-bearing: passes — The paper’s conclusions depend on it.
- Based: passes — The paper gives a reason why it holds.
The quote only partly states this claim.
The paper states this without a source or data behind it here, so there is nothing to check it against. The quote shows it is in the paper.
In the paper
“SCFAs are the main products of anaerobic fermentation of indigestible polysaccharides and contribute to immunomodulation in inflammatory diseases and cancer.”
§ Combining gut microbiota modulation and chemotherapy by capecitabine-loaded prebiotic nanoparticle improves colorectal cancer therapy > Discussion
plaindirect- Asserted: passes — The authors put it forward as true.
- Checkable: passes — It can be checked against evidence.
- Load-bearing: passes — The paper’s conclusions depend on it.
- Based: fails — The paper may give no reason why it holds.
Probably not a substantial claim. The paper may give no reason why it holds. It may state two separate claims as one.
A conclusion the paper draws from its own results — it cites no other source for it, so there is none to check. The quote shows it is in the paper.
In the paper
“Mice treated with SCXN displayed a different gut microflora composition from those receiving xylan only, probably due to the cooperation between xylan and Cap and the optimized delivery effect in vivo by this nano-system.”
§ Combining gut microbiota modulation and chemotherapy by capecitabine-loaded prebiotic nanoparticle improves colorectal cancer therapy > Discussion
hedgedconditional- Asserted: passes — The authors put it forward as true.
- Checkable: passes — It can be checked against evidence.
- Load-bearing: passes — The paper’s conclusions depend on it.
- Based: passes — The paper gives a reason why it holds.
It may state two separate claims as one.
What the paper did — it cites no source for this, so there is none to check. The quote shows it is in the paper.
In the paper
“and the analyses were based on objectively measurable data.”
§ Combining gut microbiota modulation and chemotherapy by capecitabine-loaded prebiotic nanoparticle improves colorectal cancer therapy > Methods > Statistics and reproducibility
plain- Asserted: passes — The authors put it forward as true.
- Checkable: passes — It can be checked against evidence.
- Load-bearing: fails — The paper’s conclusions may not depend on it.
- Based: passes — The paper gives a reason why it holds.
Probably not a substantial claim. The paper’s conclusions may not depend on it.
A conclusion the paper draws from its own results — it cites no other source for it, so there is none to check. The quote shows it is in the paper.
In the paper
“Our results suggest that nanotechnology can aid in the development of more precise and controllable prebiotic-based delivery systems to treat different cancer types.”
§ Combining gut microbiota modulation and chemotherapy by capecitabine-loaded prebiotic nanoparticle improves colorectal cancer therapy > Discussion
hedgedconditional- Asserted: passes — The authors put it forward as true.
- Checkable: passes — It can be checked against evidence.
- Load-bearing: passes — The paper’s conclusions depend on it.
- Based: passes — The paper gives a reason why it holds.
Probably not a substantial claim.
- Rests on an assumption: The mouse CRC models used in this study are predictive of human CRC therapy outcomes.
In the paper
“Xylan is a well-known prebiotic, whose health-promoting functions have been validated and linked with its effect of increasing the abundance or activity of probiotics55.”
§ Combining gut microbiota modulation and chemotherapy by capecitabine-loaded prebiotic nanoparticle improves colorectal cancer therapy > Discussion
What the sources say
- Not checked — no full text of the sourcecites [55] Zhao, S. N., Dien, B. S., Lindemann, S. R. & Chen, M. H. Controlling autohydrolysis conditions to produce xylan-derived fibers that modulate gut microbiota responses and metabolic outputs. Carbohyd Polym. 271, 118418 (2021). source
boostedcorrelational- Asserted: passes — The authors put it forward as true.
- Checkable: passes — It can be checked against evidence.
- Load-bearing: fails — The paper’s conclusions may not depend on it.
- Based: passes — The paper gives a reason why it holds.
Probably not a substantial claim. The paper’s conclusions may not depend on it. It may state two separate claims as one.
A conclusion the paper draws from its own results — it cites no other source for it, so there is none to check. The quote shows it is in the paper.
In the paper
“the increase in body weights caused by ascites of the SCXN group was not as dramatic as that in the other groups, which revealed that SCXN could delay tumor progression”
§ Combining gut microbiota modulation and chemotherapy by capecitabine-loaded prebiotic nanoparticle improves colorectal cancer therapy > Results > SCXN enhances the in vivo anti-tumor effects
hedgeddirect- Asserted: passes — The authors put it forward as true.
- Checkable: passes — It can be checked against evidence.
- Load-bearing: passes — The paper’s conclusions depend on it.
- Based: passes — The paper gives a reason why it holds.
It may state two separate claims as one.
The paper relies on this without support.
Prebiotic delivery into the gut is a more controllable method for gut microbiota modulatory therapy than traditional intervention.
“Compared with traditional intervention, prebiotics delivery into the gut is a more controllable method for gut microbiota modulatory therapy.”
The paper relies on this without support.
Capecitabine lacks a carrier that can prolong its half-life.
“Capecitabine (Cap), the first-line chemotherapeutic agent for CRC, lacks a carrier that can prolong its half-life.”
The paper relies on this without support.
Large-scale application of FMT is limited by the lack of management standards and risk of serious infection.
“However, large-scale application of FMT is limited by the lack of management standards and risk of serious infection.”
The paper relies on this without support.
The specific prebiotic role of xylan in treating cancer remains unknown.
“The specific prebiotic role of xylan in treating cancer remains unknown.”
The paper relies on this without support.
The negative charge of SCXN is beneficial to avoid clearance by the monocyte-phagocyte system.
“This charge was beneficial to avoid the clearance by the monocyte-phagocyte system.”
The paper relies on this without support.
The mouse CRC models used in this study are predictive of human CRC therapy outcomes.
“In conclusion, we demonstrated the potential of the combination of gut microbiota modulation and chemotherapy in CRC therapy via a single drug delivery system using prebiotics.”
The paper relies on this without support.
The gut microbiota of mice is representative of human gut microbiota for the purpose of xylan metabolism and CRC therapy.
“The reason might be that the SCFA-producing probiotics, which can degrade xylan, represented by Lactobacillus and Bifidobacterium56, had a much lower abundance in the intestines of colon tumor-bearing mice than that in the normal ones.”
Self-check
Percentages, sums and reported differences re-computed from the paper’s own numbers.
Each contradiction between two passages listed here was confirmed by an independent check.
Rated minor: it would not touch a result — a value no result rests on, a p-value that stays on the same side of the significance level, or a conflict that is clerical, resolved elsewhere in the paper, or outside its own findings.
In the paper
§ Combining gut microbiota modulation and chemotherapy by capecitabine-loaded prebiotic nanoparticle improves colorectal cancer therapy > Abstract
“Compared with free Cap, SCXN enhances the anti-tumor immunity and increases the tumor inhibition rate from 5.29 to 71.78%.”
§ Combining gut microbiota modulation and chemotherapy by capecitabine-loaded prebiotic nanoparticle improves colorectal cancer therapy > Results > SCXN enhances the in vivo anti-tumor effects
“The tumor inhibition rates (TIR) of Cap and Scap alone were only 8.24 and 5.29%, respectively”
Citations
Cites
Sung, H., Ferlay, J., Siegel, R. L., Laversanne, M., Soerjomataram, I., Jemal, A., & Bray, F. (2021) · CA: A Cancer Journal for Clinicians · doi:10.3322/caac.21660 · Cited by 108,699
Gut microbiome influences efficacy of PD-1-based immunotherapy against epithelial tumors
Routy, B., Le Chatelier, E., Derosa, L., Duong, C. P. M., Alou, M. T., Daillère, R., Fluckiger, A., Messaoudene, M., Rauber, C., Roberti, M. P., et al. (2018) · Science · doi:10.1126/science.aan3706 · Cited by 5,671
The Microbial Metabolites, Short-Chain Fatty Acids, Regulate Colonic T reg Cell Homeostasis
Smith, P. M., Howitt, M. R., Panikov, N., Michaud, M., Gallini, C. A., Bohlooly-Y, M., Glickman, J. N., & Garrett, W. S. (2013) · Science · doi:10.1126/science.1241165 · Cited by 5,413
Colorectal cancer statistics, 2020
Siegel, R. L., Miller, K. D., Sauer, A. G., Fedewa, S. A., Butterly, L. F., Anderson, J. C., Cercek, A., Smith, R. A., & Jemal, A. (2020) · CA A Cancer Journal for Clinicians · doi:10.3322/caac.21601 · Cited by 5,080
Commensal Bifidobacterium promotes antitumor immunity and facilitates anti–PD-L1 efficacy
Sivan, A., Corrales, L., Hubert, N., Williams, J. B., Aquino-Michaels, K., Earley, Z. M., Benyamin, F. W., Man Lei, Y., Jabri, B., Alegre, M.-L., et al. (2015) · Science · doi:10.1126/science.aac4255 · Cited by 3,888
The commensal microbiome is associated with anti-PD-1 efficacy in metastatic melanoma patients
Matson, V., Fessler, J., Bao, R., Chongsuwat, T., Zha, Y., Alegre, M.-L., Luke, J. J., & Gajewski, T. F. (2018) · Science · doi:10.1126/science.aao3290 · Cited by 3,107
Commensal Bacteria Control Cancer Response to Therapy by Modulating the Tumor Microenvironment
Iida, N., Dzutsev, A., Stewart, C. A., Smith, L., Bouladoux, N., Weingarten, R. A., Molina, D. A., Salcedo, R., Back, T., Cramer, S., et al. (2013) · Science · doi:10.1126/science.1240527 · Cited by 2,251
The microbiology of butyrate formation in the human colon
Pryde, S. E., Duncan, S. H., Hold, G. L., Stewart, C. S., & Flint, H. J. (2002) · FEMS Microbiology Letters · doi:10.1111/j.1574-6968.2002.tb11467.x · Cited by 1,320
Yang, W., Yu, T., Huang, X., Bilotta, A. J., Xu, L., Lu, Y., Sun, J., Pan, F., Zhou, J., Zhang, W., et al. (2020) · Nature Communications · doi:10.1038/s41467-020-18262-6 · Cited by 1,108
Self-citationInsights into the Role of Erysipelotrichaceae in the Human Host
Kaakoush, N. O. (2015) · Frontiers in Cellular and Infection Microbiology · doi:10.3389/fcimb.2015.00084 · Cited by 721
Cited by
Sorted by citations
Gut Microbiota Dysbiosis: Pathogenesis, Diseases, Prevention, and Therapy
Shen, Y., Fan, N., Ma, S., Cheng, X., Yang, X., & Wang, G. (2025) · MedComm · doi:10.1002/mco2.70168 · Cited by 404
Fan, Y., Ye, J., Kang, Y., Niu, G., Shi, J., Xue, Y., Li, R., Han, J., & Ji, X. (2024) · Science Advances · doi:10.1126/sciadv.adm9561 · Cited by 126
Li, L., He, S., Liao, B., Wang, M., Lin, H., Hu, B., Lan, X., Shu, Z., Zhang, C., Yu, M., et al. (2024) · Research · doi:10.34133/research.0364 · Cited by 79
Gut microbiota as a new target for anticancer therapy: from mechanism to means of regulation
Sun, J., Song, S., Liu, J., Chen, F., Li, X., & Wu, G. (2025) · npj Biofilms and Microbiomes · doi:10.1038/s41522-025-00678-x · Cited by 78
Bautista, J., Maceiras, M. L., Hidalgo‐Tinoco, C., Guerra-Guerrero, A., Betancourt-Velarde, A., & López‐Cortés, A. (2026) · npj Biofilms and Microbiomes · doi:10.1038/s41522-025-00883-8 · Cited by 74
Zu, M., Liu, G., Xu, H., Zhu, Z., Zhen, J., Li, B., Shi, X., Shahbazi, M., Reis, R. L., Kundu, S. C., et al. (2024) · Advanced Materials · doi:10.1002/adma.202409138 · Cited by 63
Novel strategies for modulating the gut microbiome for cancer therapy
Cho, Y. S., Han, K., Xu, J., & Moon, J. J. (2024) · Advanced Drug Delivery Reviews · doi:10.1016/j.addr.2024.115332 · Cited by 59
Obesity-Associated Colorectal Cancer
Gonzalez-Gutierrez, L., Motiño, O., Barriuso, D., de la Puente-Aldea, J., Alvarez-Frutos, L., Kroemer, G., Palacios, R., & Senovilla, L. (2024) · International Journal of Molecular Sciences · doi:10.3390/ijms25168836 · Cited by 55
Role of the gut microbiota in tumorigenesis and treatment
Liu, Q., Yang, Y., Pan, M., Yang, F., Yu, Y., & Qian, Z. (2024) · Theranostics · doi:10.7150/thno.91700 · Cited by 46
Long-term relapse-free survival enabled by integrating targeted antibacteria in antitumor treatment
Wang, Y., Han, Y., Yang, C., Bai, T., Zhang, C., Wang, Z., Sun, Y., Hu, Y., Besenbacher, F., Chen, C., et al. (2024) · Nature Communications · doi:10.1038/s41467-024-48662-x · Cited by 46
Engineered Microorganisms for Advancing Tumor Therapy
Jia, J., Wang, X., Lin, X., & Zhao, Y. (2024) · Advanced Materials · doi:10.1002/adma.202313389 · Cited by 45
Chen, C., Su, Q., Zi, M., Hua, X., & Zhang, Z. (2025) · npj Biofilms and Microbiomes · doi:10.1038/s41522-025-00818-3 · Cited by 45
The challenge and opportunity of gut microbiota‐targeted nanomedicine for colorectal cancer therapy
Wei, Y., Shen, F., Song, H., Zhao, R., Feng, W., Pan, Y., Li, X., Yu, H., Familiari, G., Relucenti, M., et al. (2024) · iMeta · doi:10.1002/imt2.213 · Cited by 42
Hadkar, V. M., Mohanty, C., & Selvaraj, C. I. (2024) · RSC Advances · doi:10.1039/d4ra03911d · Cited by 41
Xue, Y., Kang, Y., Li, R., Niu, G., Shi, J., Yang, Y., Fan, Y., Ye, J., Han, J., Pei, Z., et al. (2025) · Nature Communications · doi:10.1038/s41467-025-57672-2 · Cited by 38
Optimizing Cancer Treatment Through Gut Microbiome Modulation
Kim, K., Lee, M., Shin, Y., Lee, Y., & Kim, T. J. (2025) · Cancers · doi:10.3390/cancers17071252 · Cited by 37
Current Advances of Nanomaterial-Based Oral Drug Delivery for Colorectal Cancer Treatment
Wang, N., Chen, L., Huang, W., Gao, Z., & Jin, M. (2024) · Nanomaterials · doi:10.3390/nano14070557 · Cited by 36
Hu, J., Ran, S., Huang, Z., Liu, Y., Hu, H., Zhou, Y., Ding, X., Yin, J., & Zhang, Y. (2024) · Acta Biomaterialia · doi:10.1016/j.actbio.2024.06.042 · Cited by 33
Omics‐Enhanced Nanomedicine for Cancer Therapy
Qi, L., Li, Z., Liu, J., & Chen, X. S. (2024) · Advanced Materials · doi:10.1002/adma.202409102 · Cited by 33
Zhang, C., Wang, Y., Cheng, L., Cao, X., & Liu, C. (2025) · Frontiers in Oncology · doi:10.3389/fonc.2025.1557959 · Cited by 33
Li, H., Shen, N., Ren, J., Yang, S., Chen, Y., & Gao, Z. (2024) · Food Chemistry · doi:10.1016/j.foodchem.2024.140462 · Cited by 32
Moon, J. H., Phoo, M. T., Kim, Y., Ahn, J., Kim, A., Nam, J., Lee, S., Moon, J. J., & Son, S. (2025) · Advanced Science · doi:10.1002/advs.202509022 · Cited by 32
Niu, L., Liu, Y., Li, N., Wang, Y., Kang, L., Su, X., Xu, C., Sun, Z., Sang, W., Xu, J., et al. (2024) · International Journal of Pharmaceutics · doi:10.1016/j.ijpharm.2024.123810 · Cited by 30
Zhang, Y., Li, W., Chen, S., Zhang, Y., Zhu, Y., Lan, F., Du, H., Fan, R., Zhu, J., Pan, W., et al. (2025) · ACS Nano · doi:10.1021/acsnano.5c01747 · Cited by 29
Ramesh, A., Srinivasan, D., Subbarayan, R., Chauhan, A., Krishnamoorthy, L., Kumar, J., Krishnan, M., & Shrestha, R. (2025) · Molecular Nutrition & Food Research · doi:10.1002/mnfr.70023 · Cited by 27
Sun, X., Shan, X., Zhu, B., Cai, Y., He, Z., Zhou, L., Yin, L., Liu, Y., Liu, K., Zhang, T., et al. (2024) · Advanced Healthcare Materials · doi:10.1002/adhm.202403587 · Cited by 25
Self-citationGut microbiota as a hidden modulator of chemotherapy: implications for colorectal cancer treatment
Sadeghloo, Z., & Sadeghi, A. (2025) · Discover Oncology · doi:10.1007/s12672-025-03574-0 · Cited by 24
Han, Q., Li, J., Li, Z. Y., Aishajiang, R., & Yu, D. N. (2025) · Materials Today Bio · doi:10.1016/j.mtbio.2025.101601 · Cited by 23
Innovative nanocarriers: Synthetic and biomimetic strategies for enhanced drug delivery
Guo, R., Zhang, Z., Zhang, S. H., Gai, T., Yu, H., Su, L., Yin, H., Wang, X., & Zhang, Y. (2025) · Materials Today Bio · doi:10.1016/j.mtbio.2025.102180 · Cited by 23
Kenneth, M. J., Wu, C.-C., Fang, C., Hsu, T.-K., Lin, I., Huang, S.-W., Chiu, Y., & Hsu, B. (2025) · Antibiotics · doi:10.3390/antibiotics14030264 · Cited by 20
Research progress and future prospects in glucose oxidase-like activity of Au NPs
Hou, X.-T., Xie, T., Han, M.-Y., Topatana, W., Juengpanich, S., Li, S., Fang, K.-Y., Chen, H., Xu, Z.-Y., Wang, J., et al. (2024) · Materials & Design · doi:10.1016/j.matdes.2024.112780 · Cited by 20
Ma, Y., Tu, Y., Chen, Y., Chen, X., Pan, X., Sun, M., Fu, X., Zou, J., & Gao, F. (2024) · ACS Applied Materials & Interfaces · doi:10.1021/acsami.4c17782 · Cited by 19
A critical need for ‘gut neutrality’: mitigating adverse drug–microbiome interactions
Kamath, S., & Joyce, P. (2024) · Expert Opinion on Drug Metabolism & Toxicology · doi:10.1080/17425255.2024.2407616 · Cited by 19
Dameshghian, M., Tafvizi, F., Ebrahimi, M. T., & Doust, R. H. (2024) · Probiotics and Antimicrobial Proteins · doi:10.1007/s12602-024-10288-2 · Cited by 17
Microbial Therapeutics in Oncology: A Comprehensive Review of Bacterial Role in Cancer Treatment
Kunjalwar, R., Keerti, A., Chaudhari, A., Sahoo, K., & Meshram, S. (2024) · Cureus · doi:10.7759/cureus.70920 · Cited by 16
Copper-Based Targeted Nanocatalytic Therapeutics for Non-Small Cell Lung Cancer
Fan, Y., Chang, J., Qin, X., Li, M., Li, Y. S., Wu, L., Li, K., Chen, Z., Li, Y., Tang, Z., et al. (2026) · Nano-Micro Letters · doi:10.1007/s40820-025-01998-5 · Cited by 14
Self-citationRecent Progress of Oral Functional Nanomaterials for Intestinal Microbiota Regulation
Li, W., Zhan, M., Wen, Y., Chen, Y., Zhang, Z., Wang, S., Tian, D., & Tian, S. (2024) · Pharmaceutics · doi:10.3390/pharmaceutics16070921 · Cited by 14
Ilie, C.-I., Spoială, A., Chircov, C., Dolete, G., Oprea, O., Vasile, B. Ş., Crainiceanu, S. A., Nicoară, A. I., Marinaș, I. C., Stan, M. S., et al. (2024) · Antioxidants · doi:10.3390/antiox13080895 · Cited by 14
Zamanian, M. Y., Taheri, N., Ramadan, M. F., Mustafa, Y. F., Alkhayyat, S., Sergeevna, K. N., Alsaab, H. O., Hjazi, A. M., Vasei, F. M., & Daneshvar, S. (2024) · Animal Models and Experimental Medicine · doi:10.1002/ame2.12476 · Cited by 14
Advances in polysaccharide-based probiotic delivery systems: A review
Cheng, J., Li, X., Ke, T., Gong, J., Jiang, T., & Chen, L. (2025) · Carbohydrate Polymer Technologies and Applications · doi:10.1016/j.carpta.2025.100804 · Cited by 14
Shi, J., Shen, H., Huang, H., Zhan, L., Chen, W., Zhou, Z., Lv, Y., Xiong, K., Jiang, Z., Chen, Q., et al. (2024) · Frontiers in Microbiology · doi:10.3389/fmicb.2024.1395514 · Cited by 13
Opioid Use and Gut Dysbiosis in Cancer Pain Patients
Coluzzi, F., Scerpa, M. S., Loffredo, C., Borro, M., Pergolizzi, J. V., LeQuang, J. A., Alessandri, E., Simmaco, M., & Rocco, M. (2024) · International Journal of Molecular Sciences · doi:10.3390/ijms25147999 · Cited by 13
Qiu, J., Jiang, Y., Ye, N., Jin, G., Shi, H., & Qian, D. (2024) · Journal of Translational Medicine · doi:10.1186/s12967-024-05531-x · Cited by 13
Colorectal cancer and inulin supplementation: the good, the bad, and the unhelpful
Oliero, M., Alaoui, A. A., McCartney, C., & Santos, M. M. (2023) · Gastroenterology report · doi:10.1093/gastro/goae058 · Cited by 12
Exploring the role of gut microbiota in colorectal liver metastasis through the gut-liver axis
Liu, Q.-L., Zhou, H., Wang, Z., & Chen, Y. (2025) · Frontiers in Cell and Developmental Biology · doi:10.3389/fcell.2025.1563184 · Cited by 12
Gut bacteria, host immunity, and colorectal cancer: From pathogenesis to therapy
Li, Y., Peng, J., & Meng, X. (2024) · European Journal of Immunology · doi:10.1002/eji.202451022 · Cited by 11
Self-citationApplication of Nanoparticles in the Diagnosis and Treatment of Colorectal Cancer
Song, Q., Zheng, Y., Zhong, G., Wang, S., He, C., & Li, M. (2024) · Anti-Cancer Agents in Medicinal Chemistry · doi:10.2174/0118715206323900240807110122 · Cited by 11
Guo, S., Qiao, X., Ding, L., Liu, J., Xu, Y., Cao, J., Tian, W., Ma, D., Zhang, X., & Tian, B. (2025) · Materials Today Bio · doi:10.1016/j.mtbio.2025.102151 · Cited by 11
Abd‐El‐Aziz, A., Li, J., Fouda, M. M. G., Sharaby, C. M., Zhang, X., Ma, N., Agathos, S. N., & Abd‐El‐Aziz, A. S. (2024) · Applied Materials Today · doi:10.1016/j.apmt.2024.102335 · Cited by 11
The interactions between gut microbiota and Chinese herbal medicine in colorectal cancer
Hou, X., Li, X., Chen, W., Zhu, W., Guo, H., & Zhao, L. (2025) · Acupuncture and Herbal Medicine · doi:10.1097/hm9.0000000000000153 · Cited by 10
Advances in Nanomedicine-Mediated Modulation of the Microbiome for Cancer Therapy
Huang, Y., Zhang, Z., Xue, L., Zhang, X., & He, C. (2025) · International Journal of Nanomedicine · doi:10.2147/ijn.s558099 · Cited by 10
Gut microbiome and colorectal cancer: From pathogenesis to treatment
Lahouty, M., Fadaee, M., Aghaei, R., Alizadeh, F., Jafari, A., & Sharifi, Y. (2025) · Pathology - Research and Practice · doi:10.1016/j.prp.2025.156034 · Cited by 10
Mi, S., Shen, M., Liu, Z., Yu, Y., Shan, H., Cao, J., McClements, D. J., Cao, C., Xu, X., & Yuan, B. (2024) · Food & Function · doi:10.1039/d4fo04355c · Cited by 9
Re, F., Pelucchi, S., Pettini, F., Prantera, A., Troisi, F., Mahmoud, R. M. A., Giovannoni, R., & Barisani, D. (2025) · Nanomedicine · doi:10.1080/17435889.2025.2520157 · Cited by 9
Rational bioengineering of polysaccharide in designing of microbiome modulation
Moon, J. H., Kim, K. H., Kim, Y., & Son, S. (2025) · Trends in biotechnology · doi:10.1016/j.tibtech.2025.08.014 · Cited by 9
Advanced oral therapies for colorectal cancer via nanomedicine and microbiota modulation
Wang, Y., Chen, C., Xiao, X. H., Kang, Y., He, J., Beloqui, A., & Xu, Y. (2025) · Advanced Drug Delivery Reviews · doi:10.1016/j.addr.2025.115741 · Cited by 9
Design Principles of Oral Nanomedicines to Overcome the Delivery Barriers
Yang, K., Li, B., Jiang, A., Shi, X., Nie, G., & Xiao, B. (2026) · ACS Nano · doi:10.1021/acsnano.5c14045 · Cited by 8
Zhang, H., Zhang, X., Ma, X., & Wang, X. (2024) · Pharmacological Reports · doi:10.1007/s43440-024-00684-4 · Cited by 8
Tian, Y., Chang, B., Zong, Z., Wang, J., Lu, X., Li, Y., Zheng, Q., Wei, R., Shen, Y., & Chen, Y.-G. (2025) · Carbohydrate Polymers · doi:10.1016/j.carbpol.2025.123918 · Cited by 7
Self-citationWang, F., Fan, J., Pan, W., Liu, M., Wang, J., Wei, X., Xian, Y., Chen, S., Cui, C., Chen, Y., et al. (2025) · Bioactive Materials · doi:10.1016/j.bioactmat.2025.10.012 · Cited by 7
Alavinia, S., Ghorbani‐Vaghei, R., Haddadi, R., Sanemar, K., Uroomiye, S. S., & Nourian, A. (2025) · Carbohydrate Polymer Technologies and Applications · doi:10.1016/j.carpta.2025.100827 · Cited by 7
Oral anticancer drug delivery: Strategies for improving bioavailability
Umutoni, S., Zhang, H., Guo, J., Yu, Z., Shao, H., Yi, X., Sun, C., Luo, L., & Yu, Y. (2026) · Chinese Chemical Letters · doi:10.1016/j.cclet.2026.112362 · Cited by 6
Hao, X., Li, Y., Zhou, H., Lin, J., Xu, M., Li, L., Fan, C., Huang, J., He, L., Bai, X., et al. (2026) · Advanced Materials · doi:10.1002/adma.72981 · Cited by 6
Self-citationNanomedicine for colorectal cancer therapy by remodeling the immune microenvironment
Wu, Y., Su, Y., Wei, Y., Shui, M., Li, W., Yang, L., & Luo, K. (2026) · Journal of Controlled Release · doi:10.1016/j.jconrel.2026.114915 · Cited by 6
Regulating gut microbiota with nanomaterials for cancer immunotherapy
Sha, T., Tang, Y., Hu, X., Zhou, H., & Rao, L. (2025) · Interdisciplinary medicine · doi:10.1002/inmd.20240103 · Cited by 6
Xie, Y., He, P., Li, X., Zhang, L., Yu, Y., & Fen, C. (2025) · Journal of Controlled Release · doi:10.1016/j.jconrel.2025.114078 · Cited by 6
Kong, D., Wang, Z.-L., Wang, H., Yang, R., Zhang, W., Cao, L., Nian, Y., Ren, J., Lu, J., Chen, T., et al. (2024) · International Immunopharmacology · doi:10.1016/j.intimp.2024.112955 · Cited by 6
Oral microbiota in colorectal cancer: Unraveling mechanisms and application potential
Zhang, X., Chen, Y., Xia, Y., Lin, S., Zhou, X., Pang, X., Yu, J., & Sun, L. (2025) · Life Sciences · doi:10.1016/j.lfs.2025.123462 · Cited by 5
Recent advances in gut microbiota-based nanotherapies for cancer treatment
Xu, Y., Zhu, M., Zhao, Y., Chai, E., Wu, M., & Zhang, M. (2025) · Frontiers in Pharmacology · doi:10.3389/fphar.2025.1617942 · Cited by 5
Rehman, M. K. U., Batool, S., Woo, S., Alamri, A. H., Fatease, A. M. A., Asiri, Z. A., Alruwaili, N. K., Rehman, M. U., & Din, F. U. (2025) · Scientific Reports · doi:10.1038/s41598-025-32089-5 · Cited by 5
The gut microbiota and colorectal cancer: Molecular insights and translational implications
Chen, J., Du, X., Shao, M., Sun, Y., Shi, X., & He, S. (2025) · Clinical Surgical Oncology · doi:10.1016/j.cson.2025.100107 · Cited by 4
Li, Z., Jiang, J., Zhou, Y., Mao, X., Wen, H., Chen, Z., Wang, Y., Huang, C., & Hu, Y. (2026) · Advanced Science · doi:10.1002/advs.202514318 · Cited by 4
Yang, Q., Shi, X., Yang, K., Gao, Q., Cao, Y., Huang, Y., Chen, L., Bao, S., Xu, L., Reis, R. L., et al. (2026) · Biomaterials · doi:10.1016/j.biomaterials.2026.124085 · Cited by 4
Microbiota-targeted nanoplatforms for colorectal cancer immunotherapy
Li, S.-Q., Wang, J.-N., Zhao, S.-N., Feng, G., & Sun, Y.-D. (2026) · Pharmacological Research · doi:10.1016/j.phrs.2026.108219 · Cited by 4
Böhm, D. T. M. M., Guchelaar, H., Smidt, M. L., & Deenen, M. J. (2026) · Probiotics and Antimicrobial Proteins · doi:10.1007/s12602-026-11024-8 · Cited by 4
Sun, X., Gong, Y., Xie, T., Fu, Z., Lu, D., Wei, B., Cai, Y., Yao, W., & Shen, J. (2024) · Macromolecular Bioscience · doi:10.1002/mabi.202400478 · Cited by 4
A Pathophysiology‐Informed, Negentropy‐Oriented Strategy for Nanomedicine in MASLD
Mao, R., Yu, M., Guo, X., Tian, X.-Q., Zhao, M., Yu, Q., Ren, G., Pan, M., Bai, R., Liu, L., et al. (2025) · Advanced Healthcare Materials · doi:10.1002/adhm.202504298 · Cited by 4
Rosis, S. D., Monaco, G., Hu, J. K., Hett, E., Lappano, R., Marincola, F. M., Asadi, A., & Maggiolini, M. (2025) · Journal of Translational Medicine · doi:10.1186/s12967-025-06839-y · Cited by 4
Liu, J., Hu, X., Yu, G., Wang, Q., Gu, L., Shen, J., Zhao, Q., Sun, H., Wang, S., Guo, Z., et al. (2024) · Biochemical Pharmacology · doi:10.1016/j.bcp.2024.116220 · Cited by 3
Gut microbiota and chemoradiotherapy response in rectal cancer: Biomarker opportunities
Taoum, C., Devaux, A., Rouanet, P., Colombo, P., Boucher, D., & Bonnet, M. (2025) · Critical Reviews in Oncology/Hematology · doi:10.1016/j.critrevonc.2025.104974 · Cited by 3
Wang, L., Wu, Q., Zhang, M., Ni, Z., Zhang, P., Bai, S., Wang, Y., & Sun, Z. (2025) · Food Bioengineering · doi:10.1002/fbe2.70027 · Cited by 3
Verna, G., Santis, S. D., Islam, B. N., Sommella, E., Licastro, D., Zhang, L., Celio, F. D. A., Miller, E. N., Merciai, F., Caponigro, V., et al. (2025) · Journal of Clinical Investigation · doi:10.1172/jci196712 · Cited by 3
Nanotechnology – Microbiota synergy in cancer immunotherapy
Yang, J., Wang, J., Li, J., & Cui, J. (2025) · Critical Reviews in Oncology/Hematology · doi:10.1016/j.critrevonc.2025.105018 · Cited by 3
Zhao, Y., Zhao, Y., Shi, J., Guan, B., Long, M., Sun, Z., Jin, S., Yan, Y., Chang, T., Fu, Y., et al. (2025) · Frontiers in Microbiology · doi:10.3389/fmicb.2025.1712240 · Cited by 3
Xu, M., Qin, X., Zhen, H., & Tan, C. (2026) · Food Bioscience · doi:10.1016/j.fbio.2026.108392 · Cited by 3
Li, X. Y., Wang, Q., Yuan, Q., & Wang, L. (2026) · Frontiers in Immunology · doi:10.3389/fimmu.2026.1795736 · Cited by 3
Chen, J., Wang, Y., Xu, L., Li, X., & Zhao, L. (2026) · Gut Microbes · doi:10.1080/19490976.2026.2638009 · Cited by 3
Chen, M., Zhao, F., Wang, X., Zhang, H., Yang, R., Liu, Y., Si, Z., Fang, H., Cheng, Z., Zhao, L., et al. (2025) · International Journal of Biological Macromolecules · doi:10.1016/j.ijbiomac.2025.148581 · Cited by 2
Sadek, S. A., Hoseny, S. S., Fahmy, A. M., Ali, S. B., Kotb, M. A., Soliman, A. M., & Fahmy, S. R. (2025) · Medical Oncology · doi:10.1007/s12032-025-03123-3 · Cited by 2
Intratumoral microbiota in colorectal cancer: roles, therapeutic potential, and challenges
Zhang, X., Qi, J., Dong, C., Zhang, L., Chen, J., Li, M., Jiang, T., & Song, J. (2025) · Journal of Advanced Research · doi:10.1016/j.jare.2025.11.067 · Cited by 2
Recent Research on the Role of Lactobacilli Probiotics in Cancer Management
Park, S. (2026) · Nutrients · doi:10.3390/nu18020297 · Cited by 2
Zhu, Q., Li, H., Lu, W., Su, D., Ding, L., Ouyang, J., Fang, W., Wang, T., Chen, S., Liu, X., et al. (2026) · International Journal of Pharmaceutics X · doi:10.1016/j.ijpx.2026.100517 · Cited by 2
Nanoparticles for colorectal cancer therapy: A review
Yang, C.-W., Fang, H.-M., Gong, X.-Y., Wang, J., & Zou, T. (2026) · Biomaterials Advances · doi:10.1016/j.bioadv.2026.214926 · Cited by 2
Decoding the microbiome-immune crosstalk in cancer: from mechanisms to therapeutic translation
Zhao, N., Wu, L., Peng, S., Yang, H., 宋永春, Zhang, Y., & Ding, L. (2026) · Biomarker Research · doi:10.1186/s40364-026-00930-2 · Cited by 2
Fusobacterium nucleatum in cancer: from bystander to driver
Zhong, Z.-W., Lu, Y.-Q., Duan, Y., Ma, J. Y., & Liu, N. (2026) · Gut · doi:10.1136/gutjnl-2025-338000 · Cited by 2
Mazumder, S., Bhattacharya, D., Lahiri, D., Nag, M., Maity, S., Debpriya, S., Kumar, N., Singh, V., Sharma, S., Dwivedi, S. P., et al. (2026) · Food Research International · doi:10.1016/j.foodres.2026.119629 · Cited by 2
Yang, M., Zhu, Y., Li, Q., Deng, Z., Xu, C., Wei, X., Ma, Y., Ding, C., Zhang, M., Ma, S., et al. (2026) · Acta Pharmaceutica Sinica B · doi:10.1016/j.apsb.2026.06.032 · Cited by 2
Global research trends on nanotechnology and colorectal cancer: a two-decade analysis
Mao, X., Li, X., Liu, S., Dong, H., Jia, W., Xu, W., Wu, X., & Zhang, Y. (2025) · Nanomedicine · doi:10.1080/17435889.2025.2452833 · Cited by 2
Recent advances in novel targeting mechanisms for colorectal cancer
Li, Z., Wang, H., Liu, Y., Gemingnuer, A., Wang, Y., & Meng, X. (2025) · Clinical & Translational Oncology · doi:10.1007/s12094-025-03990-2 · Cited by 2
Zhang, Y., Chen, Y., Lv, H., Wang, H., Wang, J., Lv, X., & Zhang, M. (2025) · International Immunopharmacology · doi:10.1016/j.intimp.2025.115044 · Cited by 1
Metadata
- Authors
- Lang, T., Zhu, R., Zhu, X., Yan, W., Li, Y., Zhai, Y., Wu, T., Huang, X., Yin, Q., & Li, Y.
- Affiliations
- Chinese Academy of Sciences (CN)
- Nanjing University of Chinese Medicine (CN)
- Nanjing Medical University (CN)
- Corresponding author
- Li, Yu
- Yin, Qi
- Li, Yaping
- Venue
- Nature Communications
- Published
- 2023-08-07
- Volume
- 14
- Issue
- 1
- Pages
- 4746-4746
- ISSN
- 2041-1723 (ISSN-L)
- PMC
- PMC10406894
- OpenAlex
- W4385638731
- Cited by
- 133
- References
- 56
- Citations by year
- 2026: 47 · 2025: 48 · 2024: 37 · 2023: 1
- FWCI
- 7.62
- Type
- journal article
- Language
- en
- Open access
- gold
- doi.org
- Locations
- Nature Communications (publishedVersion, cc-by)
- PubMed Central (publishedVersion, cc-by)
- PubMed (publishedVersion)
- RePEc: Research Papers in Economics (submittedVersion)
- DOAJ (DOAJ: Directory of Open Access Journals) (submittedVersion, cc-by-sa)
- Funders
- National Natural Science Foundation of China (31930066, 32130058, 32171315)
- Natural Science Foundation of Shandong Province (ZR2019ZD25)
- Topics
- Physical Sciences › Materials Science › Biomaterials › Nanoparticle-Based Drug Delivery
- Life Sciences › Pharmacology, Toxicology and Pharmaceutics › Pharmaceutical Science › Advanced Drug Delivery Systems
- Life Sciences › Biochemistry, Genetics and Molecular Biology › Molecular Biology › Gut microbiota and health
- Keywords
- colorectal cancer, capecitabine, gut microbiota modulation, oral drug delivery, drug half-life extension, short-chain fatty acids, antitumor immunity
- MeSH terms
- Gastrointestinal Microbiome, Capecitabine, Animals, Colorectal Neoplasms, Mice, Nanoparticles, Prebiotics
About these checks
Registry, retraction, Cites and statistics results are computed, not judged, with one exception: a printed reference that no index lists is read once by a model before it counts as a citation error. Claims are extracted by a model and kept only when their quote appears verbatim in the text; each cited source is then checked, with a model’s help, for whether it says what the claim relies on. Those verdicts can be wrong — read the claim’s quote and the cited source before relying on one.
A language model drew the claims from the paper on 2026-11-10, under version 3 of the claim definition (model deepseek-v4.1-flash, prompt extract-v3).
A second model labelled each claim on 2026-11-10 (model jev-1.13-20260917, definition revision gold-guideline-v0.2).
Cited sources are checked with a language model’s help (gpt-6-sol).
Statistics and arithmetic are recomputed, not judged.
Confidence bands are shown only for fields calibrated on our annotated test set. None is calibrated yet, so no band is shown.
What counts as a claim ›How we measure confidence ›How we check this ›
Are you an author, or do you see a problem with this page? Request a review
