

The DOI matches its Crossref record; 79 of the 79 references it cites were found in a registry or an index.
Novel antigen-presenting cell imparts Treg-dependent tolerance to gut microbiota
Open accessPublished version of a preprint
Abstract
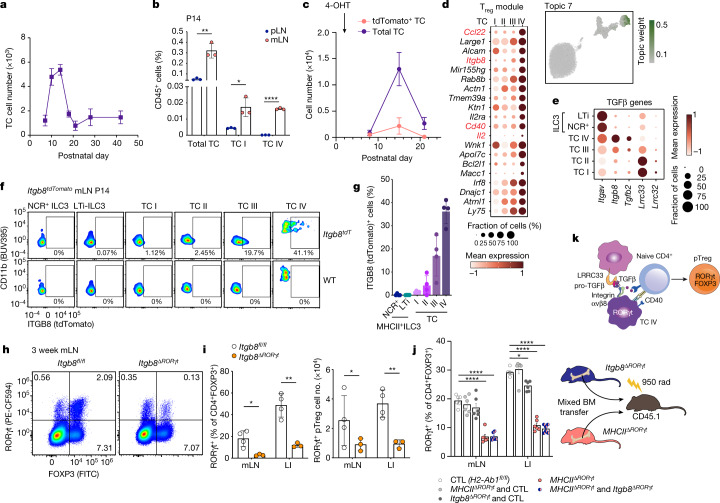
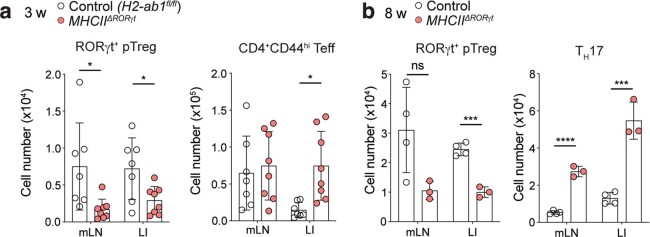
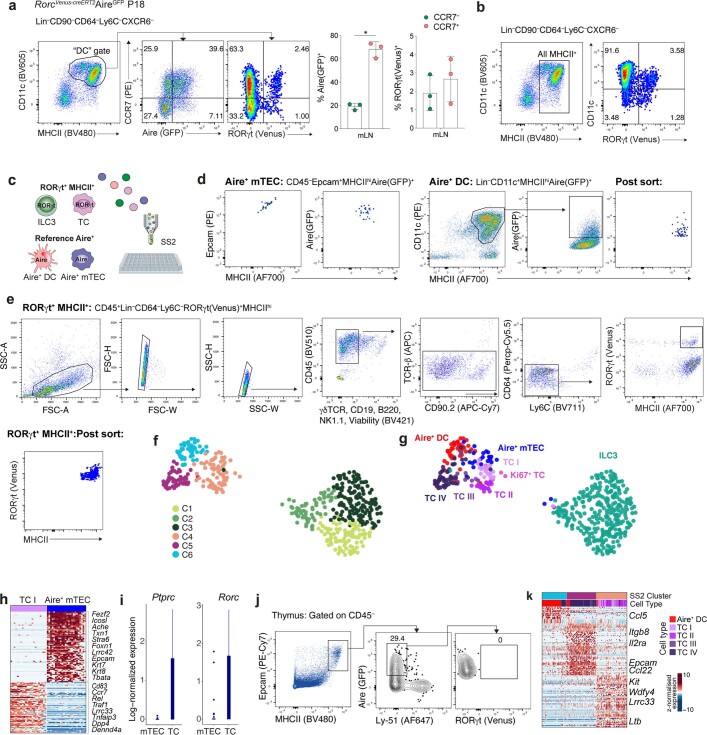
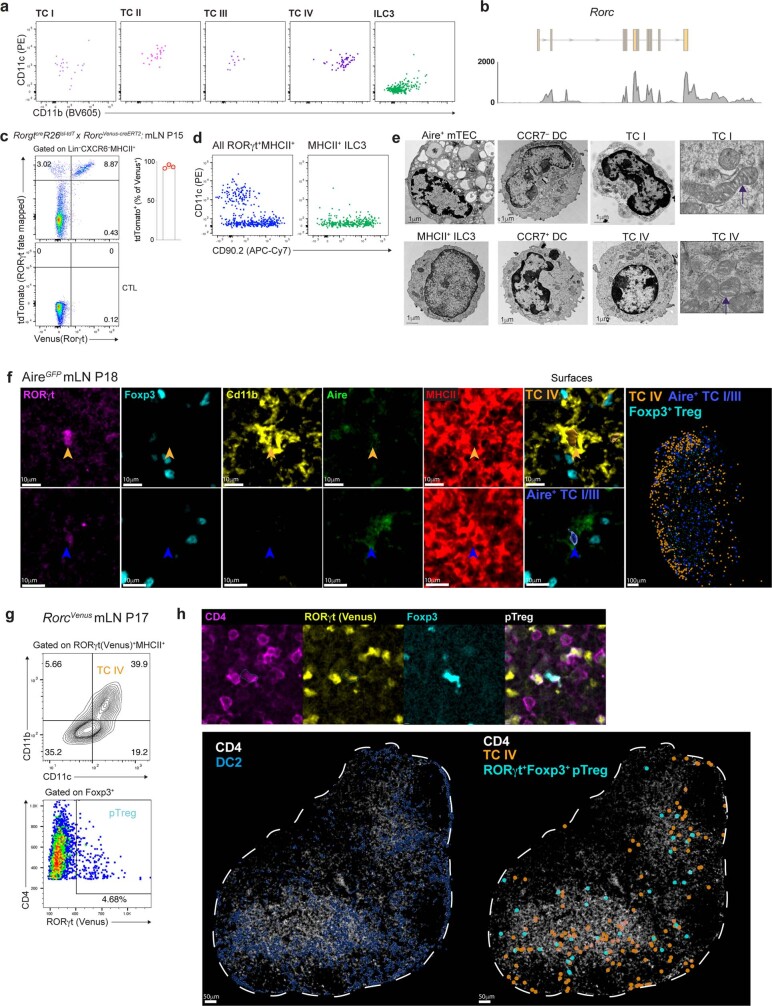
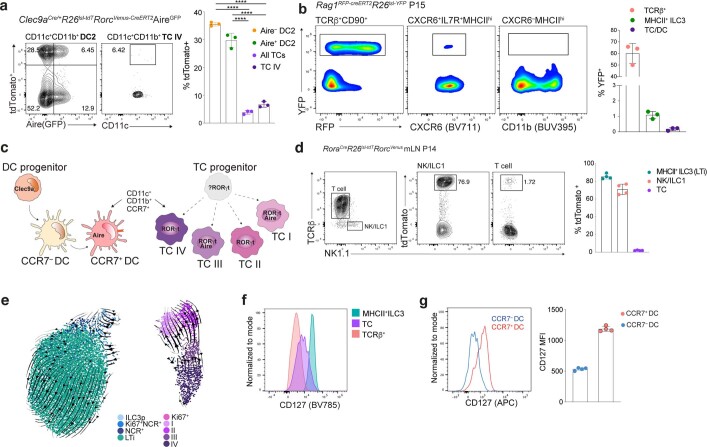
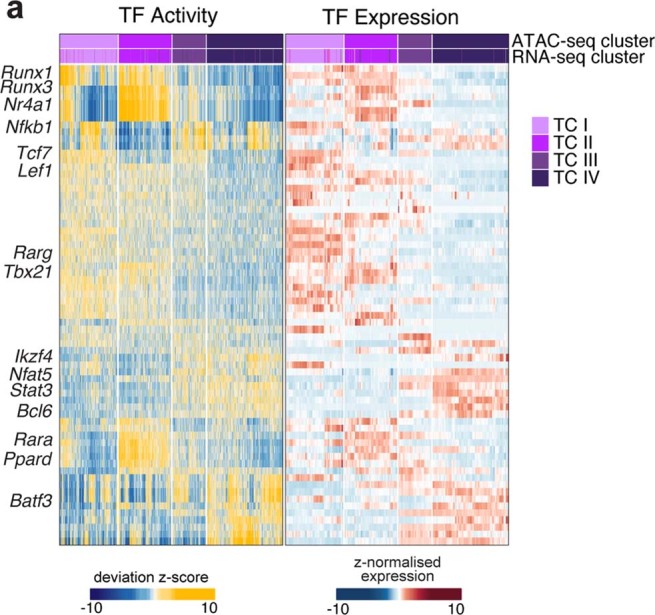
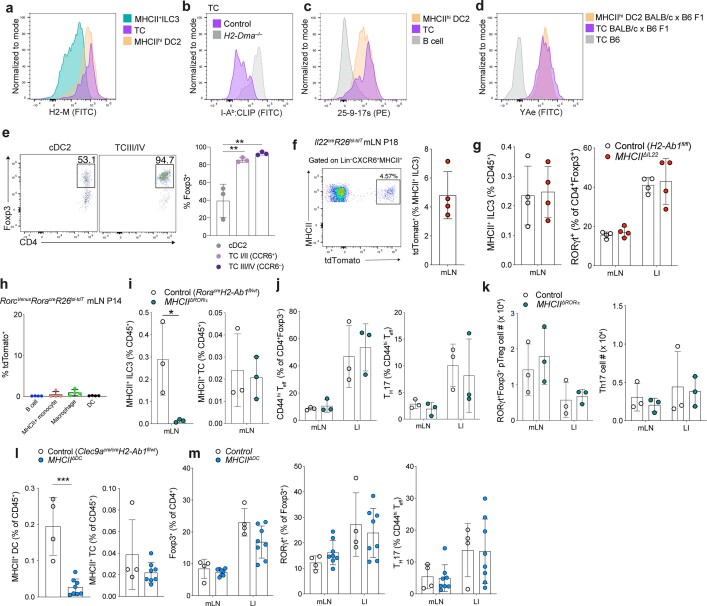
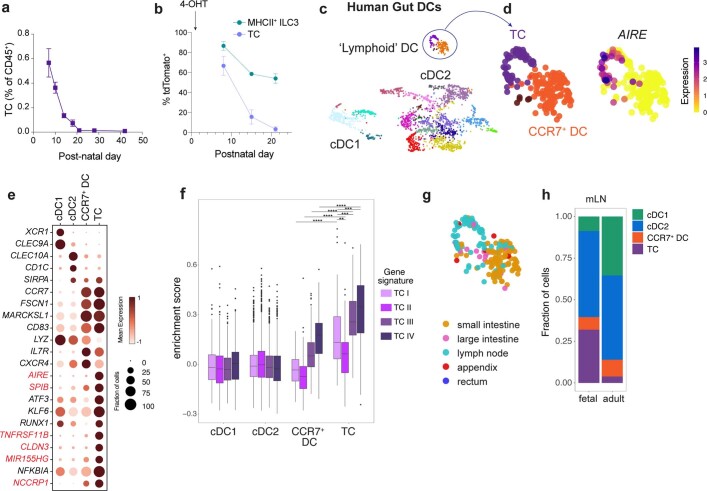
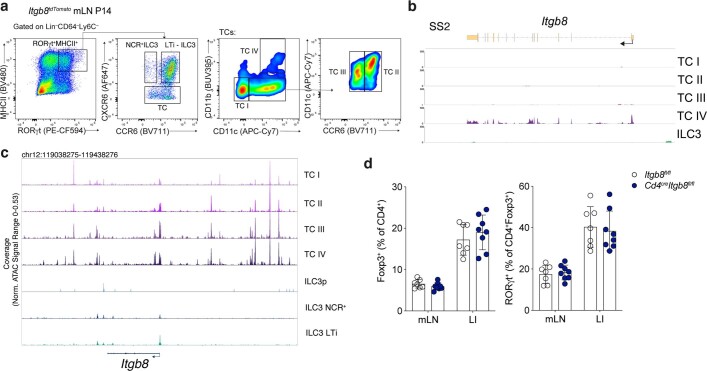
Establishing and maintaining tolerance to self-antigens or innocuous foreign antigens is vital for the preservation of organismal health. Within the thymus, medullary thymic epithelial cells (mTECs) expressing autoimmune regulator (AIRE) have a critical role in self-tolerance through deletion of autoreactive T cells and promotion of thymic regulatory T (T reg ) cell development 1–4 . Within weeks of birth, a separate wave of T reg cell differentiation occurs in the periphery upon exposure to antigens derived from the diet and commensal microbiota 5–8 , yet the cell types responsible for the generation of peripheral T reg (pT reg ) cells have not been identified. Here we describe the identification of a class of RORγt + antigen-presenting cells called Thetis cells, with transcriptional features of both mTECs and dendritic cells, comprising four major sub-groups (TC I–TC IV). We uncover a developmental wave of Thetis cells within intestinal lymph nodes during a critical window in early life, coinciding with the wave of pT reg cell differentiation. Whereas TC I and TC III expressed the signature mTEC nuclear factor AIRE, TC IV lacked AIRE expression and was enriched for molecules required for pT reg generation, including the TGF-β-activating integrin αvβ8. Loss of either major histocompatibility complex class II (MHCII) or ITGB8 by Thetis cells led to a profound impairment in intestinal pT reg differentiation, with ensuing colitis. By contrast, MHCII expression by RORγt + group 3 innate lymphoid cells (ILC3) and classical dendritic cells was neither sufficient nor required for pT reg generation, further implicating TC IV as the tolerogenic RORγt + antigen-presenting cell with an essential function in early life. Our studies reveal parallel pathways for the establishment of tolerance to self and foreign antigens in the thymus and periphery, respectively, marked by the involvement of shared cellular and transcriptional programmes.
Overview
The claims and statistics of this paper haven’t been checked yet.
Run the check — free, no account needed. It reads the open-access text and checks the sources it cites.
Integrity signals
Registry
Cites
Statistics
Figures
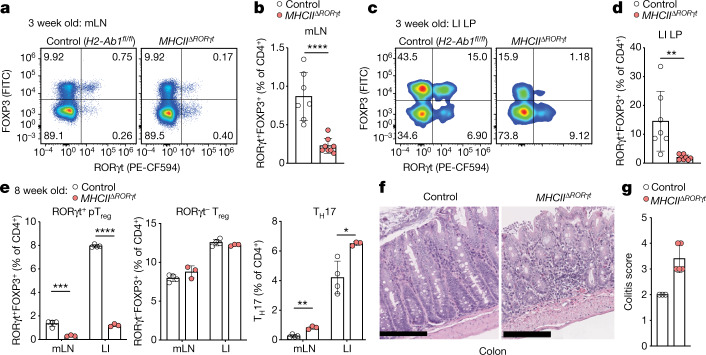
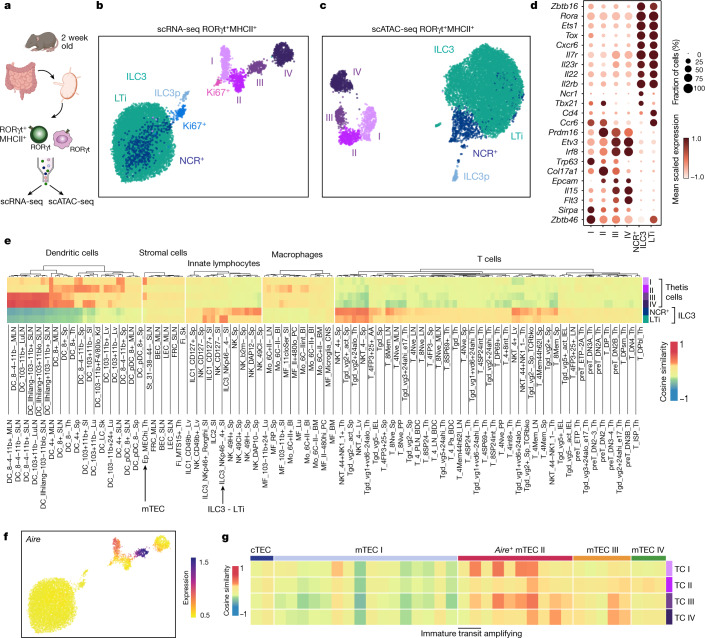
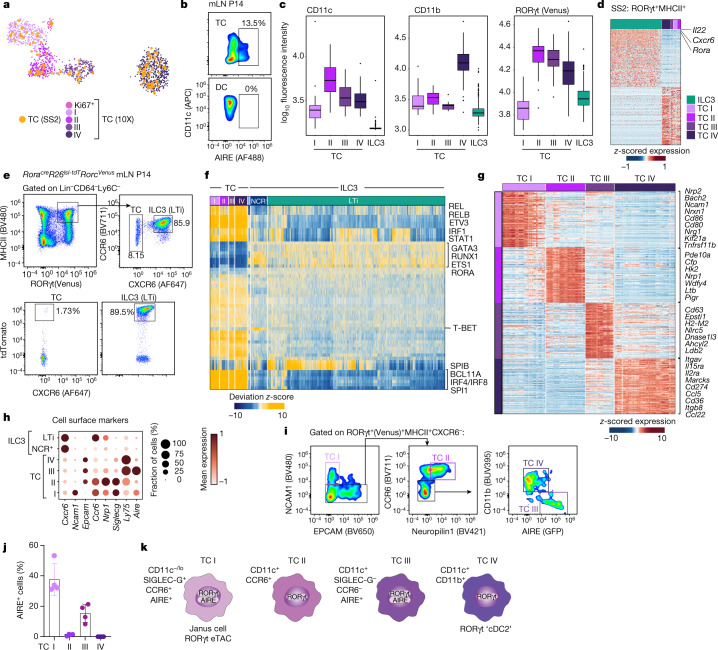
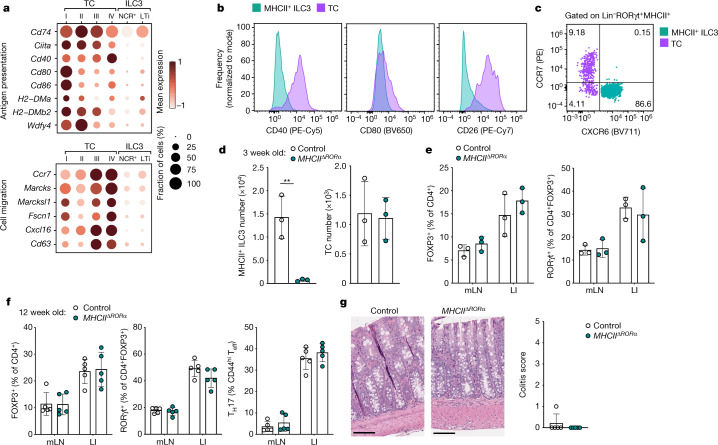
Verification
Claims the paper makes
The claims and statistics of this paper haven’t been checked yet.
Run the check — free, no account needed. It reads the open-access text and checks the sources it cites.
Claims other papers make about this one
Each is checked against this paper’s own text: does it say what the citing paper says it does?
In the citing paper
“Similar to psoriasis, IL-17 pathway inhibitors (secukinumab and ixekizumab) have been shown to be effective in the treatment of PsA [141, 142].”
From TH17 cell heterogeneity and its role in tissue inflammation (2023) · cites this paper as [141]
Self-check
Percentages, sums and reported differences re-computed from the paper’s own numbers.
The self-check needs the paper’s full text.
Citations
Cites
Subramanian, A., Tamayo, P., Mootha, V. K., Mukherjee, S., Ebert, B. L., Gillette, M. A., Paulovich, A., Pomeroy, S. L., Golub, T. R., Lander, E. S., et al. (2005) · Proceedings of the National Academy of Sciences · doi:10.1073/pnas.0506580102 · Cited by 53,625
STAR: ultrafast universal RNA-seq aligner
Dobin, A., Davis, C. A., Schlesinger, F., Drenkow, J., Zaleski, C., Jha, S., Batut, P., Chaisson, M., & Gingeras, T. R. (2013) · Bioinformatics · doi:10.1093/bioinformatics/bts635 · Cited by 51,709
featureCounts: an efficient general purpose program for assigning sequence reads to genomic features
Liao, Y., Smyth, G. K., & Shi, W. (2014) · Bioinformatics · doi:10.1093/bioinformatics/btt656 · Cited by 27,219
Twelve years of SAMtools and BCFtools
Danecek, P., Bonfield, J., Liddle, J., Marshall, J., Ohan, V., Pollard, M., Whitwham, A., Keane, T., McCarthy, S., Davies, R. M., et al. (2021) · GigaScience · doi:10.1093/gigascience/giab008 · Cited by 16,298
Comprehensive Integration of Single-Cell Data
Stuart, T., Butler, A., Hoffman, P., Hafemeister, C., Papalexi, E., Mauck, W. M., Hao, Y., Stoeckius, M., Smibert, P., & Satija, R. (2019) · Cell · doi:10.1016/j.cell.2019.05.031 · Cited by 15,453
Mootha, V. K., Lindgren, C. M., Eriksson, K.-F., Subramanian, A., Sihag, S., Lehar, J., Puigserver, P., Carlsson, E., Ridderstråle, M., Laurila, E., et al. (2003) · Nature Genetics · doi:10.1038/ng1180 · Cited by 10,197
UMAP: Uniform Manifold Approximation and Projection
McInnes, L., Healy, J., Saul, N., & Großberger, L. (2018) · Journal of Open Source Software · doi:10.21105/joss.00861 · Cited by 9,826
SCANPY: large-scale single-cell gene expression data analysis
Wolf, F. A., Angerer, P., & Theis, F. J. (2018) · Genome Biology · doi:10.1186/s13059-017-1382-0 · Cited by 8,881
Dissecting the multicellular ecosystem of metastatic melanoma by single-cell RNA-seq
Tirosh, I., Izar, B., Prakadan, S. M., Wadsworth, M. H., Treacy, D., Trombetta, J. J., Rotem, A., Rodman, C., Lian, C., Murphy, G., et al. (2016) · Science · doi:10.1126/science.aad0501 · Cited by 4,944
La Manno, G., Soldatov, R., Zeisel, A., Braun, E., Hochgerner, H., Petukhov, V., Lidschreiber, K., Kastriti, M. E., Lönnerberg, P., Furlan, A., et al. (2018) · Nature · doi:10.1038/s41586-018-0414-6 · Cited by 4,118
Finak, G., McDavid, A., Yajima, M., Deng, J., Gersuk, V., Shalek, A. K., Slichter, C. K., Miller, H. W., McElrath, M. J., Prlic, M., et al. (2015) · Genome Biology · doi:10.1186/s13059-015-0844-5 · Cited by 3,159
‘Actively Acquired Tolerance’ of Foreign Cells
Billingham, R. E., Brent, L., & Medawar, P. B. (1953) · Nature · doi:10.1038/172603a0 · Cited by 3,149
GENCODE reference annotation for the human and mouse genomes
Frankish, A., Diekhans, M., Ferreira, A.-M., Johnson, R., Jungreis, I., Loveland, J. E., Mudge, J. M., Sisu, C., Wright, J. C., Armstrong, J. C., et al. (2018) · Nucleic Acids Research · doi:10.1093/nar/gky955 · Cited by 2,983
Generalizing RNA velocity to transient cell states through dynamical modeling
Bergen, V., Lange, M., Peidli, S., Wolf, F. A., & Theis, F. J. (2020) · Nature Biotechnology · doi:10.1038/s41587-020-0591-3 · Cited by 2,951
Projection of an Immunological Self Shadow Within the Thymus by the Aire Protein
Anderson, M. S., Venanzi, E. S., Klein, L., Chen, Z.-B., Berzins, S., Turley, S., von Boehmer, H., Bronson, R., Dierich, A., Benoist, C., et al. (2002) · Science · doi:10.1126/science.1075958 · Cited by 2,582
Data-Driven Phenotypic Dissection of AML Reveals Progenitor-like Cells that Correlate with Prognosis
Levine, J. H., Simonds, E. F., Bendall, S. C., Davis, K. L., Amir, E.-A. D., Tadmor, M. D., Litvin, O., Fienberg, H. G., Jager, A., Zunder, E. R., et al. (2015) · Cell · doi:10.1016/j.cell.2015.05.047 · Cited by 2,303
p63 is essential for regenerative proliferation in limb, craniofacial and epithelial development
Yang, A., Schweitzer, R., Sun, D., Kaghad, M., Walker, N., Bronson, R. T., Tabin, C. J., Sharpe, A. H., Caput, D., Crum, C. P., et al. (1999) · Nature · doi:10.1038/19539 · Cited by 2,264
Perineuronal nets stabilize the grid cell network
Christensen, A. C., Lensjø, K. K., Lepperød, M. E., Dragly, S.-A., Sutterud, H., Blackstad, J. S., Fyhn, M., & Hafting, T. (2021) · Nature Communications · doi:10.1038/s41467-020-20241-w · Cited by 1,865
Recovering Gene Interactions from Single-Cell Data Using Data Diffusion
van Dijk, D., Sharma, R., Nainys, J., Yim, K., Kathail, P., Carr, A. J., Burdziak, C., Moon, K. R., Chaffer, C. L., Pattabiraman, D., et al. (2018) · Cell · doi:10.1016/j.cell.2018.05.061 · Cited by 1,829
Determination and Inference of Eukaryotic Transcription Factor Sequence Specificity
Weirauch, M. T., Yang, A. W. H., Albu, M., Coté, A. G., Montenegro‐Montero, A., Drewe, P., Najafabadi, H. S., Lambert, S. A., Mann, I. K., Cook, K. B., et al. (2014) · Cell · doi:10.1016/j.cell.2014.08.009 · Cited by 1,749
chromVAR: inferring transcription-factor-associated accessibility from single-cell epigenomic data
Schep, A. N., Wu, B., Buenrostro, J. D., & Greenleaf, W. J. (2017) · Nature Methods · doi:10.1038/nmeth.4401 · Cited by 1,680
Microbial Exposure During Early Life Has Persistent Effects on Natural Killer T Cell Function
Olszak, T., An, D., Zeissig, S., Vera, M. P., Richter, J., Franke, A., Glickman, J. N., Siebert, R., Baron, R. M., Kasper, D. L., et al. (2012) · Science · doi:10.1126/science.1219328 · Cited by 1,661
RNA virus interference via CRISPR/Cas13a system in plants
Aman, R., Ali, Z., Butt, H., Mahas, A., Aljedaani, F., Khan, M. Z., Ding, S., & Mahfouz, M. (2018) · Genome Biology · doi:10.1186/s13059-017-1381-1 · Cited by 1,497
ArchR is a scalable software package for integrative single-cell chromatin accessibility analysis
Granja, J. M., Corces, M. R., Pierce, S. E., Bagdatli, S. T., Choudhry, H., Chang, H. Y., & Greenleaf, W. J. (2021) · Nature Genetics · doi:10.1038/s41588-021-00790-6 · Cited by 1,392
p63 identifies keratinocyte stem cells
Pellegrini, G., Dellambra, E., Golisano, O., Martinelli, E., Fantozzi, I., Bondanza, S., Ponzin, D., McKeon, F., & Luca, M. D. (2001) · Proceedings of the National Academy of Sciences · doi:10.1073/pnas.061032098 · Cited by 1,359
A Critical Role for Dnmt1 and DNA Methylation in T Cell Development, Function, and Survival
Lee, P. P., Fitzpatrick, D. R., Beard, C., Jessup, H. K., Lehar, S. M., Makar, K. W., Pérez‐Melgosa, M., Sweetser, M. T., Schlissel, M. S., Nguyen, S., et al. (2001) · Immunity · doi:10.1016/s1074-7613(01)00227-8 · Cited by 1,282
A conserved dendritic-cell regulatory program limits antitumour immunity
Maier, B. B., Leader, A. M., Chen, S. T., Tung, N., Chang, C., Bérichel, J. L., Chudnovskiy, A., Maskey, S., Walker, L. A., Finnigan, J. P., et al. (2020) · Nature · doi:10.1038/s41586-020-2134-y · Cited by 939
Individual intestinal symbionts induce a distinct population of RORγ + regulatory T cells
Sefik, E., Geva-Zatorsky, N., Oh, S., Konnikova, L., Zemmour, D., McGuire, A. M., Burzyn, D., Ortiz-Lopez, A., Lobera, M., Yang, J., et al. (2015) · Science · doi:10.1126/science.aaa9420 · Cited by 879
The microbiota regulates type 2 immunity through RORγt + T cells
Ohnmacht, C., Park, J.-H., Cording, S., Wing, J. B., Atarashi, K., Obata, Y., Gaboriau-Routhiau, V., Marques, R., Dulauroy, S., Fedoseeva, M., et al. (2015) · Science · doi:10.1126/science.aac4263 · Cited by 863
Innate lymphoid cells regulate CD4+ T-cell responses to intestinal commensal bacteria
Hepworth, M. R., Monticelli, L. A., Fung, T. C., Ziegler, C. G. K., Grunberg, S., Sinha, R., Mantegazza, A. R., Ma, H., Crawford, A., Angelosanto, J., et al. (2013) · Nature · doi:10.1038/nature12240 · Cited by 816
Tissue residency of innate lymphoid cells in lymphoid and nonlymphoid organs
Gasteiger, G., Fan, X., Dikiy, S., Lee, S. Y., & Rudensky, A. Y. (2015) · Science · doi:10.1126/science.aac9593 · Cited by 813
Self-citationA guide to histomorphological evaluation of intestinal inflammation in mouse models.
Erben, U., Loddenkemper, C., Doerfel, K., Spieckermann, S., Haller, D., Heimesaat, M. M., Zeitz, M., Siegmund, B., & Kühl, A. A. (2014) · Europe PMC (PubMed Central) · Cited by 768
A cell atlas of human thymic development defines T cell repertoire formation
Park, J.-E., Botting, R. A., Conde, C. D., Popescu, D.-M., Lavaert, M., Kunz, D. J., Goh, I., Stephenson, E., Ragazzini, R., Tuck, E. J., et al. (2020) · Science · doi:10.1126/science.aay3224 · Cited by 758
Cells of the human intestinal tract mapped across space and time
Elmentaite, R., Kumasaka, N., Roberts, K., Fleming, A., Dann, E., King, H. W., Kleshchevnikov, V., Dabrowska, M. H., Pritchard, S., Bolt, L., et al. (2021) · Nature · doi:10.1038/s41586-021-03852-1 · Cited by 706
Self-citationQuantitative Studies on Tissue Transplantation Immunity. III. Actively Acquired Tolerance
Billingham, R. E., Brent, L., & Medawar, P. B. (1956) · Philosophical transactions of the Royal Society of London. Series B, Biological sciences · doi:10.1098/rstb.1956.0006 · Cited by 689
A weaning reaction to microbiota is required for resistance to immunopathologies in the adult
Al Nabhani, Z., Dulauroy, S., Marques, R., Cousu, C., Al Bounny, S., Déjardin, F., Sparwasser, T., Bérard, M., Cerf-Bensussan, N., & Eberl, G. (2019) · Immunity · doi:10.1016/j.immuni.2019.02.014 · Cited by 679
Transcriptional Basis of Mouse and Human Dendritic Cell Heterogeneity
Brown, C. C., Gudjonson, H., Pritykin, Y., Deep, D., Lavallée, V., Mendoza, A., Fromme, R. M., Mažutis, L., Ariyan, C. E., Leslie, C. S., et al. (2019) · Cell · doi:10.1016/j.cell.2019.09.035 · Cited by 601
Self-citationDietary antigens limit mucosal immunity by inducing regulatory T cells in the small intestine
Kim, K. S., Hong, S., Han, D., Yi, J., Jung, J., Yang, B., Lee, J. Y., Lee, M., & Surh, C. D. (2016) · Science · doi:10.1126/science.aac5560 · Cited by 541
Hepworth, M. R., Fung, T. C., Masur, S. H., Kelsen, J. R., McConnell, F. M., Dubrot, J., Withers, D. R., Hugues, S., Farrar, M. A., Reith, W., et al. (2015) · Science · doi:10.1126/science.aaa4812 · Cited by 537
Loss of integrin αvβ8 on dendritic cells causes autoimmunity and colitis in mice
Travis, M. A., Reizis, B., Melton, A. C., Masteller, E., Tang, Q., Proctor, J. M., Wang, Y., Bernstein, X., Huang, X., Reichardt, L. F., et al. (2007) · Nature · doi:10.1038/nature06110 · Cited by 503
Deletional Tolerance Mediated by Extrathymic Aire-Expressing Cells
Gardner, J. M., DeVoss, J., Friedman, R. S., Wong, D. J., Tan, Y. X., Zhou, X., Johannes, K., Su, M. A., Chang, H. Y., Krummel, M. F., et al. (2008) · Science · doi:10.1126/science.1159407 · Cited by 500
c-MAF-dependent regulatory T cells mediate immunological tolerance to a gut pathobiont
Xu, M., Pokrovskii, M., Ding, Y., Yi, R., Au, C., Harrison, O. J., Galan, C., Belkaid, Y., Bonneau, R., & Littman, D. R. (2018) · Nature · doi:10.1038/nature25500 · Cited by 498
Regulatory T cells generated early in life play a distinct role in maintaining self-tolerance
Yang, S., Fujikado, N., Kolodin, D., Benoist, C. O., & Mathis, D. J. (2015) · Science · doi:10.1126/science.aaa7017 · Cited by 461
Sansom, S. N., Shikama‐Dorn, N., Zhanybekova, S., Nusspaumer, G., Macaulay, I. C., Deadman, M. E., Heger, A., Ponting, C. P., & Holländer, G. A. (2014) · Genome Research · doi:10.1101/gr.171645.113 · Cited by 358
Martin, W. D., Hicks, G. G., Mendiratta, S. K., Leva, H. I., Ruley, H. E., & Kaer, L. V. (1996) · Cell · doi:10.1016/s0092-8674(00)81030-2 · Cited by 324
Mapping the developing human immune system across organs
Suo, C., Dann, E., Goh, I., Jardine, L., Kleshchevnikov, V., Park, J.-E., Botting, R. A., Stephenson, E., Engelbert, J., Tuong, Z. K., et al. (2022) · Science · doi:10.1126/science.abo0510 · Cited by 323
Self-citationSingle-cell mapping of the thymic stroma identifies IL-25-producing tuft epithelial cells
Bornstein, C., Nevo, S., Giladi, A., Kadouri, N., Pouzolles, M., Gerbe, F., David, E., Machado, A., Chuprin, A., Tóth, B., et al. (2018) · Nature · doi:10.1038/s41586-018-0346-1 · Cited by 317
Genetic Tracing via DNGR-1 Expression History Defines Dendritic Cells as a Hematopoietic Lineage
Schraml, B. U., van Blijswijk, J., Zelenay, S., Whitney, P. G., Filby, A. J., Acton, S. E., Rogers, N. C., Moncaut, N., Carvajal, J. J., & Sousa, C. R. E. (2013) · Cell · doi:10.1016/j.cell.2013.07.014 · Cited by 312
ILC3s select microbiota-specific regulatory T cells to establish tolerance in the gut
Lyu, M., Suzuki, H., Kang, L., Gaspal, F., Zhou, W., Goc, J., Zhou, L., Zhou, J., Zhang, W., Bank, J. L. C., et al. (2022) · Nature · doi:10.1038/s41586-022-05141-x · Cited by 302
Perry, J. S. A., Lio, C. J., Kau, A. L., Nutsch, K., Yang, Z., Gordon, J. I., MURPHY, K. M. M., & Hsieh, C. (2014) · Immunity · doi:10.1016/j.immuni.2014.08.007 · Cited by 293
A RORγt+ cell instructs gut microbiota-specific Treg cell differentiation
Kedmi, R., Najar, T. A., Mesa, K. R., Grayson, A., Kroehling, L., Hao, Y., Hao, S., Pokrovskii, M. V., Xu, M., Talbot, J., et al. (2022) · Nature · doi:10.1038/s41586-022-05089-y · Cited by 270
Ulcerative colitis and autoimmunity induced by loss of myeloid αv integrins
Lacy‐Hulbert, A., Smith, A. M., Tissire, H., Barry, M., Crowley, D. G., Bronson, R. T., Roes, J., Savill, J., & Hynes, R. O. (2007) · Proceedings of the National Academy of Sciences · doi:10.1073/pnas.0707421104 · Cited by 225
Michelson, D. A., Hase, K., Kaisho, T., Benoist, C. O., & Mathis, D. J. (2022) · Cell · doi:10.1016/j.cell.2022.05.018 · Cited by 213
Aire Enforces Immune Tolerance by Directing Autoreactive T Cells into the Regulatory T Cell Lineage
Malchow, S., Leventhal, D. S., Lee, V., Nishi, S., Socci, N. D., & Savage, P. A. (2016) · Immunity · doi:10.1016/j.immuni.2016.02.009 · Cited by 207
Delayed protection by ESAT-6–specific effector CD4+ T cells after airborne M. tuberculosis infection
Gallegos, A. M., Pamer, E. G., & Glickman, M. S. (2008) · The Journal of Experimental Medicine · doi:10.1084/jem.20080353 · Cited by 194
A cell atlas of human thymic development defines T cell repertoire formationPreprint
Park, J.-E., Botting, R. A., Conde, C. D., et al. (2020) · bioRxiv (Cold Spring Harbor Laboratory) · doi:10.1101/2020.01.28.911115 · Cited by 187
IFNγ-Dependent Tissue-Immune Homeostasis Is Co-opted in the Tumor Microenvironment
Nirschl, C. J., Suárez‐Fariñas, M., Izar, B., Prakadan, S. M., Dannenfelser, R., Tirosh, I., Liu, Y., Zhu, Q., Devi, K. S. P., Carroll, S. L., et al. (2017) · Cell · doi:10.1016/j.cell.2017.06.016 · Cited by 183
An Immunologic Mode of Multigenerational Transmission Governs a Gut Treg Setpoint
Ramanan, D., Sefik, E., Galván-Peña, S., Wu, M., Yang, L., Yang, Z., Kostic, A. D., Golovkina, T. V., Kasper, D. L., Mathis, D. J., et al. (2020) · Cell · doi:10.1016/j.cell.2020.04.030 · Cited by 179
Vascular Development of the Brain Requires β8 Integrin Expression in the Neuroepithelium
Proctor, J. M., Zang, K., Wang, D., Wang, R., & Reichardt, L. F. (2005) · Journal of Neuroscience · doi:10.1523/jneurosci.3467-05.2005 · Cited by 176
Haemopedia RNA-seq: a database of gene expression during haematopoiesis in mice and humans
Choi, J., Baldwin, T. M., Wong, M., Bolden, J. E., Fairfax, K. A., Lucas, E. C., Cole, R., Biben, C., Morgan, C., Ramsay, K. A., et al. (2018) · Nucleic Acids Research · doi:10.1093/nar/gky1020 · Cited by 164
Visualizing the structure of RNA-seq expression data using grade of membership models
Dey, K. K., Hsiao, C. J., & Stephens, M. (2017) · PLoS Genetics · doi:10.1371/journal.pgen.1006599 · Cited by 161
Absence of MHC class II on cDCs results in microbial-dependent intestinal inflammation
Loschko, J., Schreiber, H. A., Rieke, G. J., Esterházy, D., Meredith, M. M., Pedicord, V. A., Yao, K.-H., Caballero, S., Pamer, E. G., Mucida, D., et al. (2016) · The Journal of Experimental Medicine · doi:10.1084/jem.20160062 · Cited by 140
The transcription factor TCF-1 enforces commitment to the innate lymphoid cell lineage
Harly, C., Kenney, D., Ren, G., Lai, B., Raabe, T. D., Yang, Q., Cam, M. C., Xue, H., Zhao, K., & Bhandoola, A. (2019) · Nature Immunology · doi:10.1038/s41590-019-0445-7 · Cited by 128
Wang, J., Lareau, C. A., Bautista, J. L., Gupta, A. R., Sándor, K., Germino, J., Yin, Y., Arvedson, M. P., Reeder, G. C., Cramer, N. T., et al. (2021) · Science Immunology · doi:10.1126/sciimmunol.abl5053 · Cited by 86
Reciprocal transcription factor networks govern tissue-resident ILC3 subset function and identity
Fiancette, R., Finlay, C. M., Willis, C., Bevington, S. L., Soley, J. K., Ng, S. T. H., Baker, S. M., Andrews, S., Hepworth, M. R., & Withers, D. R. (2021) · Nature Immunology · doi:10.1038/s41590-021-01024-x · Cited by 75
Sensory cortex limits cortical maps and drives top-down plasticity in thalamocortical circuits
Zembrzycki, A., Chou, S.-J., Ashery-Padan, R., Stoykova, A., & O'Leary, D. (2013) · Nature Neuroscience · doi:10.1038/nn.3454 · Cited by 73
Aire-expressing ILC3-like cells in the lymph node display potent APC features
Yamano, T., Dobeš, J., Vobořil, M., Steinert, M., Brabec, T., Ziętara, N., Dobešová, M., Ohnmacht, C., Laan, M., Peterson, P., et al. (2019) · The Journal of Experimental Medicine · doi:10.1084/jem.20181430 · Cited by 70
ZBTB46 defines and regulates ILC3s that protect the intestine
Zhou, W., Zhou, L., Zhou, J., Bank, J. L. C., Artis, D., Longman, R., Sonnenberg, G. F., Scherl, E., Sockolow, R., Lukin, D. J., et al. (2022) · Nature · doi:10.1038/s41586-022-04934-4 · Cited by 66
Dobeš, J., Ben‐Nun, O., Binyamin, A., Stoler‐Barak, L., Oftedal, B. E., Goldfarb, Y., Kadouri, N., Gruper, Y., Givony, T., Zalayat, I., et al. (2022) · Nature Immunology · doi:10.1038/s41590-022-01247-6 · Cited by 61
Transcriptional programs that control expression of the autoimmune regulator gene Aire
Herzig, Y., Nevo, S., Bornstein, C., Brezis, M. R., Ben‐Hur, S., Shkedy, A., Eisenberg‐Bord, M., Levi, B. Z., Delacher, M., Goldfarb, Y., et al. (2016) · Nature Immunology · doi:10.1038/ni.3638 · Cited by 57
Papaioannou, N. E., Salei, N., Rambichler, S., Rengarajan, K. R., Popović, J., Küntzel, V., Lehmann, C. H. K., Fiancette, R., Salvermoser, J., Gajdasik, D. W., et al. (2021) · Nature Communications · doi:10.1038/s41467-020-20659-2 · Cited by 51
Nakawesi, J., This, S., Hütter, J., Boucard-Jourdin, M., Barateau, V., Muleta, K. G., Gooday, L. J., Thomsen, K., López, A. G., Ulmert, I., et al. (2020) · Mucosal Immunology · doi:10.1038/s41385-020-0276-8 · Cited by 45
Fergusson, J., Morgan, M., Bruchard, M., Huitema, L., Heesters, B., van Unen, V., van Hamburg, J. P., van der Wel, N. N., Picavet, D. I., Koning, F., et al. (2019) · Frontiers in Immunology · doi:10.3389/fimmu.2018.02902 · Cited by 44
Stehle, C., Rückert, T., Fiancette, R., Gajdasik, D. W., Willis, C., Ulbricht, C., Durek, P., Mashreghi, M., Finke, D., Hauser, A. E., et al. (2021) · Nature Immunology · doi:10.1038/s41590-021-01029-6 · Cited by 44
Mapping the developing human immune system across organsPreprint
Suo, C., Dann, E., Goh, I., et al. (2022) · bioRxiv (Cold Spring Harbor Laboratory) · doi:10.1101/2022.01.17.476665 · Cited by 40
Salvermoser, J., van Blijswijk, J., Papaioannou, N. E., Rambichler, S., Pásztói, M., Pakalniškytė, D., Rogers, N. C., Keppler, S. J., Straub, T., Sousa, C. R. E., et al. (2018) · Frontiers in Immunology · doi:10.3389/fimmu.2018.00699 · Cited by 39
Positive selection of self-MHC-reactive T cells by individual peptide–MHC class II complexes
Barton, G. M., Beers, C., DeRoos, P. C., Eastman, S., Gomez, M. E., Forbush, K. A., & Rudensky, A. Y. (2002) · Proceedings of the National Academy of Sciences · doi:10.1073/pnas.102645699 · Cited by 19
Self-citationKedmi, R., Najar, T. A., Mesa, K. R., Grayson, A., Kroehling, L., Hao, Y., Hao, S., Pokrovskii, M. V., Xu, M., Talbot, J., et al. (2021) · bioRxiv (Cold Spring Harbor Laboratory) · doi:10.1101/2021.11.19.469318 · Cited by 3
Core skin DC signatures control immune tolerance to skin cancer and limit anti-tumor immunity
Nirschl, C. J., Liu, Y., Sarin, K. Y., Suárez‐Fariñas, M., Chau, D., Sage, P. T., Sharpe, A. H., & Anandasabapathy, N. (2015) · Journal for ImmunoTherapy of Cancer · doi:10.1186/2051-1426-3-s2-p205 · Cited by 1
Research works printed but not linked: 1
- Taddy, M. A. On estimation and selection for topic models. Proc. Mach. Learn. Res. 22, 1184–1193 (2012).
Cited by
Sorted by citations
TGF-β signaling in health and disease
Massagué, J., & Sheppard, D. (2023) · Cell · doi:10.1016/j.cell.2023.07.036 · Cited by 890
Kim, C. H. (2023) · Cellular & Molecular Immunology · doi:10.1038/s41423-023-00987-1 · Cited by 420
Principles and therapeutic applications of adaptive immunity
Chi, H., Pepper, M., & Thomas, P. G. (2024) · Cell · doi:10.1016/j.cell.2024.03.037 · Cited by 394
TH17 cell heterogeneity and its role in tissue inflammation
Schnell, A., Littman, D. R., & Kuchroo, V. K. (2023) · Nature Immunology · doi:10.1038/s41590-022-01387-9 · Cited by 286
Nutritional regulation of microbiota-derived metabolites: Implications for immunity and inflammation
Arifuzzaman, M., Collins, N., Guo, C., & Artis, D. (2024) · Immunity · doi:10.1016/j.immuni.2023.12.009 · Cited by 159
Metadata
- Authors
- Akagbosu, B., Tayyebi, Z., Shibu, G., Paucar Iza, Y. A., Deep, D., Parisotto, Y. F., Fisher, L., Pasolli, H. A., Thevin, V., Elmentaite, R., Knott, M., Hemmers, S., Jahn, L., Friedrich, C., Verter, J., Wang, Z.-M., van den Brink, M., Gasteiger, G., Grünewald, T. G. P., Marie, J. C., Leslie, C., Rudensky, A. Y., & Brown, C. C.
- Affiliations
- Memorial Sloan Kettering Cancer Center (US)
- Rockefeller University (US)
- Centre National de la Recherche Scientifique (FR)
- Wellcome Sanger Institute (GB)
- Ludwig-Maximilians-Universität München (DE)
- University of Würzburg (DE)
- German Cancer Research Center (DE)
- Corresponding author
- Rudensky, Alexander Y.
- Brown, Chrysothemis C.
- ORCID
- Tayyebi, Zakieh
- Shibu, Gayathri
- Deep, Deeksha
- Fisher, Logan
- Pasolli, H. Amalia
- Thevin, Valentin
- Elmentaite, Rasa
- Knott, Maximilian
- Hemmers, Saskia
- Jahn, Lorenz
- Friedrich, Christin
- Verter, Jacob
- Wang, Zhong-Min
- van den Brink, Marcel
- Gasteiger, Georg
- Grünewald, Thomas G. P.
- Marie, Julien C.
- Leslie, Christina
- Rudensky, Alexander Y.
- Brown, Chrysothemis C.
- Venue
- Nature
- Published
- 2022-09-07
- Volume
- 610
- Issue
- 7933
- Pages
- 752-760
- ISSN
- 0028-0836 (ISSN-L)
- 1476-4687
- PMC
- PMC9605865
- OpenAlex
- W4294904731
- Cited by
- 273
- References
- 77
- Citations by year
- 2026: 61 · 2025: 72 · 2024: 75 · 2023: 57 · 2022: 8
- FWCI
- 20.20
- Type
- journal article
- Language
- en
- Open access
- hybrid
- doi.org
- Locations
- Nature (publishedVersion, cc-by)
- bioRxiv (Cold Spring Harbor Laboratory) (acceptedVersion)
- PubMed Central (publishedVersion, cc-by)
- PubMed (publishedVersion)
- HAL (submittedVersion, other-oa)
- RePEc: Research Papers in Economics (submittedVersion)
- Funders
- Howard Hughes Medical Institute (P30 CA08748)
- Conrad N. Hilton Foundation
- Memorial Sloan-Kettering Cancer Center (P30-CA08748)
- Ludwig Institute for Cancer Research
- Wellcome Trust (WT201483/Z/16/Z, 201483/Z/16/Z)
- Parker Institute for Cancer Immunotherapy
- Cycle for Survival
- National Institutes of Health (CA08748, CCSG, P30 CA08748)
- Weill Cornell Medical College (T32GM007739)
- Ludwig Center at Harvard
- Marie-Josée and Henry R. Kravis Center for Molecular Oncology
- National Cancer Institute (CA08748, U54CA209975, CA209975, P30CA008748, CCSG P30 CA08748)
- National Institute of General Medical Sciences (T32GM007739)
- National Institute of Allergy and Infectious Diseases (F30AI154660, DP2AI171116, R01AI034206)
- Topics
- Life Sciences › Immunology and Microbiology › Immunology › T-cell and B-cell Immunology
- Life Sciences › Immunology and Microbiology › Immunology › Immunotherapy and Immune Responses
- Life Sciences › Immunology and Microbiology › Immunology › Psoriasis: Treatment and Pathogenesis
- Keywords
- peripheral regulatory T cells, antigen-presenting cells, gut microbiota, self-tolerance, AIRE, RORγt, MHC class II, integrin αvβ8, TGF-beta, intestinal lymph nodes, colitis, ILC3, dendritic cells, medullary thymic epithelial cells, early life development
- MeSH terms
- Gastrointestinal Microbiome, Antigen-Presenting Cells, Cell Differentiation, Dendritic Cells, Epithelial Cells, Immune Tolerance, Immunity, Innate, Lymph Nodes, Thymus Gland, Integrins, Transforming Growth Factor beta, T-Lymphocytes, Regulatory, Nuclear Receptor Subfamily 1, Group F, Member 3
About these checks
Registry, retraction, Cites and statistics results are computed, not judged, with one exception: a printed reference that no index lists is read once by a model before it counts as a citation error. Claims are extracted by a model and kept only when their quote appears verbatim in the text; each cited source is then checked, with a model’s help, for whether it says what the claim relies on. Those verdicts can be wrong — read the claim’s quote and the cited source before relying on one.
Statistics and arithmetic are recomputed, not judged.
Confidence bands are shown only for fields calibrated on our annotated test set. None is calibrated yet, so no band is shown.
What counts as a claim ›How we measure confidence ›How we check this ›
Are you an author, or do you see a problem with this page? Request a review
