

The DOI matches its Crossref record; 105 of the 105 references it cites were found in a registry or an index; 31 of the 42 sources its claims cite were checked for support.
Single-cell brain organoid screening identifies developmental defects in autism
Open accessPublished version of a preprint
Abstract
The development of the human brain involves unique processes (not observed in many other species) that can contribute to neurodevelopmental disorders 1–4 . Cerebral organoids enable the study of neurodevelopmental disorders in a human context. We have developed the CRISPR–human organoids–single-cell RNA sequencing (CHOOSE) system, which uses verified pairs of guide RNAs, inducible CRISPR–Cas9-based genetic disruption and single-cell transcriptomics for pooled loss-of-function screening in mosaic organoids. Here we show that perturbation of 36 high-risk autism spectrum disorder genes related to transcriptional regulation uncovers their effects on cell fate determination. We find that dorsal intermediate progenitors, ventral progenitors and upper-layer excitatory neurons are among the most vulnerable cell types. We construct a developmental gene regulatory network of cerebral organoids from single-cell transcriptomes and chromatin modalities and identify autism spectrum disorder-associated and perturbation-enriched regulatory modules. Perturbing members of the BRG1/BRM-associated factor (BAF) chromatin remodelling complex leads to enrichment of ventral telencephalon progenitors. Specifically, mutating the BAF subunit ARID1B affects the fate transition of progenitors to oligodendrocyte and interneuron precursor cells, a phenotype that we confirmed in patient-specific induced pluripotent stem cell-derived organoids. Our study paves the way for high-throughput phenotypic characterization of disease susceptibility genes in organoid models with cell state, molecular pathway and gene regulatory network readouts.
Overview
AI snapshot
Written from the paper’s full text.
TL;DR
The authors developed CHOOSE, a pooled CRISPR–single-cell RNA sequencing system in mosaic human cerebral organoids, and used it to screen 36 high-risk autism spectrum disorder (ASD) genes for developmental loss-of-function phenotypes. They identify vulnerable progenitor and neuronal cell types, ASD-associated regulatory modules, and show that ARID1B perturbation expands ventral progenitors and shifts their fate toward early oligodendrocyte precursor cells, with validation in patient-derived organoids and prenatal MRI.
Key findings
- Perturbation of 36 high-risk ASD genes affected cell fate: 24 perturbations significantly changed the dorsal-to-ventral cell ratio, with 21 of 24 lowering it; 23 perturbations changed abundance of at least one cell type (CMH test, FDR < 0.05).
- IPC depletion was a convergent effect in 12 perturbations; v-RGC and/or ccv-RGC enrichment occurred in 10 perturbations; INP enrichment occurred in 10 perturbations; L2/3 excitatory neurons were depleted in the majority of perturbations.
- Across perturbations, 2,071 differentially expressed genes were detected; top DEGs were significantly enriched in SFARI ASD risk genes (approximately twofold, Fisher exact test P < 10−5) but not in intellectual disability risk genes.
- ARID1B perturbation enriched v-RGCs and increased their transition probability toward early OPCs (two-sided Wilcoxon P = 7.7 × 10⁻⁸); patient iPS cell-derived ventralized organoids showed increased OLIG2+, DLX2+ and DLX2+OLIG2+ cells, and prenatal MRI showed enlarged ganglionic eminence in an ARID1B-mutant patient.
Methods
- CHOOSE combines barcoded dual sgRNA lentiviral libraries, inducible eCas9 in hES cells, and mosaic cerebral organoids; the screen targeted 36 SFARI score 1 ASD genes with verified sgRNA pairs.
- Single-cell transcriptomics was performed on 4-month-old organoids: 49,754 cells in the full CHOOSE dataset, with 35,203 control/uninduced cells used for annotation; data came from 14 independent organoid pools, 3–7 organoids per pool, 65 organoids total, across three batches.
- Analyses included differential gRNA representation, CMH-based differential abundance, differential expression, single-cell multiome-based GRN inference with Pando, CellRank fate mapping, immunohistochemistry, patient iPS cell-derived organoids, and fetal MRI with 3D reconstruction.
Limitations
- The paper states the system lacks certain brain cell types such as microglia and does not include medial ganglionic eminence-derived interneurons.
- The paper states it does not know whether perturbed cells are heterozygous or homozygous for each mutation, and that transient effects of ASD risk gene perturbations may not be captured.
- The paper notes mutant cells remained at low percentages during development, averaging 21.8% on day 120, which could limit mutant cell–cell interactions within mosaic tissues.
Model-written summary. Check it against the paper before relying on it.
Integrity signals
Registry
Cites
Statistics
Figures
Verification
Claims the paper makes
71 Own result · 20 Own method · 20 Own interpretation · 10 Partly supported · 6 Supported · 4 No full text of the sources · 3 Supported so far · 2 No basis given · 1 Not checked yet · accuracy not yet measured
The cited sources support only part of this claim — read each source’s verdict below.
In the paper
“The dual gRNA is located within the 3′ long terminal repeat (LTR) and is thus transcribed by RNA polymerase II to be captured by scRNA-seq assays17.”
§ Single-cell brain organoid screening identifies developmental defects in autism > Single-cell CRISPR screening in barcoded organoids
What the sources say
- Partly supportedcites [17] Datlinger, P. et al. Pooled CRISPR screening with single-cell transcriptome read-out. Nat. Methods 14, 297–301 (2017). sourceExperimental — accuracy not yet measured
In “Direct detection of gRNAs from single-cell transcriptome data” (p. 2), the paper places an hU6-gRNA cassette in the 3′ LTR and says the gRNA becomes part of an RNA polymerase II transcript detectable by poly-A-enriched RNA-seq. The paper describes an individual gRNA in that cassette, however, not a dual-gRNA construct; that qualifier is unsupported. (LLM, conf=0.84)
plaindirect- Asserted: passes — The authors put it forward as true.
- Checkable: passes — It can be checked against evidence.
- Load-bearing: passes — The paper’s conclusions depend on it.
- Based: passes — The paper gives a reason why it holds.
- Partly supported
Every source the paper cites for this claim was checked and supports it.
In the paper
“Notably, we found a cluster of interneurons expressing MEIS2 and high levels of PAX6 (LGE PAX6+ interneurons), a signature that resembles mouse olfactory bulb precursors that were recently reported to generate neurons redirected to white matter in primates29.”
§ Single-cell brain organoid screening identifies developmental defects in autism > CHOOSE organoids generate diverse cell types
What the sources say
- Supportedcites [29] Schmitz, M. T. et al. The development and evolution of inhibitory neurons in primate cerebrum. Nature 603, 871–877 (2022). source
In “Reuse of OB neurons in primate cerebrum” (page unavailable), the paper reports that the LGE_MEIS2/PAX6 class has a strong transcriptomic correlation with mouse olfactory-bulb granule cells. The same section reports that neurons of this class migrate through primate cortical streams and persist in deep white matter, supporting the cited paraphrase. (LLM, conf=0.90)
plaincorrelational- Asserted: passes — The authors put it forward as true.
- Checkable: passes — It can be checked against evidence.
- Load-bearing: unclear — It is unclear whether the paper’s conclusions depend on it.
- Based: passes — The paper gives a reason why it holds.
- Supported
The cited sources support only part of this claim — read each source’s verdict below.
In the paper
“Many ASD risk genes associated with transcriptional regulation and chromatin remodelling are crucial for cortical development21,22.”
§ Single-cell brain organoid screening identifies developmental defects in autism > CHOOSE organoids generate diverse cell types
What the sources say
- Partly supportedcites [21] Study, T. D. et al. Synaptic, transcriptional, and chromatin genes disrupted in autism. Nature 515, 209–215 (2014). sourceExperimental — accuracy not yet measured
The Conclusions call chromatin remodeling and transcription critical pathways for typical development and link chromatin remodeling to neurogenesis and neural differentiation. The Integrating complementary data section uses mid-fetal neocortex as a developmental context for identifying ASD risk genes, but does not establish that many of the transcriptional and chromatin-remodeling risk genes are individually crucial for cortical development. Page numbers are unavailable in our copy. (LLM, conf=0.82)
- Not checked — no full text of the sourcecites [22] Trevino, A. E. et al. Chromatin and gene-regulatory dynamics of the developing human cerebral cortex at single-cell resolution. Cell 184, 5053–5069.e23 (2021). source
plaincorrelational- Asserted: passes — The authors put it forward as true.
- Checkable: passes — It can be checked against evidence.
- Load-bearing: passes — The paper’s conclusions depend on it.
- Based: passes — The paper gives a reason why it holds.
- Partly supported
Every source the paper cites for this claim was checked and supports it.
In the paper
“Moreover, coexpression network analyses of ASD genes indicate that the developmental defects associated with ASD may arise during fetal stages5,6, periods that are difficult to investigate.”
§ Single-cell brain organoid screening identifies developmental defects in autism > Main
What the sources say
- Supportedcites [5] Willsey, A. J. et al. Coexpression networks implicate human midfetal deep cortical projection neurons in the pathogenesis of autism. Cell 155, 997–1007 (2013). source
The Discussion reports that coexpression networks involving ASD risk genes converge in cortical projection neurons during midfetal human development (10–24 postconceptional weeks). It also describes robust evidence of vulnerability during midfetal development, supporting the citing sentence’s qualified claim that ASD-associated developmental defects may arise during fetal stages. (LLM, conf=0.92)
- Supportedcites [6] Parikshak, N. N. et al. Integrative functional genomic analyses implicate specific molecular pathways and circuits in autism. Cell 155, 1008–1021 (2013). source
The Results section (‘Genes implicated in ASD are highly co-expressed during human cortical development’; page not supplied) reports that ASD gene-network analyses converge on modules involved in prenatal and early postnatal development. The Discussion also reports a signal during fetal development. These findings support the claim’s qualified statement that ASD-associated developmental defects may arise during fetal stages. (LLM, conf=0.90)
hedgedconditional- Asserted: passes — The authors put it forward as true.
- Checkable: passes — It can be checked against evidence.
- Load-bearing: passes — The paper’s conclusions depend on it.
- Based: passes — The paper gives a reason why it holds.
- Supported
The sources with a verdict support this claim; the rest weren’t checked yet, have no full text we could read, or their verdicts aren’t rated yet.
In the paper
“Although CRISPR screening coupled with single-cell transcriptomic readout provides unprecedented resolution for phenotypic characterization14–16, such approaches have not been fully explored in organoids.”
§ Single-cell brain organoid screening identifies developmental defects in autism > Main
What the sources say
- Supportedcites [14] Dixit, A. et al. Perturb-seq: dissecting molecular circuits with scalable single-cell RNA profiling of pooled genetic screens. Cell 167, 1853–1866.e17 (2016). source
The Introduction describes Perturb-seq as combining CRISPR/Cas9 perturbations with single-cell RNA-seq to provide a rich genomic readout. The Results explain that it links each cell’s transcriptional profile to its perturbation, supporting the claim of high-resolution phenotypic characterization. The paper does not use the word “unprecedented,” but contrasts this approach with the low-content readouts of earlier pooled screens. (LLM, conf=0.91)
- Not checked — no full text of the sourcecites [15] Jaitin, D. A. et al. Dissecting immune circuits by linking CRISPR-pooled screens with single-cell RNA-seq. Cell 167, 1883–1896.e15 (2016). source
- Supportedcites [16] Adamson, B. et al. A multiplexed single-cell CRISPR screening platform enables systematic dissection of the unfolded protein response. Cell 167, 1867–1882.e21 (2016). source
The Introduction contrasts conventional pooled screens, which average simple phenotypes across cells, with Perturb-seq, which pairs CRISPR interference with single-cell RNA sequencing to produce rich phenotypic data. It explains that this approach can distinguish responses within individual cells that bulk readouts cannot. The cited passages do not provide page numbers. (LLM, conf=0.91)
boosteddirect- Asserted: passes — The authors put it forward as true.
- Checkable: passes — It can be checked against evidence.
- Load-bearing: passes — The paper’s conclusions depend on it.
- Based: passes — The paper gives a reason why it holds.
- Supported
The sources with a verdict support this claim; the rest weren’t checked yet, have no full text we could read, or their verdicts aren’t rated yet.
In the paper
“Cortical abnormalities are a prominent feature of ASD8,20.”
§ Single-cell brain organoid screening identifies developmental defects in autism > CHOOSE organoids generate diverse cell types
What the sources say
- Supportedcites [8] Torre-Ubieta, L., de la Won, H., Stein, J. L. & Geschwind, D. H. Advancing the understanding of autism disease mechanisms through genetics. Nat. Med. 22, 345–361 (2016). source
The review’s “Altered fetal cortical development” section identifies multiple cortical abnormalities in individuals with ASD, including irregular lamination, ectopic cells and dendritic abnormalities. Its “Altered neural circuitry” section also describes changes in cortical connectivity. Together, these support the broad statement, while the review notes that the neuropathological studies had small cohorts. (LLM, conf=0.91)
- Not checked — no full text of the sourcecites [20] Chen, J. A., Peñagarikano, O., Belgard, T. G., Swarup, V. & Geschwind, D. H. The emerging picture of autism spectrum disorder: genetics and pathology. Pathology Mech. Dis. 10, 111–144 (2015). source
plaincorrelational- Asserted: passes — The authors put it forward as true.
- Checkable: passes — It can be checked against evidence.
- Load-bearing: passes — The paper’s conclusions depend on it.
- Based: passes — The paper gives a reason why it holds.
- Supported
The cited sources support only part of this claim — read each source’s verdict below.
In the paper
“Cell type-specific alterations have been observed in patients with ASD and brain organoid disease models11,34.”
§ Single-cell brain organoid screening identifies developmental defects in autism > Cell-type-specific effects of perturbing ASD genes
What the sources say
- Supportedcites [11] Paulsen, B. et al. Autism genes converge on asynchronous development of shared neuron classes. Nature 602, 268–273 (2022). source
The Discussion (page unavailable) reports prior evidence of dysregulated GABAergic and glutamatergic cortical neurons in ASD patients and experimental models. The Results, under “Asynchronous development in SUV420H1 mutants” (page unavailable), identify altered proportions of specific neuronal types in cortical organoids. Together, these support the claim for patients and organoid models. (LLM, conf=0.89)
- Partly supportedcites [34] Velmeshev, D. et al. Single-cell genomics identifies cell type–specific molecular changes in autism. Science 364, 685–689 (2019). sourceExperimental — accuracy not yet measured
The paper’s Abstract reports cell type-specific molecular changes in cortical tissue from patients with ASD, including changes in upper-layer excitatory neurons and microglia. The sentence also mentions brain organoid disease models, but our copy does not report findings from organoid models (searched: organoid). (LLM, conf=0.88)
plaincorrelational- Asserted: passes — The authors put it forward as true.
- Checkable: passes — It can be checked against evidence.
- Load-bearing: passes — The paper’s conclusions depend on it.
- Based: passes — The paper gives a reason why it holds.
- Supported
Every source the paper cites for this claim was checked and supports it.
In the paper
“Additionally, the effects of perturbations of ASD risk genes on cell-type abundances can sometimes be transient11,53, and therefore certain abnormalities during development may not be captured.”
§ Single-cell brain organoid screening identifies developmental defects in autism > Discussion
What the sources say
- Supportedcites [11] Paulsen, B. et al. Autism genes converge on asynchronous development of shared neuron classes. Nature 602, 268–273 (2022). source
In Results (‘Asynchronous development in SUV420H1 mutants’; page unavailable), the paper reports increased proportions of immature deep-layer projection neurons in one-month mutant organoids and says that this phenotype was rescued after three months. It also describes a transient GABAergic phenotype in the same cell line, supporting the claim that some effects on cell-type abundances are transient. (LLM, conf=0.93)
- Supportedcites [53] Villa, C. E. et al. CHD8 haploinsufficiency links autism to transient alterations in excitatory and inhibitory trajectories. Cell Rep. 39, 110615 (2022). source
The Results (page not specified in our copy) report a higher proportion of interneurons in CHD8-mutant cerebral organoids specifically at day 60. The Discussion describes the effect on interneuron development as early and temporally specific, supporting the claim that an ASD-risk-gene perturbation can have a transient effect on cell-type abundance. (LLM, conf=0.91)
plainconditional- Asserted: passes — The authors put it forward as true.
- Checkable: passes — It can be checked against evidence.
- Load-bearing: unclear — It is unclear whether the paper’s conclusions depend on it.
- Based: passes — The paper gives a reason why it holds.
- Supported
A result the paper reports from its own data — it cites no other source for it, so there is none to check. The quote shows it is in the paper.
In the paper
“We find that dorsal intermediate progenitors, ventral progenitors and upper-layer excitatory neurons are among the most vulnerable cell types.”
§ Single-cell brain organoid screening identifies developmental defects in autism > Abstract
plaincorrelational- Asserted: passes — The authors put it forward as true.
- Checkable: passes — It can be checked against evidence.
- Load-bearing: passes — The paper’s conclusions depend on it.
- Based: passes — The paper gives a reason why it holds.
A result the paper reports from its own data — it cites no other source for it, so there is none to check. The quote shows it is in the paper.
In the paper
“Here we show that perturbation of 36 high-risk autism spectrum disorder genes related to transcriptional regulation uncovers their effects on cell fate determination.”
§ Single-cell brain organoid screening identifies developmental defects in autism > Abstract
plaindirect- Asserted: passes — The authors put it forward as true.
- Checkable: passes — It can be checked against evidence.
- Load-bearing: passes — The paper’s conclusions depend on it.
- Based: passes — The paper gives a reason why it holds.
The paper states this without a source or data behind it here, so there is nothing to check it against. The quote shows it is in the paper.
In the paper
“We have developed the CRISPR–human organoids–single-cell RNA sequencing (CHOOSE) system, which uses verified pairs of guide RNAs, inducible CRISPR–Cas9-based genetic disruption and single-cell transcriptomics for pooled loss-of-function screening in mosaic organoids.”
§ Single-cell brain organoid screening identifies developmental defects in autism > Abstract
plain- Asserted: passes — The authors put it forward as true.
- Checkable: passes — It can be checked against evidence.
- Load-bearing: passes — The paper’s conclusions depend on it.
- Based: passes — The paper gives a reason why it holds.
A result the paper reports from its own data — it cites no other source for it, so there is none to check. The quote shows it is in the paper.
In the paper
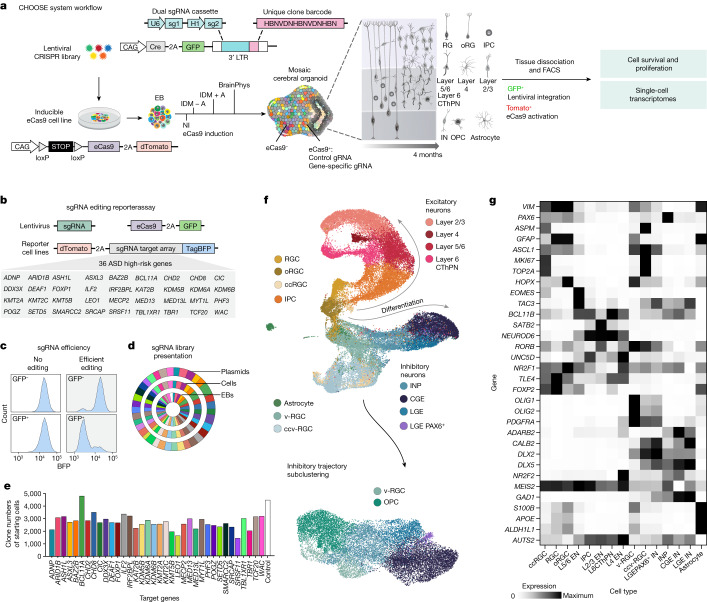
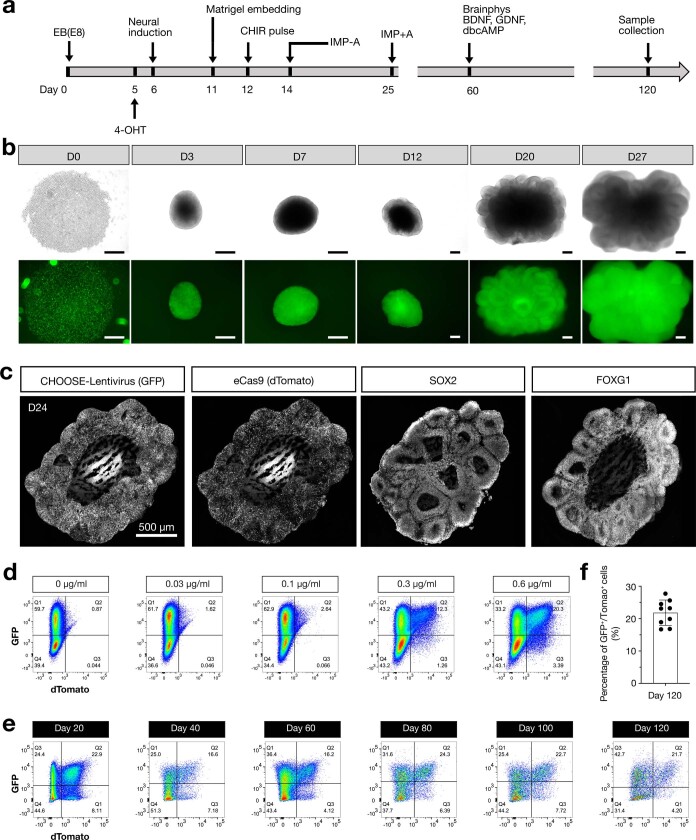
“Broadly, we found that perturbed cells adopted cell states resembling those found in the unperturbed controls (Fig. 1f).”
§ Single-cell brain organoid screening identifies developmental defects in autism > CHOOSE organoids generate diverse cell types
plain- Asserted: passes — The authors put it forward as true.
- Checkable: passes — It can be checked against evidence.
- Load-bearing: unclear — It is unclear whether the paper’s conclusions depend on it.
- Based: passes — The paper gives a reason why it holds.
A result the paper reports from its own data — it cites no other source for it, so there is none to check. The quote shows it is in the paper.
In the paper
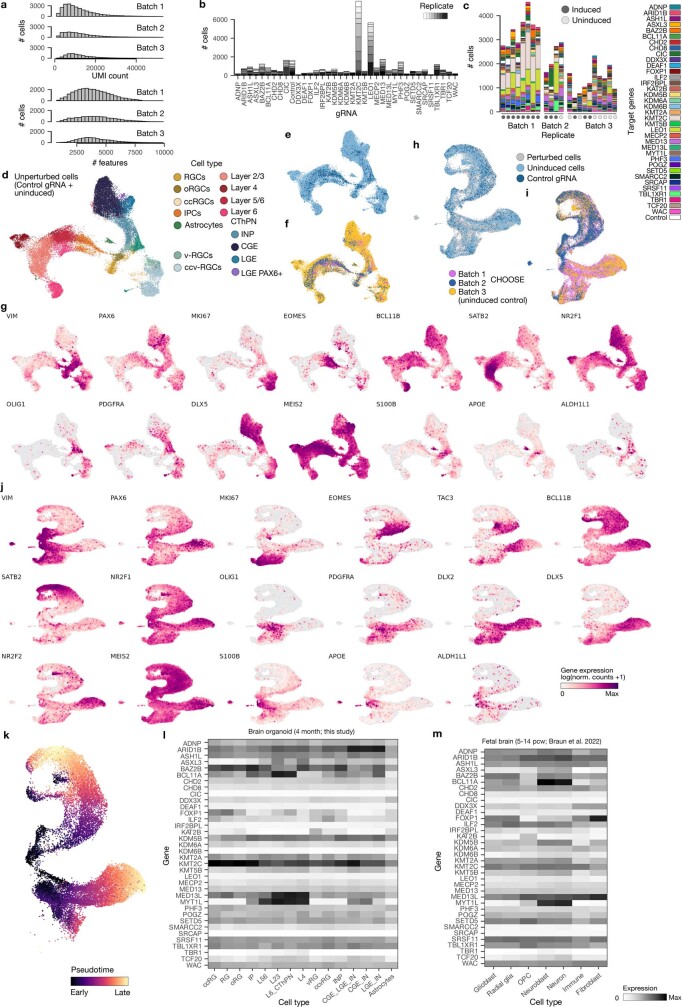
“Single-cell transcriptome profiling of cerebral organoids at 4 months revealed a large diversity of dorsal and ventral telencephalon cell populations (Fig. 1f,g and Extended Data Fig. 6a–j) (14 independent pools of organoids, 3–7 organoids each pool, 65 organoids in total, three independent batches).”
§ Single-cell brain organoid screening identifies developmental defects in autism > CHOOSE organoids generate diverse cell types
plainn = 65- Asserted: passes — The authors put it forward as true.
- Checkable: passes — It can be checked against evidence.
- Load-bearing: passes — The paper’s conclusions depend on it.
- Based: passes — The paper gives a reason why it holds.
A result the paper reports from its own data — it cites no other source for it, so there is none to check. The quote shows it is in the paper.
In the paper
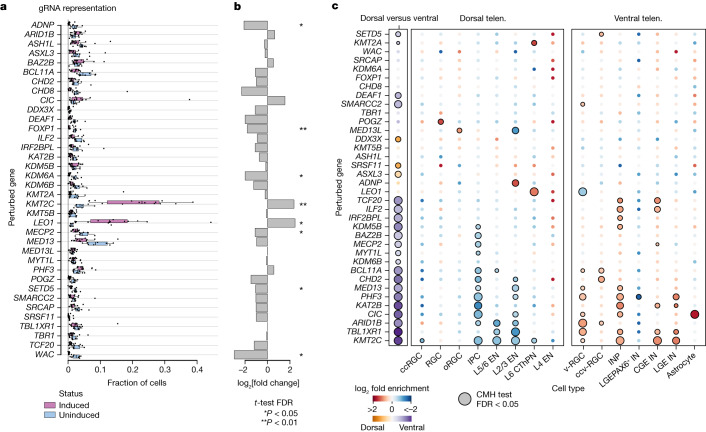
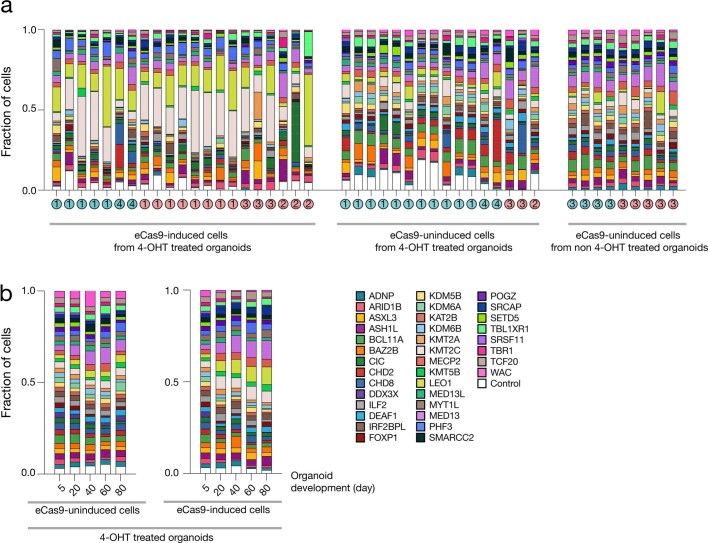
“When comparing eCas9-induced with uninduced cells from scRNA-seq libraries, we found significantly enriched and depleted gRNAs (Fig. 2a,b) (induced cells, n = 14 independent pools of organoids, three batches; uninduced cells, n = 8 independent pools of organoids, two batches).”
§ Single-cell brain organoid screening identifies developmental defects in autism > Cell proliferation and depletion phenotypes
plaincorrelationaln = 14- Asserted: passes — The authors put it forward as true.
- Checkable: passes — It can be checked against evidence.
- Load-bearing: passes — The paper’s conclusions depend on it.
- Based: passes — The paper gives a reason why it holds.
The paper states this without a source or data behind it here, so there is nothing to check it against. The quote shows it is in the paper.
In the paper
“Here, we describe the CHOOSE system which combines parallel genetic perturbations with single-cell transcriptomic readout in mosaic cerebral organoids.”
§ Single-cell brain organoid screening identifies developmental defects in autism > Main
plain- Asserted: passes — The authors put it forward as true.
- Checkable: passes — It can be checked against evidence.
- Load-bearing: passes — The paper’s conclusions depend on it.
- Based: passes — The paper gives a reason why it holds.
A result the paper reports from its own data — it cites no other source for it, so there is none to check. The quote shows it is in the paper.
In the paper
“We identified progenitor cells with dorsal (PAX6) or ventral (ASCL1, OLIG2) origins.”
§ Single-cell brain organoid screening identifies developmental defects in autism > CHOOSE organoids generate diverse cell types
plainn = 65- Asserted: passes — The authors put it forward as true.
- Checkable: passes — It can be checked against evidence.
- Load-bearing: unclear — It is unclear whether the paper’s conclusions depend on it.
- Based: passes — The paper gives a reason why it holds.
A result the paper reports from its own data — it cites no other source for it, so there is none to check. The quote shows it is in the paper.
In the paper
“Notably, we found a cluster of interneurons expressing MEIS2 and high levels of PAX6 (LGE PAX6+ interneurons), a signature that resembles mouse olfactory bulb precursors that were recently reported to generate neurons redirected to white matter in primates29.”
§ Single-cell brain organoid screening identifies developmental defects in autism > CHOOSE organoids generate diverse cell types
plain- Asserted: passes — The authors put it forward as true.
- Checkable: passes — It can be checked against evidence.
- Load-bearing: unclear — It is unclear whether the paper’s conclusions depend on it.
- Based: passes — The paper gives a reason why it holds.
A result the paper reports from its own data — it cites no other source for it, so there is none to check. The quote shows it is in the paper.
In the paper
“RNA velocity analysis30,31 revealed developmental trajectories from neural progenitor cells to neuronal populations in both the dorsal and ventral telencephalons (Extended Data Fig. 6k).”
§ Single-cell brain organoid screening identifies developmental defects in autism > CHOOSE organoids generate diverse cell types
plaincorrelational- Asserted: passes — The authors put it forward as true.
- Checkable: passes — It can be checked against evidence.
- Load-bearing: unclear — It is unclear whether the paper’s conclusions depend on it.
- Based: passes — The paper gives a reason why it holds.
A result the paper reports from its own data — it cites no other source for it, so there is none to check. The quote shows it is in the paper.
In the paper
“A time course analysis revealed a deviation from the initial gRNA distribution as early as day 20 (Extended Data Fig. 7b).”
§ Single-cell brain organoid screening identifies developmental defects in autism > Cell proliferation and depletion phenotypes
plain- Asserted: passes — The authors put it forward as true.
- Checkable: passes — It can be checked against evidence.
- Load-bearing: unclear — It is unclear whether the paper’s conclusions depend on it.
- Based: passes — The paper gives a reason why it holds.
A result the paper reports from its own data — it cites no other source for it, so there is none to check. The quote shows it is in the paper.
In the paper
“Further analysis of our organoid dataset and a primary developing human brain dataset32 revealed cell type-specific expression patterns for several ASD genes that we targeted in our screen (Extended Data Fig. 6l,m).”
§ Single-cell brain organoid screening identifies developmental defects in autism > CHOOSE organoids generate diverse cell types
plaincorrelational- Asserted: passes — The authors put it forward as true.
- Checkable: passes — It can be checked against evidence.
- Load-bearing: unclear — It is unclear whether the paper’s conclusions depend on it.
- Based: passes — The paper gives a reason why it holds.
A result the paper reports from its own data — it cites no other source for it, so there is none to check. The quote shows it is in the paper.
In the paper
“Perturbing members of the BRG1/BRM-associated factor (BAF) chromatin remodelling complex leads to enrichment of ventral telencephalon progenitors.”
§ Single-cell brain organoid screening identifies developmental defects in autism > Abstract
plaindirect- Asserted: passes — The authors put it forward as true.
- Checkable: passes — It can be checked against evidence.
- Load-bearing: passes — The paper’s conclusions depend on it.
- Based: passes — The paper gives a reason why it holds.
A result the paper reports from its own data — it cites no other source for it, so there is none to check. The quote shows it is in the paper.
In the paper
“We observed a heterogenous gRNA representation in eCas9-induced cells at 4 months.”
§ Single-cell brain organoid screening identifies developmental defects in autism > Cell proliferation and depletion phenotypes
plain- Asserted: passes — The authors put it forward as true.
- Checkable: passes — It can be checked against evidence.
- Load-bearing: unclear — It is unclear whether the paper’s conclusions depend on it.
- Based: passes — The paper gives a reason why it holds.
A result the paper reports from its own data — it cites no other source for it, so there is none to check. The quote shows it is in the paper.
In the paper
“In addition to neuronal populations, we identified glial cell populations including astrocytes (S100B, APOE, ALDH1L1) and OPCs (OLIG2, PDGFRA) (Fig. 1f,g).”
§ Single-cell brain organoid screening identifies developmental defects in autism > CHOOSE organoids generate diverse cell types
plain- Asserted: passes — The authors put it forward as true.
- Checkable: passes — It can be checked against evidence.
- Load-bearing: unclear — It is unclear whether the paper’s conclusions depend on it.
- Based: passes — The paper gives a reason why it holds.
A result the paper reports from its own data — it cites no other source for it, so there is none to check. The quote shows it is in the paper.
In the paper
“Among the 36 genes, one of the most significant changes in cell type composition was identified in the context of ARID1B.”
§ Single-cell brain organoid screening identifies developmental defects in autism > Main
plaincorrelational- Asserted: passes — The authors put it forward as true.
- Checkable: passes — It can be checked against evidence.
- Load-bearing: passes — The paper’s conclusions depend on it.
- Based: passes — The paper gives a reason why it holds.
A result the paper reports from its own data — it cites no other source for it, so there is none to check. The quote shows it is in the paper.
In the paper
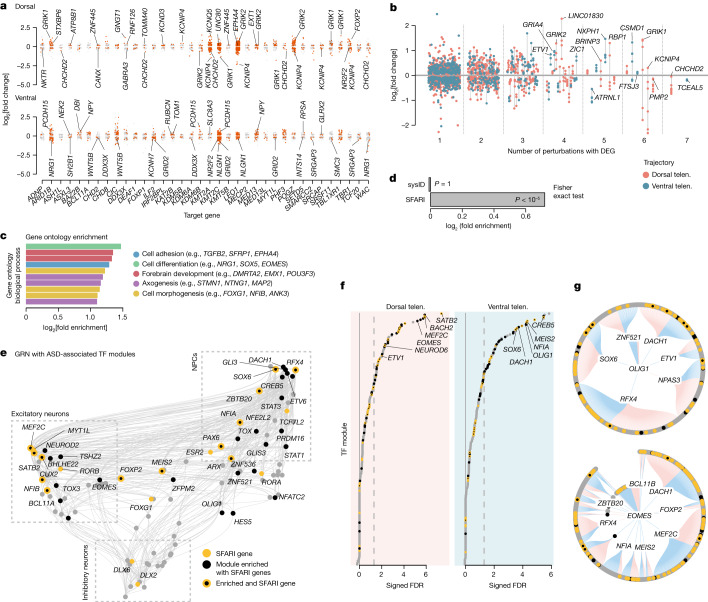
“We found that, similar to ASD risk genes, CHOOSE DEGs were enriched in specific TF modules (Fig. 3f and Supplementary Data 7).”
§ Single-cell brain organoid screening identifies developmental defects in autism > ASD-associated regulatory modules
plaincorrelational- Asserted: passes — The authors put it forward as true.
- Checkable: passes — It can be checked against evidence.
- Load-bearing: passes — The paper’s conclusions depend on it.
- Based: passes — The paper gives a reason why it holds.
A result the paper reports from its own data — it cites no other source for it, so there is none to check. The quote shows it is in the paper.
In the paper
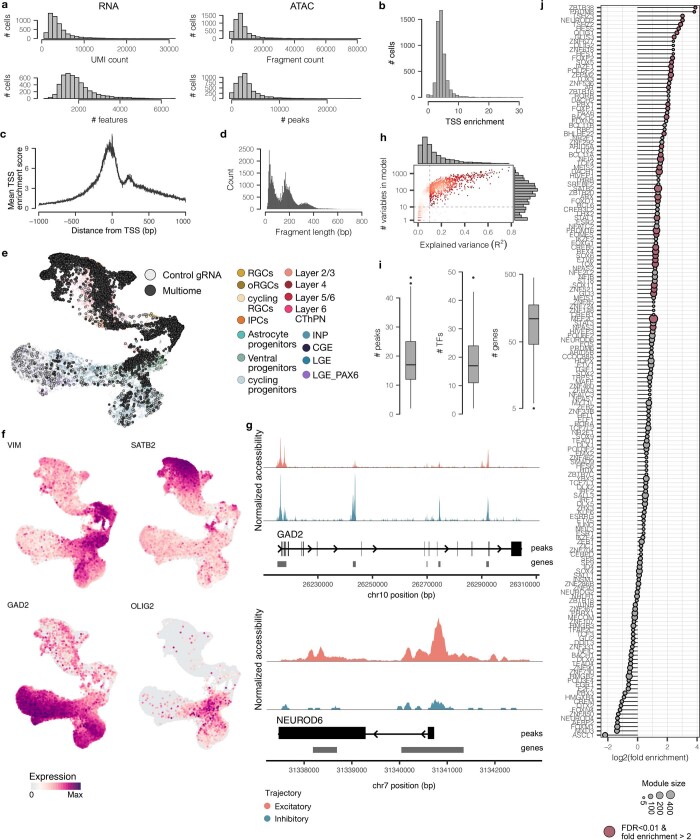
“Using Pando41, we harnessed these multimodal measurements to infer a GRN of the developing telencephalon and extract sets of genes regulated by each transcription factor (TF) module, as well as positive and negative regulatory interactions between the TFs (Extended Data Fig. 14h,i and Supplementary Data 5).”
§ Single-cell brain organoid screening identifies developmental defects in autism > ASD-associated regulatory modules
plain- Asserted: passes — The authors put it forward as true.
- Checkable: passes — It can be checked against evidence.
- Load-bearing: passes — The paper’s conclusions depend on it.
- Based: passes — The paper gives a reason why it holds.
A result the paper reports from its own data — it cites no other source for it, so there is none to check. The quote shows it is in the paper.
In the paper
“We detected 2,071 differentially expressed genes (DEGs) across all perturbations (Fig. 3a and Supplementary Data 2).”
§ Single-cell brain organoid screening identifies developmental defects in autism > Altered gene expression upon ASD gene perturbation
plain- Asserted: passes — The authors put it forward as true.
- Checkable: passes — It can be checked against evidence.
- Load-bearing: unclear — It is unclear whether the paper’s conclusions depend on it.
- Based: passes — The paper gives a reason why it holds.
A result the paper reports from its own data — it cites no other source for it, so there is none to check. The quote shows it is in the paper.
In the paper
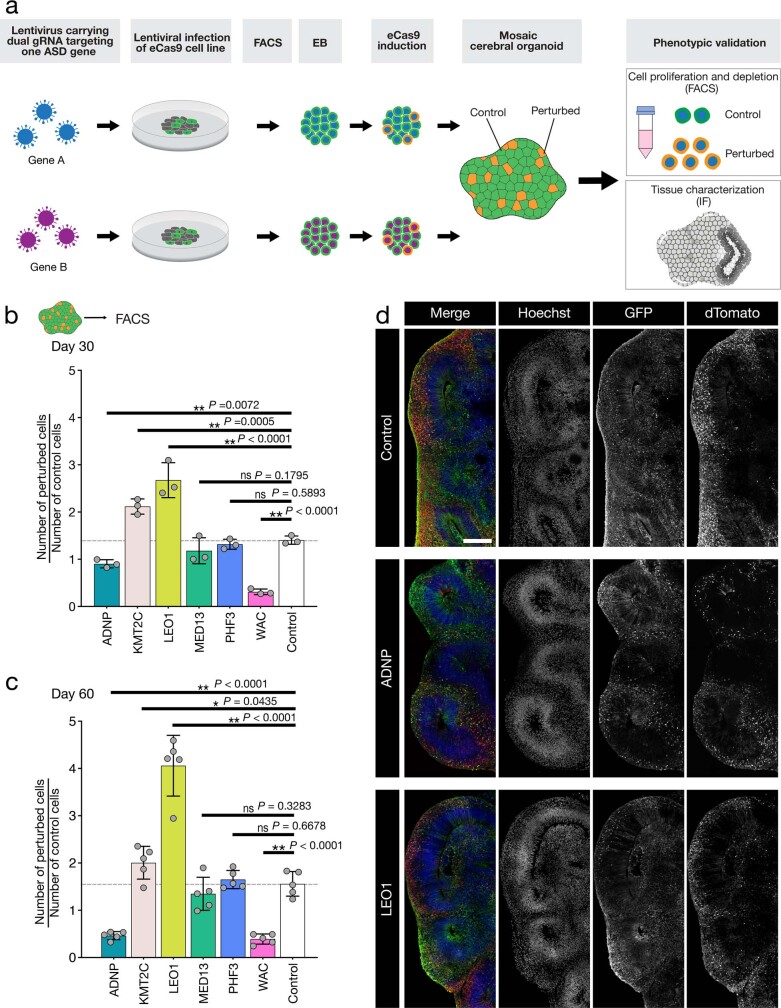
“Using a FACS-based approach, we further confirmed the enrichment and depletion phenotypes in individually perturbed organoids for the four genes (KMT2C, LEO1, ADNP and WAC) that showed the largest effect sizes (Extended Data Fig. 8).”
§ Single-cell brain organoid screening identifies developmental defects in autism > Cell proliferation and depletion phenotypes
plaincorrelational- Asserted: passes — The authors put it forward as true.
- Checkable: passes — It can be checked against evidence.
- Load-bearing: passes — The paper’s conclusions depend on it.
- Based: passes — The paper gives a reason why it holds.
A result the paper reports from its own data — it cites no other source for it, so there is none to check. The quote shows it is in the paper.
In the paper
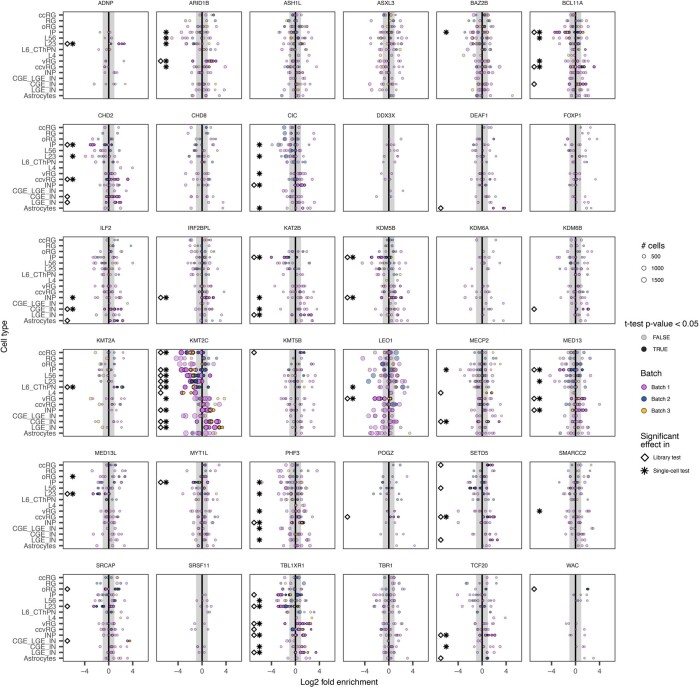
“For 23 perturbations, we detected changes in the abundance of at least one cell type (CMH test, false discovery rate (FDR) < 0.05) (Fig. 2c).”
§ Single-cell brain organoid screening identifies developmental defects in autism > Cell-type-specific effects of perturbing ASD genes
plaincorrelationaln = 11- Asserted: passes — The authors put it forward as true.
- Checkable: passes — It can be checked against evidence.
- Load-bearing: passes — The paper’s conclusions depend on it.
- Based: passes — The paper gives a reason why it holds.
A result the paper reports from its own data — it cites no other source for it, so there is none to check. The quote shows it is in the paper.
In the paper
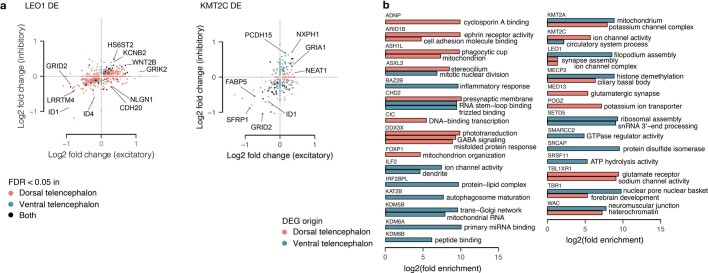
“Notably, in the dorsal populations, seven perturbations caused CHCHD2 downregulation (Fig. 3a).”
§ Single-cell brain organoid screening identifies developmental defects in autism > Altered gene expression upon ASD gene perturbation
plaindirect- Asserted: passes — The authors put it forward as true.
- Checkable: passes — It can be checked against evidence.
- Load-bearing: unclear — It is unclear whether the paper’s conclusions depend on it.
- Based: passes — The paper gives a reason why it holds.
A result the paper reports from its own data — it cites no other source for it, so there is none to check. The quote shows it is in the paper.
In the paper
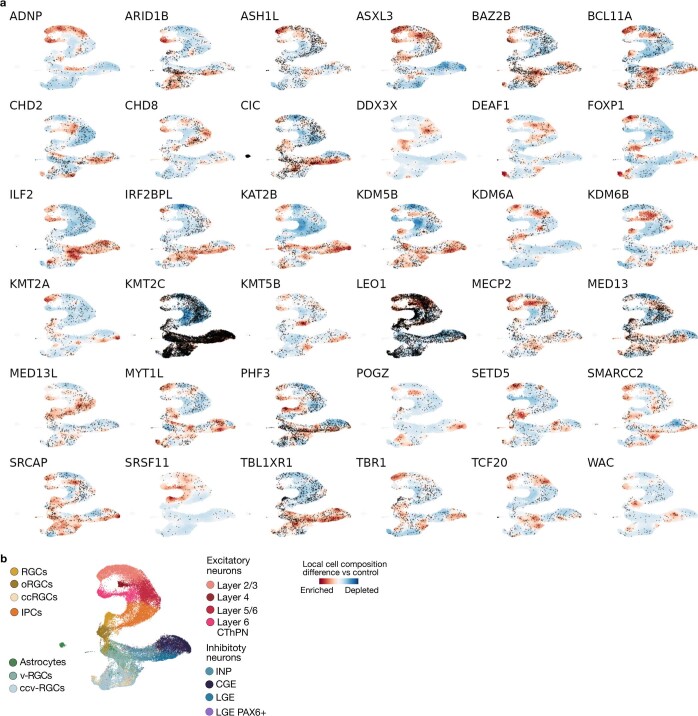
“Additionally, we observed an enrichment of v-RGCs and/or ccv-RGCs in 10 perturbations (for example, ARID1B, BCL11A and DEAF1) and an enrichment of INPs in 10 perturbations (for example, ILF2, MED13 and TCF20).”
§ Single-cell brain organoid screening identifies developmental defects in autism > Cell-type-specific effects of perturbing ASD genes
plaincorrelational- Asserted: passes — The authors put it forward as true.
- Checkable: passes — It can be checked against evidence.
- Load-bearing: passes — The paper’s conclusions depend on it.
- Based: passes — The paper gives a reason why it holds.
A result the paper reports from its own data — it cites no other source for it, so there is none to check. The quote shows it is in the paper.
In the paper
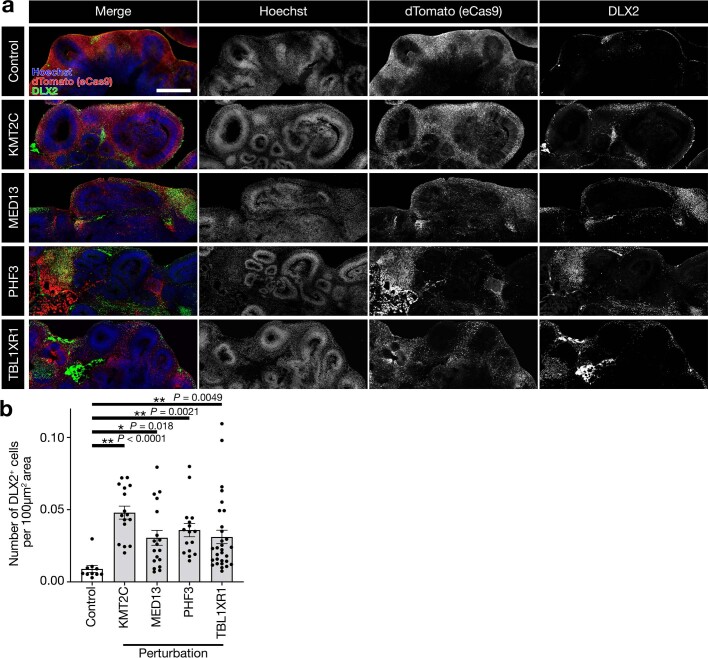
“Perturbation of KMT2C, for example, led to a strong enrichment of ventral cells.”
§ Single-cell brain organoid screening identifies developmental defects in autism > Cell-type-specific effects of perturbing ASD genes
boosteddirectn = 11- Asserted: passes — The authors put it forward as true.
- Checkable: passes — It can be checked against evidence.
- Load-bearing: unclear — It is unclear whether the paper’s conclusions depend on it.
- Based: passes — The paper gives a reason why it holds.
A result the paper reports from its own data — it cites no other source for it, so there is none to check. The quote shows it is in the paper.
In the paper
“In the ventral cell populations, the most frequently detected DEG is the adhesion molecule gene CSMD1 (Fig. 3a,b), which is upregulated by ARID1B, CIC, MED13 and PHF3 perturbations and downregulated by LEO1 and KMT2C perturbations.”
§ Single-cell brain organoid screening identifies developmental defects in autism > Altered gene expression upon ASD gene perturbation
plaindirect- Asserted: passes — The authors put it forward as true.
- Checkable: passes — It can be checked against evidence.
- Load-bearing: unclear — It is unclear whether the paper’s conclusions depend on it.
- Based: passes — The paper gives a reason why it holds.
A result the paper reports from its own data — it cites no other source for it, so there is none to check. The quote shows it is in the paper.
In the paper
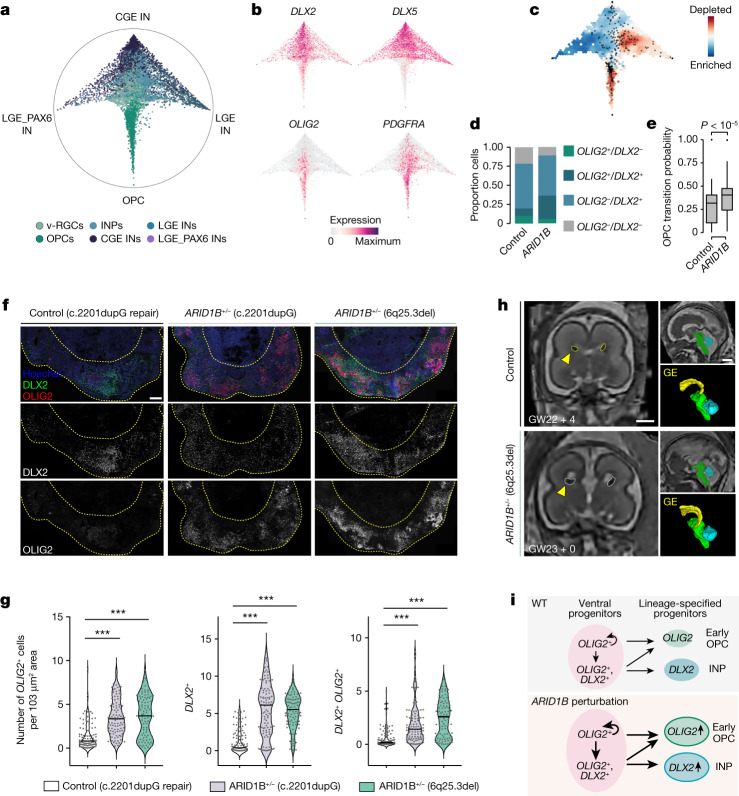
“We then analysed the fate transition probabilities of ventral progenitors and found that ARID1B-perturbed v-RGCs have significantly higher transition probabilities towards early OPCs than neuronal fates (Fig. 4e).”
§ Single-cell brain organoid screening identifies developmental defects in autism > Effects of ARID1B perturbation on v-RGCs
plaincorrelational- Asserted: passes — The authors put it forward as true.
- Checkable: passes — It can be checked against evidence.
- Load-bearing: passes — The paper’s conclusions depend on it.
- Based: passes — The paper gives a reason why it holds.
A result the paper reports from its own data — it cites no other source for it, so there is none to check. The quote shows it is in the paper.
In the paper
“Furthermore, we analysed specific neuronal subpopulations and found that L2/3 excitatory neurons were more impacted and depleted in the majority of perturbations (Fig. 2c).”
§ Single-cell brain organoid screening identifies developmental defects in autism > Cell-type-specific effects of perturbing ASD genes
plaindirect- Asserted: passes — The authors put it forward as true.
- Checkable: passes — It can be checked against evidence.
- Load-bearing: passes — The paper’s conclusions depend on it.
- Based: passes — The paper gives a reason why it holds.
A result the paper reports from its own data — it cites no other source for it, so there is none to check. The quote shows it is in the paper.
In the paper
“We found significant enrichment for a set of 40 TFs (adjusted Fisher test P < 0.01, more than twofold enrichment; for example, EOMES, OLIG1, DLX2) (Extended Data Fig. 14j), among which 14 TFs were encoded by ASD risk genes (for example, NFIA, BCL11A, MEF2C) (Fig. 3e).”
§ Single-cell brain organoid screening identifies developmental defects in autism > ASD-associated regulatory modules
plaincorrelational- Asserted: passes — The authors put it forward as true.
- Checkable: passes — It can be checked against evidence.
- Load-bearing: passes — The paper’s conclusions depend on it.
- Based: passes — The paper gives a reason why it holds.
A result the paper reports from its own data — it cites no other source for it, so there is none to check. The quote shows it is in the paper.
In the paper
“We ranked DEGs by detection frequency and discovered that many genes were differentially expressed in multiple perturbations (Fig. 3b).”
§ Single-cell brain organoid screening identifies developmental defects in autism > Altered gene expression upon ASD gene perturbation
plaincorrelational- Asserted: passes — The authors put it forward as true.
- Checkable: passes — It can be checked against evidence.
- Load-bearing: unclear — It is unclear whether the paper’s conclusions depend on it.
- Based: passes — The paper gives a reason why it holds.
A result the paper reports from its own data — it cites no other source for it, so there is none to check. The quote shows it is in the paper.
In the paper
“Among the 36 genes, we found that ARID1B perturbation caused one of the most significant enrichments of v-RGCs (Fig. 2c).”
§ Single-cell brain organoid screening identifies developmental defects in autism > Effects of ARID1B perturbation on v-RGCs
plaindirect- Asserted: passes — The authors put it forward as true.
- Checkable: passes — It can be checked against evidence.
- Load-bearing: passes — The paper’s conclusions depend on it.
- Based: passes — The paper gives a reason why it holds.
A result the paper reports from its own data — it cites no other source for it, so there is none to check. The quote shows it is in the paper.
In the paper
“In addition, LGE PAX6+ interneurons were depleted by PHF3 perturbation.”
§ Single-cell brain organoid screening identifies developmental defects in autism > Cell-type-specific effects of perturbing ASD genes
plaindirect- Asserted: passes — The authors put it forward as true.
- Checkable: passes — It can be checked against evidence.
- Load-bearing: passes — The paper’s conclusions depend on it.
- Based: passes — The paper gives a reason why it holds.
A result the paper reports from its own data — it cites no other source for it, so there is none to check. The quote shows it is in the paper.
In the paper
“All TF regulatory modules enriched in SFARI genes together form an ASD-associated sub-GRN (Supplementary Data 6).”
§ Single-cell brain organoid screening identifies developmental defects in autism > ASD-associated regulatory modules
plaincorrelational- Asserted: passes — The authors put it forward as true.
- Checkable: passes — It can be checked against evidence.
- Load-bearing: passes — The paper’s conclusions depend on it.
- Based: passes — The paper gives a reason why it holds.
A result the paper reports from its own data — it cites no other source for it, so there is none to check. The quote shows it is in the paper.
In the paper
“For 24 perturbations, we detected significant changes in the ratio of dorsal to ventral cells (Fig. 2c).”
§ Single-cell brain organoid screening identifies developmental defects in autism > Cell-type-specific effects of perturbing ASD genes
plaincorrelationaln = 11- Asserted: passes — The authors put it forward as true.
- Checkable: passes — It can be checked against evidence.
- Load-bearing: passes — The paper’s conclusions depend on it.
- Based: passes — The paper gives a reason why it holds.
A result the paper reports from its own data — it cites no other source for it, so there is none to check. The quote shows it is in the paper.
In the paper
“Beyond neuronal cell clusters, we found that astrocytes were significantly enriched in CIC perturbation.”
§ Single-cell brain organoid screening identifies developmental defects in autism > Cell-type-specific effects of perturbing ASD genes
plaincorrelational- Asserted: passes — The authors put it forward as true.
- Checkable: passes — It can be checked against evidence.
- Load-bearing: passes — The paper’s conclusions depend on it.
- Based: passes — The paper gives a reason why it holds.
A result the paper reports from its own data — it cites no other source for it, so there is none to check. The quote shows it is in the paper.
In the paper
“Additionally, we observed an enrichment of v-RGCs and/or ccv-RGCs in 10 perturbations (for example, ARID1B, BCL11A and DEAF1) and an enrichment of INPs in 10 perturbations (for example, ILF2, MED13 and TCF20).”
§ Single-cell brain organoid screening identifies developmental defects in autism > Cell-type-specific effects of perturbing ASD genes
plaincorrelational- Asserted: passes — The authors put it forward as true.
- Checkable: passes — It can be checked against evidence.
- Load-bearing: passes — The paper’s conclusions depend on it.
- Based: passes — The paper gives a reason why it holds.
A result the paper reports from its own data — it cites no other source for it, so there is none to check. The quote shows it is in the paper.
In the paper
“We found significant enrichment for a set of 40 TFs (adjusted Fisher test P < 0.01, more than twofold enrichment; for example, EOMES, OLIG1, DLX2) (Extended Data Fig. 14j), among which 14 TFs were encoded by ASD risk genes (for example, NFIA, BCL11A, MEF2C) (Fig. 3e).”
§ Single-cell brain organoid screening identifies developmental defects in autism > ASD-associated regulatory modules
plaincorrelational- Asserted: passes — The authors put it forward as true.
- Checkable: passes — It can be checked against evidence.
- Load-bearing: passes — The paper’s conclusions depend on it.
- Based: passes — The paper gives a reason why it holds.
A result the paper reports from its own data — it cites no other source for it, so there is none to check. The quote shows it is in the paper.
In the paper
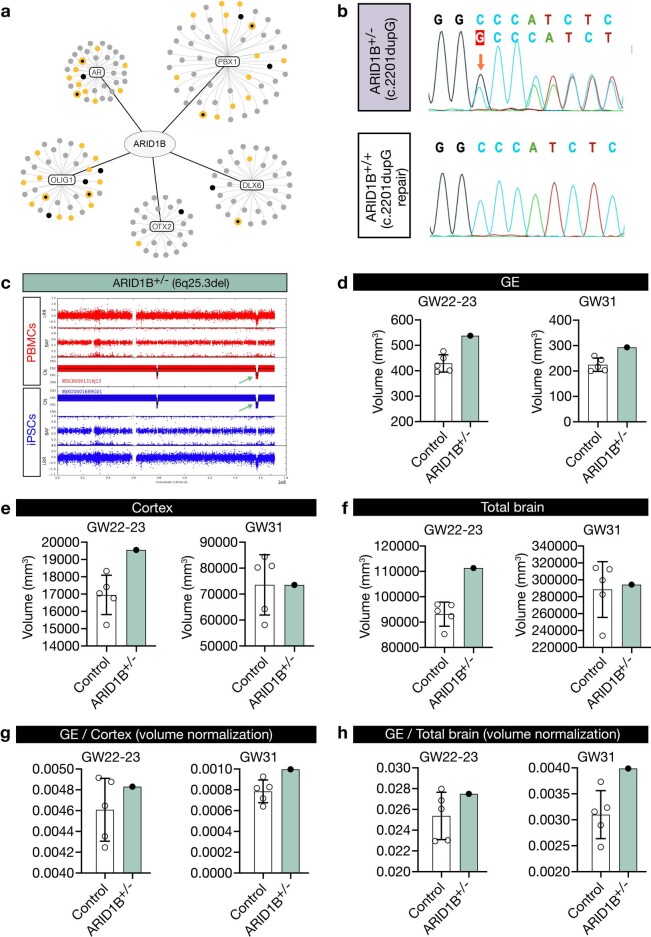
“Notably, the OLIG1 regulatory module was also enriched in DEGs caused by ARID1B perturbation (Extended Data Fig. 15a).”
§ Single-cell brain organoid screening identifies developmental defects in autism > Effects of ARID1B perturbation on v-RGCs
plaincorrelational- Asserted: passes — The authors put it forward as true.
- Checkable: passes — It can be checked against evidence.
- Load-bearing: unclear — It is unclear whether the paper’s conclusions depend on it.
- Based: passes — The paper gives a reason why it holds.
A result the paper reports from its own data — it cites no other source for it, so there is none to check. The quote shows it is in the paper.
In the paper
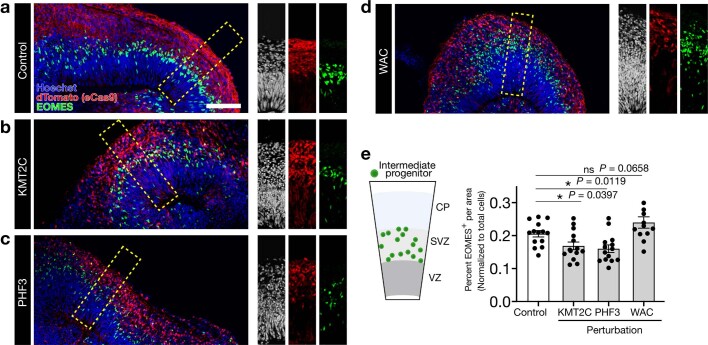
“Among the progenitors, we identified IPC depletion as a strong, convergent effect in 12 perturbations (Fig. 2c) (for example, CHD2, KAT2B and KMT2C).”
§ Single-cell brain organoid screening identifies developmental defects in autism > Cell-type-specific effects of perturbing ASD genes
boosteddirect- Asserted: passes — The authors put it forward as true.
- Checkable: passes — It can be checked against evidence.
- Load-bearing: passes — The paper’s conclusions depend on it.
- Based: passes — The paper gives a reason why it holds.
A result the paper reports from its own data — it cites no other source for it, so there is none to check. The quote shows it is in the paper.
In the paper
“We visualized this GRN on the level of TFs using a uniform manifold approximation and projection (UMAP) embedding42, which revealed distinct TF groups active in neural progenitor cells (PAX6, GLI3), inhibitory neurons (DLX2, DLX6) and excitatory neurons (NEUROD2, NFIB, SATB2) as well as regulatory interactions between the TFs (Fig. 3e).”
§ Single-cell brain organoid screening identifies developmental defects in autism > ASD-associated regulatory modules
plaincorrelational- Asserted: passes — The authors put it forward as true.
- Checkable: passes — It can be checked against evidence.
- Load-bearing: unclear — It is unclear whether the paper’s conclusions depend on it.
- Based: passes — The paper gives a reason why it holds.
A result the paper reports from its own data — it cites no other source for it, so there is none to check. The quote shows it is in the paper.
In the paper
“Notably, most perturbations (21 of 24) lowered the dorsal-to-ventral ratio.”
§ Single-cell brain organoid screening identifies developmental defects in autism > Cell-type-specific effects of perturbing ASD genes
plaindirect- Asserted: passes — The authors put it forward as true.
- Checkable: passes — It can be checked against evidence.
- Load-bearing: passes — The paper’s conclusions depend on it.
- Based: passes — The paper gives a reason why it holds.
A result the paper reports from its own data — it cites no other source for it, so there is none to check. The quote shows it is in the paper.
In the paper
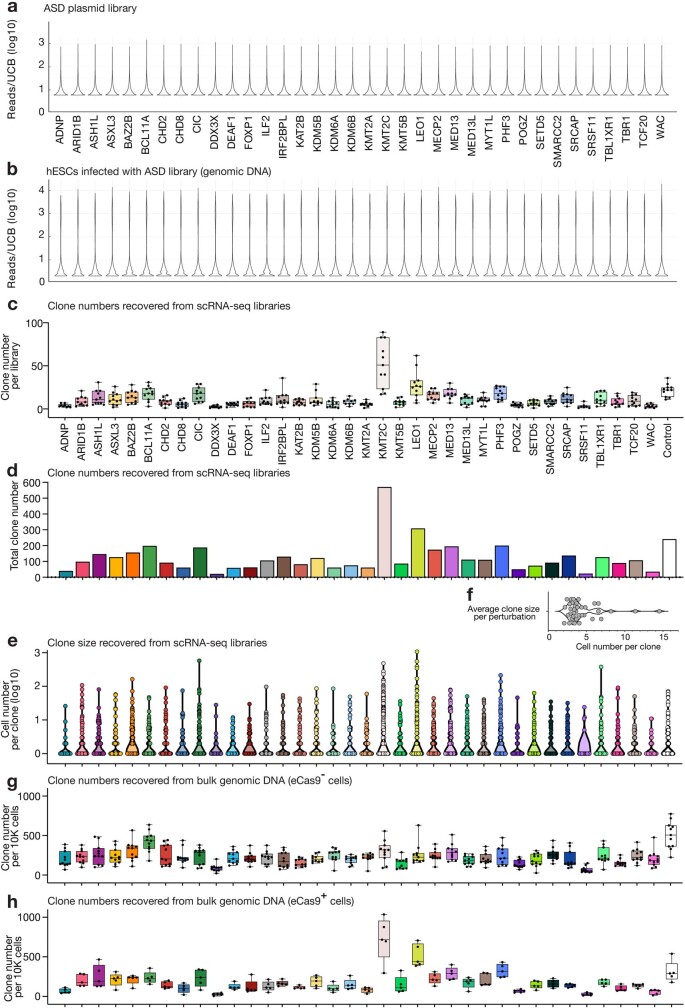
“Analysing the size of each clone, we found a mean average cell number per clone of 4.4 (Extended Data Fig. 4e,f).”
§ Single-cell brain organoid screening identifies developmental defects in autism > Cell proliferation and depletion phenotypes
plain- Asserted: passes — The authors put it forward as true.
- Checkable: passes — It can be checked against evidence.
- Load-bearing: passes — The paper’s conclusions depend on it.
- Based: passes — The paper gives a reason why it holds.
A result the paper reports from its own data — it cites no other source for it, so there is none to check. The quote shows it is in the paper.
In the paper
“Perturbation of ARID1B increases the transition of v-RGCs to early OPCs.”
- Also stated in: § Discussion · plain
“We discovered that loss of ARID1B leads to increased transition of ventral progenitors to early OPCs.”
§ Single-cell brain organoid screening identifies developmental defects in autism > Effects of ARID1B perturbation on v-RGCs
plaindirectn = 46- Asserted: passes — The authors put it forward as true.
- Checkable: passes — It can be checked against evidence.
- Load-bearing: passes — The paper’s conclusions depend on it.
- Based: passes — The paper gives a reason why it holds.
- Also stated in: § Discussion · plain
A result the paper reports from its own data — it cites no other source for it, so there is none to check. The quote shows it is in the paper.
In the paper
“When combining the TOP-DEGs from all perturbations, we found that they were significantly enriched in risk genes associated with ASD (SFARI database, 1,031 genes; approximately twofold enrichment, Fisher exact test P < 10−5 against genes expressed in 5% of cells as background) (Fig. 3d and Supplementary Data 2).”
§ Single-cell brain organoid screening identifies developmental defects in autism > ASD-associated regulatory modules
plaincorrelational- Asserted: passes — The authors put it forward as true.
- Checkable: passes — It can be checked against evidence.
- Load-bearing: passes — The paper’s conclusions depend on it.
- Based: passes — The paper gives a reason why it holds.
A result the paper reports from its own data — it cites no other source for it, so there is none to check. The quote shows it is in the paper.
In the paper
“We found that progenitors, including IPCs and INPs, as well as L2/3 excitatory neuronss, were among the most affected cell types.”
§ Single-cell brain organoid screening identifies developmental defects in autism > Cell-type-specific effects of perturbing ASD genes
plaincorrelational- Asserted: passes — The authors put it forward as true.
- Checkable: passes — It can be checked against evidence.
- Load-bearing: passes — The paper’s conclusions depend on it.
- Based: passes — The paper gives a reason why it holds.
A result the paper reports from its own data — it cites no other source for it, so there is none to check. The quote shows it is in the paper.
In the paper
“To explore these potential gene regulatory ‘hubs’, we first generated single-cell multiome data, including single-cell transcriptome and chromatin accessibility modalities, from 4-month-old cerebral organoids (Extended Data Fig. 14a–g).”
§ Single-cell brain organoid screening identifies developmental defects in autism > ASD-associated regulatory modules
plain- Asserted: passes — The authors put it forward as true.
- Checkable: passes — It can be checked against evidence.
- Load-bearing: passes — The paper’s conclusions depend on it.
- Based: passes — The paper gives a reason why it holds.
A result the paper reports from its own data — it cites no other source for it, so there is none to check. The quote shows it is in the paper.
In the paper
“In line with our previous findings, we observed considerably increased OLIG2 +, DLX2 + and DLX2 + OLIG2 + cells in 40-day-old organoids from both patients compared with control organoids (Fig. 4f,g).”
§ Single-cell brain organoid screening identifies developmental defects in autism > Effects of ARID1B perturbation on v-RGCs
plaincorrelationaln = 2- Asserted: passes — The authors put it forward as true.
- Checkable: passes — It can be checked against evidence.
- Load-bearing: passes — The paper’s conclusions depend on it.
- Based: passes — The paper gives a reason why it holds.
A result the paper reports from its own data — it cites no other source for it, so there is none to check. The quote shows it is in the paper.
In the paper
“Among the ventral telencephalon cells, we have identified strong enrichment of v-RGCs, ccv-RGCs and INPs, which are progenitors that differentiate into interneurons and oligodendrocytes44,51.”
§ Single-cell brain organoid screening identifies developmental defects in autism > Discussion
boostedcorrelational- Asserted: passes — The authors put it forward as true.
- Checkable: passes — It can be checked against evidence.
- Load-bearing: unclear — It is unclear whether the paper’s conclusions depend on it.
- Based: passes — The paper gives a reason why it holds.
A result the paper reports from its own data — it cites no other source for it, so there is none to check. The quote shows it is in the paper.
In the paper
“IPCs, transit-amplifying dorsal progenitors that generate neurons for all cortical layers and contribute to the evolutionary expansion of the human cortex49,50, appeared to be particularly susceptible to ASD genetic perturbations.”
§ Single-cell brain organoid screening identifies developmental defects in autism > Discussion
hedgedcorrelational- Asserted: passes — The authors put it forward as true.
- Checkable: passes — It can be checked against evidence.
- Load-bearing: passes — The paper’s conclusions depend on it.
- Based: passes — The paper gives a reason why it holds.
A result the paper reports from its own data — it cites no other source for it, so there is none to check. The quote shows it is in the paper.
In the paper
“The OLIG1 module is particularly interesting as many of its downstream targets are ASD risk genes.”
§ Single-cell brain organoid screening identifies developmental defects in autism > Discussion
plaincorrelational- Asserted: passes — The authors put it forward as true.
- Checkable: passes — It can be checked against evidence.
- Load-bearing: unclear — It is unclear whether the paper’s conclusions depend on it.
- Based: passes — The paper gives a reason why it holds.
A result the paper reports from its own data — it cites no other source for it, so there is none to check. The quote shows it is in the paper.
In the paper
“Importantly, perturbations of three BAF complex members (ARID1B, BCL11A and SMARRC2) all lead to enrichment of v-RGCs”
§ Single-cell brain organoid screening identifies developmental defects in autism > Discussion
plaindirect- Asserted: passes — The authors put it forward as true.
- Checkable: passes — It can be checked against evidence.
- Load-bearing: passes — The paper’s conclusions depend on it.
- Based: passes — The paper gives a reason why it holds.
A result the paper reports from its own data — it cites no other source for it, so there is none to check. The quote shows it is in the paper.
In the paper
“In our screen, we assessed 19 ASD genes known to be involved in epigenetic regulation. Despite their broad role in cell differentiation, perturbations of these genes impacted specific cell types and biological processes during brain development.”
§ Single-cell brain organoid screening identifies developmental defects in autism > Discussion
plaindirect- Asserted: passes — The authors put it forward as true.
- Checkable: passes — It can be checked against evidence.
- Load-bearing: passes — The paper’s conclusions depend on it.
- Based: passes — The paper gives a reason why it holds.
A result the paper reports from its own data — it cites no other source for it, so there is none to check. The quote shows it is in the paper.
In the paper
“Furthermore, our findings indicate that L2/3 excitatory neurons are more vulnerable than other neuronal populations to ASD perturbations.”
§ Single-cell brain organoid screening identifies developmental defects in autism > Discussion
hedgedcorrelational- Asserted: passes — The authors put it forward as true.
- Checkable: passes — It can be checked against evidence.
- Load-bearing: passes — The paper’s conclusions depend on it.
- Based: passes — The paper gives a reason why it holds.
A result the paper reports from its own data — it cites no other source for it, so there is none to check. The quote shows it is in the paper.
In the paper
“By employing a pooled CRISPR screening system in conjunction with validation, our study provides a developmental and cell type-specific phenotypic database for ASD gene loss-of-function research.”
§ Single-cell brain organoid screening identifies developmental defects in autism > Discussion
plain- Asserted: passes — The authors put it forward as true.
- Checkable: passes — It can be checked against evidence.
- Load-bearing: passes — The paper’s conclusions depend on it.
- Based: passes — The paper gives a reason why it holds.
A result the paper reports from its own data — it cites no other source for it, so there is none to check. The quote shows it is in the paper.
In the paper
“DEG and gene ontology enrichment analyses revealed both common and distinct molecular processes impaired in different perturbations”
§ Single-cell brain organoid screening identifies developmental defects in autism > Discussion
plaincorrelational- Asserted: passes — The authors put it forward as true.
- Checkable: passes — It can be checked against evidence.
- Load-bearing: passes — The paper’s conclusions depend on it.
- Based: passes — The paper gives a reason why it holds.
In the paper
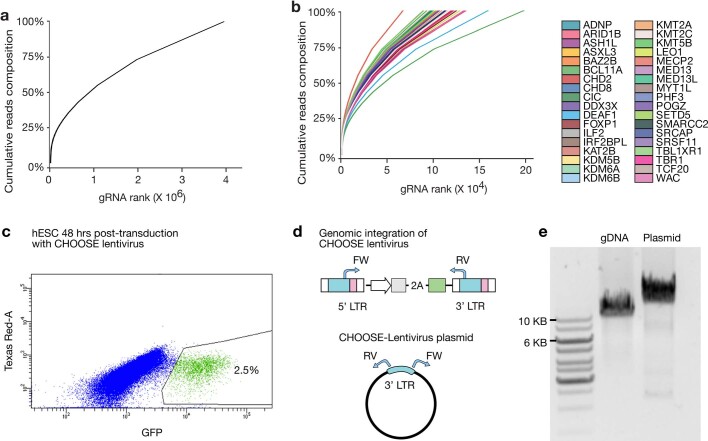
“To ensure that lentiviral integration frequency was limited to one per cell, weused a low infection rate of 2.5% (ref. 18)”
§ Single-cell brain organoid screening identifies developmental defects in autism > Single-cell CRISPR screening in barcoded organoids
What the sources say
- Not checked — no full text of the sourcecites [18] Doench, J. G. Am I ready for CRISPR? A user’s guide to genetic screens. Nat. Rev. Genet. 19, 67–80 (2018). source
plaindirect- Asserted: passes — The authors put it forward as true.
- Checkable: passes — It can be checked against evidence.
- Load-bearing: passes — The paper’s conclusions depend on it.
- Based: passes — The paper gives a reason why it holds.
A conclusion the paper draws from its own results — it cites no other source for it, so there is none to check. The quote shows it is in the paper.
In the paper
“It is likely that this could limit the mutant cell–cell interactions within the mosaic tissues.”
§ Single-cell brain organoid screening identifies developmental defects in autism > CHOOSE organoids generate diverse cell types
hedgedconditional- Asserted: passes — The authors put it forward as true.
- Checkable: passes — It can be checked against evidence.
- Load-bearing: unclear — It is unclear whether the paper’s conclusions depend on it.
- Based: passes — The paper gives a reason why it holds.
A conclusion the paper draws from its own results — it cites no other source for it, so there is none to check. The quote shows it is in the paper.
In the paper
“In summary, our scRNA-seq dataset of 4-month-old cerebral organoids recapitulates diverse telencephalic cell types that are present in the developing human brain.”
§ Single-cell brain organoid screening identifies developmental defects in autism > CHOOSE organoids generate diverse cell types
plain- Asserted: passes — The authors put it forward as true.
- Checkable: passes — It can be checked against evidence.
- Load-bearing: passes — The paper’s conclusions depend on it.
- Based: passes — The paper gives a reason why it holds.
What the paper did — it cites no source for this, so there is none to check. The quote shows it is in the paper.
In the paper
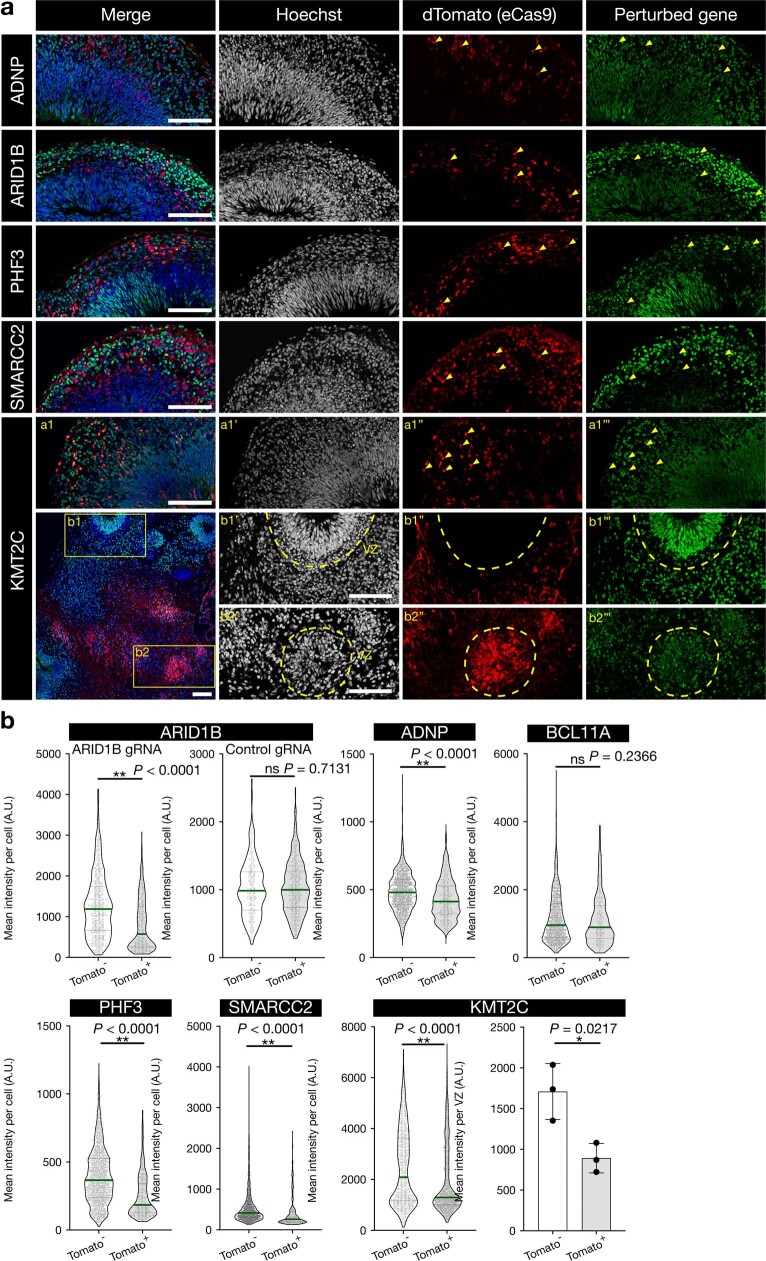
“Immunohistochemistry analysis of several perturbations in organoids further confirmed the loss of protein products for the majority of selected gRNAs (Extended Data Fig. 2).”
§ Single-cell brain organoid screening identifies developmental defects in autism > Single-cell CRISPR screening in barcoded organoids
plaindirect- Asserted: passes — The authors put it forward as true.
- Checkable: passes — It can be checked against evidence.
- Load-bearing: unclear — It is unclear whether the paper’s conclusions depend on it.
- Based: passes — The paper gives a reason why it holds.
A conclusion the paper draws from its own results — it cites no other source for it, so there is none to check. The quote shows it is in the paper.
In the paper
“Altogether, we established a highly efficient and controlled pooled screening system with high clonal complexity in the organoid.”
§ Single-cell brain organoid screening identifies developmental defects in autism > Single-cell CRISPR screening in barcoded organoids
plain- Asserted: passes — The authors put it forward as true.
- Checkable: passes — It can be checked against evidence.
- Load-bearing: passes — The paper’s conclusions depend on it.
- Based: passes — The paper gives a reason why it holds.
What the paper did — it cites no source for this, so there is none to check. The quote shows it is in the paper.
In the paper
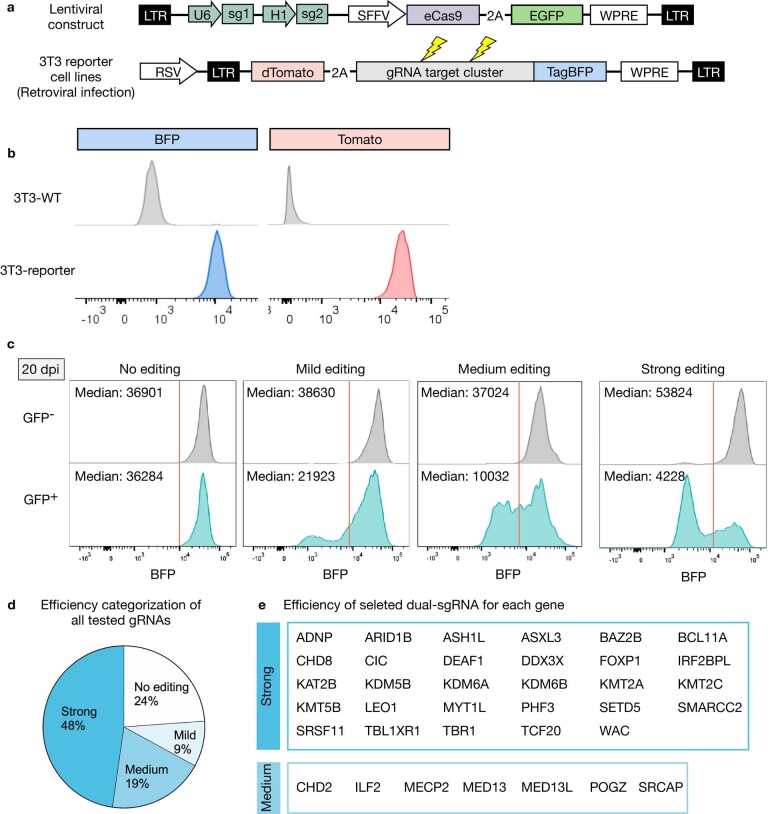
“Using our reporter assay, we selected efficient sgRNA pairs for 36 ASD genes (Extended Data Fig. 1d,e and Supplementary Table 1).”
§ Single-cell brain organoid screening identifies developmental defects in autism > Single-cell CRISPR screening in barcoded organoids
plaindirect- Asserted: passes — The authors put it forward as true.
- Checkable: passes — It can be checked against evidence.
- Load-bearing: passes — The paper’s conclusions depend on it.
- Based: passes — The paper gives a reason why it holds.
A conclusion the paper draws from its own results — it cites no other source for it, so there is none to check. The quote shows it is in the paper.
In the paper
“Notably, some of the ASD-associated TF modules were among the most strongly enriched in CHOOSE DEGs, supporting their role in ASD-associated gene dysregulation (Fig. 3f).”
§ Single-cell brain organoid screening identifies developmental defects in autism > ASD-associated regulatory modules
boostedcorrelational- Asserted: passes — The authors put it forward as true.
- Checkable: passes — It can be checked against evidence.
- Load-bearing: passes — The paper’s conclusions depend on it.
- Based: passes — The paper gives a reason why it holds.
A conclusion the paper draws from its own results — it cites no other source for it, so there is none to check. The quote shows it is in the paper.
In the paper
“These data suggest that cells captured in the CHOOSE screen came from diverse and relatively small clones, which are crucial for mitigating dominant clonal effects.”
§ Single-cell brain organoid screening identifies developmental defects in autism > Cell proliferation and depletion phenotypes
hedgeddirect- Asserted: passes — The authors put it forward as true.
- Checkable: passes — It can be checked against evidence.
- Load-bearing: passes — The paper’s conclusions depend on it.
- Based: passes — The paper gives a reason why it holds.
A conclusion the paper draws from its own results — it cites no other source for it, so there is none to check. The quote shows it is in the paper.
In the paper
“Furthermore, our data indicate that ASD pathology could emerge as early as the neural progenitor stage.”
§ Single-cell brain organoid screening identifies developmental defects in autism > Cell-type-specific effects of perturbing ASD genes
hedgedconditional- Asserted: passes — The authors put it forward as true.
- Checkable: passes — It can be checked against evidence.
- Load-bearing: passes — The paper’s conclusions depend on it.
- Based: passes — The paper gives a reason why it holds.
A conclusion the paper draws from its own results — it cites no other source for it, so there is none to check. The quote shows it is in the paper.
In the paper
“suggesting that certain biological processes and regulatory programs might be specifically relevant to ASD-associated gene perturbations.”
§ Single-cell brain organoid screening identifies developmental defects in autism > ASD-associated regulatory modules
hedgedcorrelational- Asserted: passes — The authors put it forward as true.
- Checkable: passes — It can be checked against evidence.
- Load-bearing: passes — The paper’s conclusions depend on it.
- Based: passes — The paper gives a reason why it holds.
A conclusion the paper draws from its own results — it cites no other source for it, so there is none to check. The quote shows it is in the paper.
In the paper
“These data indicate an interneuron subtype-specific response to ASD genetic perturbations.”
§ Single-cell brain organoid screening identifies developmental defects in autism > Cell-type-specific effects of perturbing ASD genes
hedgedcorrelational- Asserted: passes — The authors put it forward as true.
- Checkable: passes — It can be checked against evidence.
- Load-bearing: passes — The paper’s conclusions depend on it.
- Based: passes — The paper gives a reason why it holds.
A conclusion the paper draws from its own results — it cites no other source for it, so there is none to check. The quote shows it is in the paper.
In the paper
“In conclusion, using a pooled, high-complexity barcoding screening system, we successfully identified ASD risk genes that play essential roles in cell proliferation and survival.”
§ Single-cell brain organoid screening identifies developmental defects in autism > Cell proliferation and depletion phenotypes
boosteddirect- Asserted: passes — The authors put it forward as true.
- Checkable: passes — It can be checked against evidence.
- Load-bearing: passes — The paper’s conclusions depend on it.
- Based: passes — The paper gives a reason why it holds.
A conclusion the paper draws from its own results — it cites no other source for it, so there is none to check. The quote shows it is in the paper.
In the paper
“Collectively, the CHOOSE system allowed us to simultaneously investigate the effects of multiple ASD genes on cell fate determination.”
§ Single-cell brain organoid screening identifies developmental defects in autism > Cell-type-specific effects of perturbing ASD genes
plaindirect- Asserted: passes — The authors put it forward as true.
- Checkable: passes — It can be checked against evidence.
- Load-bearing: passes — The paper’s conclusions depend on it.
- Based: passes — The paper gives a reason why it holds.
A conclusion the paper draws from its own results — it cites no other source for it, so there is none to check. The quote shows it is in the paper.
In the paper
“The enrichment of OLIG1 and EOMES regulomes suggests potentially vulnerable cell fate specification-related regulatory networks upon ASD genetic perturbations.”
§ Single-cell brain organoid screening identifies developmental defects in autism > ASD-associated regulatory modules
hedgedconditional- Asserted: passes — The authors put it forward as true.
- Checkable: passes — It can be checked against evidence.
- Load-bearing: passes — The paper’s conclusions depend on it.
- Based: passes — The paper gives a reason why it holds.
- Rests on an assumption: OLIG1 is preferentially expressed in the ventral telencephalon and is a key regulator for interneuron and oligodendrocyte lineages.
- Rests on an assumption: EOMES is a key transcription factor for the fate specification of intermediate progenitor cells in the dorsal telencephalon.
What the paper did — it cites no source for this, so there is none to check. The quote shows it is in the paper.
In the paper
“We observed that most effects detected at the single-cell level were also largely consistent across organoids grown from different batches, further supporting the robustness and reproducibility of our system.”
§ Single-cell brain organoid screening identifies developmental defects in autism > Cell-type-specific effects of perturbing ASD genes
plaincorrelational- Asserted: passes — The authors put it forward as true.
- Checkable: passes — It can be checked against evidence.
- Load-bearing: passes — The paper’s conclusions depend on it.
- Based: passes — The paper gives a reason why it holds.
In the paper
“This module was previously identified as crucial for oligodendrocyte differentiation in the developing human cortex22, highlighting the involvement of the oligodendrocytes in ASD pathophysiology.”
§ Single-cell brain organoid screening identifies developmental defects in autism > Discussion
What the sources say
- Not checked — no full text of the sourcecites [22] Trevino, A. E. et al. Chromatin and gene-regulatory dynamics of the developing human cerebral cortex at single-cell resolution. Cell 184, 5053–5069.e23 (2021). source
plaindirect- Asserted: passes — The authors put it forward as true.
- Checkable: passes — It can be checked against evidence.
- Load-bearing: passes — The paper’s conclusions depend on it.
- Based: passes — The paper gives a reason why it holds.
A conclusion the paper draws from its own results — it cites no other source for it, so there is none to check. The quote shows it is in the paper.
In the paper
“indicating the critical role of the BAF complex in regulating ventral telencephalon cell fate specification.”
§ Single-cell brain organoid screening identifies developmental defects in autism > Discussion
hedgeddirect- Asserted: passes — The authors put it forward as true.
- Checkable: passes — It can be checked against evidence.
- Load-bearing: passes — The paper’s conclusions depend on it.
- Based: passes — The paper gives a reason why it holds.
A conclusion the paper draws from its own results — it cites no other source for it, so there is none to check. The quote shows it is in the paper.
In the paper
“The enlarged volume of GE in the patient with an ARID1B mutation is consistent with these observations.”
§ Single-cell brain organoid screening identifies developmental defects in autism > Effects of ARID1B perturbation on v-RGCs
plaincorrelationalSingle case- Asserted: passes — The authors put it forward as true.
- Checkable: passes — It can be checked against evidence.
- Load-bearing: unclear — It is unclear whether the paper’s conclusions depend on it.
- Based: passes — The paper gives a reason why it holds.
A conclusion the paper draws from its own results — it cites no other source for it, so there is none to check. The quote shows it is in the paper.
In the paper
“highlighting the involvement of the oligodendrocytes in ASD pathophysiology.”
§ Single-cell brain organoid screening identifies developmental defects in autism > Discussion
plaincorrelational- Asserted: passes — The authors put it forward as true.
- Checkable: passes — It can be checked against evidence.
- Load-bearing: passes — The paper’s conclusions depend on it.
- Based: passes — The paper gives a reason why it holds.
A conclusion the paper draws from its own results — it cites no other source for it, so there is none to check. The quote shows it is in the paper.
In the paper
“The combination of high-content perturbation screening and validation in a patient-specific context exemplifies the effectiveness of employing organoid systems to study NDDs.”
§ Single-cell brain organoid screening identifies developmental defects in autism > Discussion
plaindirect- Asserted: passes — The authors put it forward as true.
- Checkable: unclear — It is unclear whether it could be checked against evidence.
- Load-bearing: passes — The paper’s conclusions depend on it.
- Based: passes — The paper gives a reason why it holds.
- It may state two separate claims as one. 38
- Probably not a substantial claim. 23
- The quote only partly states this claim. 1
Every source the paper cites for this claim was checked and supports it.
In the paper
“Although organoids have been used to investigate disease-associated genes9–11, they are limited by phenotypic variability and low throughput.”
§ Single-cell brain organoid screening identifies developmental defects in autism > Main
What the sources say
- Supportedcites [9] Lancaster, M. A. et al. Cerebral organoids model human brain development and microcephaly. Nature 501, 373–379 (2013). source
The citation is attached to the statement that organoids have been used to investigate disease-associated genes, not to the subsequent claim about phenotypic variability and low throughput. The Introduction and Discussion describe using cerebral organoids to investigate CDK5RAP2-dependent microcephaly, supporting the cited use. (LLM, conf=0.93)
- Supportedcites [10] Mariani, J. et al. FOXG1-dependent dysregulation of GABA/glutamate neuron differentiation in autism spectrum disorders. Cell 162, 375–390 (2015). source
The citation is attached to the statement that organoids have been used to investigate disease-associated genes, not to the subsequent claim about phenotypic variability and low throughput. In Results, the paper describes using ASD-derived organoids to test FOXG1’s role in abnormal neuronal differentiation. It does not need to establish the limitations asserted in the uncited clause. (LLM, conf=0.92)
- Supportedcites [11] Paulsen, B. et al. Autism genes converge on asynchronous development of shared neuron classes. Nature 602, 268–273 (2022). source
The citation is attached to the statement that organoids have been used to investigate disease-associated genes, not to the subsequent statement about phenotypic variability and low throughput. In Results, “Organoids as models of ASD risk genes,” the paper describes using cortical organoids to investigate mutations in three ASD risk genes. No page number is available in our copy. (LLM, conf=0.92)
plain- Asserted: passes — The authors put it forward as true.
- Checkable: passes — It can be checked against evidence.
- Load-bearing: passes — The paper’s conclusions depend on it.
- Based: passes — The paper gives a reason why it holds.
It may state two separate claims as one.
- Supported
The cited sources support only part of this claim — read each source’s verdict below.
In the paper
“We used previously established protocols that reproducibly generate human telencephalon organoids23,24 (Extended Data Fig. 5a–c).”
§ Single-cell brain organoid screening identifies developmental defects in autism > CHOOSE organoids generate diverse cell types
What the sources say
- Supportedcites [23] Lancaster, M. A. et al. Guided self-organization and cortical plate formation in human brain organoids. Nat. Biotechnol. 35, 659–666 (2017). source
The Abstract describes a microfilament-based organoid method that reproducibly generates human forebrain tissue. It also reports more reproducible formation of Foxg1-positive forebrain regions in these organoids, supporting the citation's use of this paper as an established protocol. (LLM, conf=0.90)
- Partly supportedcites [24] Eichmüller, O. L. et al. Amplification of human interneuron progenitors promotes brain tumors and neurological defects. Science 375, eabf5546 (2022). sourceExperimental — accuracy not yet measured
The Organoid generation section describes generating human organoids and patterning them toward dorsal or ventral brain regions using previously described methods. The CLIP cells section also reports using patterning protocols to generate dorsal and ventral forebrain organoids. Our copy does not establish that those protocols reproducibly generate organoids, so that part of the claim remains unsupported. (LLM, conf=0.82)
plaindirect- Asserted: passes — The authors put it forward as true.
- Checkable: passes — It can be checked against evidence.
- Load-bearing: fails — The paper’s conclusions may not depend on it.
- Based: passes — The paper gives a reason why it holds.
Probably not a substantial claim. The paper’s conclusions may not depend on it.
- Supported
Every source the paper cites for this claim was checked and supports it.
In the paper
“Aberrant cell proliferation during brain development has been suggested to contribute to ASD pathology33.”
§ Single-cell brain organoid screening identifies developmental defects in autism > Cell proliferation and depletion phenotypes
What the sources say
- Supportedcites [33] Courchesne, E. et al. The ASD Living Biology: from cell proliferation to clinical phenotype. Mol. Psychiatr. 24, 88–107 (2019). source
The Introduction states that abnormal prenatal cell proliferation has been hypothesized to underlie early brain-growth defects in ASD. The Conclusions further describe dysregulated proliferation as a potential early perturbation with downstream effects on neural development, supporting the citing sentence’s hedged claim. (LLM, conf=0.94)
hedgedconditional- Asserted: passes — The authors put it forward as true.
- Checkable: passes — It can be checked against evidence.
- Load-bearing: passes — The paper’s conclusions depend on it.
- Based: passes — The paper gives a reason why it holds.
Probably not a substantial claim.
- Supported
The sources with a verdict support this claim; the rest weren’t checked yet, have no full text we could read, or their verdicts aren’t rated yet.
In the paper
“Recent studies combining CRISPR screening technology with organoids have revealed the power of such strategies for discovering new gene functions12,13.”
§ Single-cell brain organoid screening identifies developmental defects in autism > Main
What the sources say
- Not checked — no full text of the sourcecites [12] Esk, C. et al. A human tissue screen identifies a regulator of ER secretion as a brain-size determinant. Science 370, 935–941 (2020). source
- Supportedcites [13] Michels, B. E. et al. Pooled in vitro and in vivo CRISPR-Cas9 screening identifies tumor suppressors in human colon organoids. Cell Stem Cell 26, 782–792.e7 (2020). source
The Introduction says the authors combined CRISPR-Cas9 screening with organoids to study the effects of human tumor-suppressor genes. The Discussion reports that the platform permits unbiased detection of genes conferring a growth advantage, supporting the citing sentence’s broad claim about discovering gene functions. (LLM, conf=0.92)
boosteddirect- Asserted: passes — The authors put it forward as true.
- Checkable: passes — It can be checked against evidence.
- Load-bearing: passes — The paper’s conclusions depend on it.
- Based: passes — The paper gives a reason why it holds.
Probably not a substantial claim.
The cited sources support only part of this claim — read each source’s verdict below.
In the paper
“It is important to note that the development of human brain tissues exhibits the generation of clones with highly variable sizes both in vivo and in vitro12,19.”
§ Single-cell brain organoid screening identifies developmental defects in autism > Single-cell CRISPR screening in barcoded organoids
What the sources say
- Not checked — no full text of the sourcecites [12] Esk, C. et al. A human tissue screen identifies a regulator of ER secretion as a brain-size determinant. Science 370, 935–941 (2020). source
- Partly supportedcites [19] Bizzotto, S. et al. Landmarks of human embryonic development inscribed in somatic mutations. Science 371, 1249–1253 (2021). sourceExperimental — accuracy not yet measured
The indexed passage (labeled Abstract; no page supplied) reports mosaic fractions ranging from 5% to 26% across cerebral cortex samples, supporting highly variable clonal amplification in human brain tissue in vivo. Our copy does not report variable clone sizes in brain tissue grown in vitro, so that part of the claim is not supported by this source. (LLM, conf=0.87)
plain- Asserted: passes — The authors put it forward as true.
- Checkable: passes — It can be checked against evidence.
- Load-bearing: fails — The paper’s conclusions may not depend on it.
- Based: passes — The paper gives a reason why it holds.
Probably not a substantial claim. The paper’s conclusions may not depend on it.
Every source the paper cites for this claim was checked and supports it.
In the paper
“Brain organoids recapitulate early brain development and generate diverse cell types found in vivo9.”
§ Single-cell brain organoid screening identifies developmental defects in autism > Main
What the sources say
- Supportedcites [9] Lancaster, M. A. et al. Cerebral organoids model human brain development and microcephaly. Nature 501, 373–379 (2013). source
The Introduction says cerebral organoids resemble the developing human brain at early stages and produce cortical neurons with various pyramidal identities. The Results sections on cortical organization and discrete brain regions also describe outer radial glial cells and multiple regional identities. The supplied passages do not specify page numbers. (LLM, conf=0.90)
plaindirect- Asserted: passes — The authors put it forward as true.
- Checkable: passes — It can be checked against evidence.
- Load-bearing: passes — The paper’s conclusions depend on it.
- Based: passes — The paper gives a reason why it holds.
It may state two separate claims as one.
- Supported
The cited sources support only part of this claim — read each source’s verdict below.
In the paper
“This is an interesting finding given that OLIG2 is known to regulate progenitor self-renewal at earlier developmental stages and is a master regulator for oligodendrocyte lineage specification in the ventral telencephalon44,45.”
§ Single-cell brain organoid screening identifies developmental defects in autism > Effects of ARID1B perturbation on v-RGCs
What the sources say
- Not checked — no full text of the sourcecites [44] Petryniak, M. A., Potter, G. B., Rowitch, D. H. & Rubenstein, J. L. R. Dlx1 and Dlx2 control neuronal versus oligodendroglial cell fate acquisition in the developing forebrain. Neuron 55, 417–433 (2007). source
- Partly supportedcites [45] Sun, Y. et al. Phosphorylation state of Olig2 regulates proliferation of neural progenitors. Neuron 69, 906–917 (2011). sourceExperimental — accuracy not yet measured
The Introduction (page unavailable) says Olig2 sustains progenitor replication competence, is required for optimal proliferation in embryonic forebrain neurospheres, and later helps specify oligodendrocyte progenitors. The Results (page unavailable) also report that disrupting Olig2 nearly abolishes the oligodendrocyte lineage. Our copy does not establish the claim’s specific location, the ventral telencephalon, for that lineage-specification role. (LLM, conf=0.84)
boosteddirect- Asserted: passes — The authors put it forward as true.
- Checkable: passes — It can be checked against evidence.
- Load-bearing: fails — The paper’s conclusions may not depend on it.
- Based: passes — The paper gives a reason why it holds.
Probably not a substantial claim. The paper’s conclusions may not depend on it. It may state two separate claims as one.
The cited sources support only part of this claim — read each source’s verdict below.
In the paper
“CHCHD2 encodes a mitochondrial protein, and its downregulation has been observed in neurons from the postmortem brains of patients with ASD34.”
§ Single-cell brain organoid screening identifies developmental defects in autism > Altered gene expression upon ASD gene perturbation
What the sources say
- Partly supportedcites [34] Velmeshev, D. et al. Single-cell genomics identifies cell type–specific molecular changes in autism. Science 364, 685–689 (2019). sourceExperimental — accuracy not yet measured
The indexed text (section labeled Abstract; page unavailable) reports downregulated neuronal genes in postmortem ASD samples. It does not identify CHCHD2 among those genes or say that CHCHD2 encodes a mitochondrial protein, so it does not support the gene-specific claim. (LLM, conf=0.82)
plaincorrelational- Asserted: passes — The authors put it forward as true.
- Checkable: passes — It can be checked against evidence.
- Load-bearing: fails — The paper’s conclusions may not depend on it.
- Based: passes — The paper gives a reason why it holds.
Probably not a substantial claim. The paper’s conclusions may not depend on it. It may state two separate claims as one.
- Partly supported
The cited sources support only part of this claim — read each source’s verdict below.
In the paper
“Some notable examples include the gene ontology terms ribosome assembly (SETD5 perturbation)36, mitochondrion organization (FOXP1 perturbation)37, lipid homoeostasis (IRF2BPL perturbation)38, autophagosome maturation (KAT2B perturbation)39 and cilium development (MECP2 perturbation)40.”
§ Single-cell brain organoid screening identifies developmental defects in autism > Altered gene expression upon ASD gene perturbation
What the sources say
- Partly supportedcites [36] Nakagawa, T. et al. The autism-related protein SETD5 controls neural cell proliferation through epigenetic regulation of rDNA expression. iScience 23, 101030 (2020). sourceExperimental — accuracy not yet measured
The Results section, “Impaired Expression of Ribosome-Related Genes in the Setd5+/– Mouse Brain” (page unavailable), reports GO enrichment of ribosomal-protein genes among genes down-regulated after SETD5 reduction. It also discusses ribosome assembly, but does not identify “ribosome assembly” as an enriched GO term. The other gene–term pairs have separate citations and are not attributed to this source. (LLM, conf=0.84)
- Supportedcites [37] Wang, J. et al. Mitochondrial dysfunction and oxidative stress contribute to cognitive and motor impairment in FOXP1 syndrome. Proc. Natl Acad. Sci. USA 119, e2112852119 (2022). source
The citation attaches to the FOXP1–mitochondrion organization example, not the other genes in the sentence. In the Results section on mitochondrial dynamics, the paper reports altered expression of fission- and fusion-related genes in Foxp1+/− striatum, supporting the association; it does not need to use the citing paper’s exact gene-ontology wording. (LLM, conf=0.88)
- Partly supportedcites [38] Chen, H.-H. et al. IRF2BP2 reduces macrophage inflammation and susceptibility to atherosclerosis. Circ. Res. 117, 671–683 (2015). sourceExperimental — accuracy not yet measured
The section “IRF2BP2-Deficient Macrophages Have an Increased Propensity for Foam Cell Formation” (page unavailable) reports altered lipid accumulation, cholesterol uptake, and cholesterol efflux after IRF2BP2 deletion. That supports a link between IRF2BP2 perturbation and lipid handling, but the cited paper does not establish the claimed lipid-homoeostasis gene ontology term for IRF2BPL perturbation; IRF2BPL is a different gene. (LLM, conf=0.86)
- Partly supportedcites [39] Jia, Y.-L. et al. P300/CBP-associated factor (PCAF) inhibits the growth of hepatocellular carcinoma by promoting cell autophagy. Cell Death Dis. 7, e2400–e2400 (2016). sourceExperimental — accuracy not yet measured
Citation 39 is attached to the KAT2B–autophagosome maturation example. The Results section reports that perturbing PCAF affects autophagy and autophagosome formation in hepatocellular carcinoma cells, but it does not identify autophagosome maturation as a perturbation-specific gene ontology term or establish an effect specifically on maturation. (LLM, conf=0.85)
- Supportedcites [40] Frasca, A. et al. MECP2 mutations affect ciliogenesis: a novel perspective for Rett syndrome and related disorders. EMBO Mol. Med. 12, e10270 (2020). source
The citation attached to MECP2 supports the cilium-development example, not the other genes in the sentence. In Results, under “Primary cilium formation is facilitated by MeCP2” (page unavailable), the paper reports impaired primary cilium formation in Mecp2-null neurons and recovery after MeCP2 expression. (LLM, conf=0.91)
plaincorrelational- Asserted: passes — The authors put it forward as true.
- Checkable: passes — It can be checked against evidence.
- Load-bearing: unclear — It is unclear whether the paper’s conclusions depend on it.
- Based: passes — The paper gives a reason why it holds.
It may state two separate claims as one.
- Partly supported
The cited sources support only part of this claim — read each source’s verdict below.
In the paper
“Emulsion polymerase chain reaction (PCR) was used to recover gRNA and UCB sequences from plasmid libraries, genomic DNA extracted from lentivirus-infected hES cells and cells sorted from CHOOSE mosaic organoids as well as 10× single-cell complementary DNA libraries to reduce PCR bias and to prevent the generation of chimeric PCR products56,57.”
§ Single-cell brain organoid screening identifies developmental defects in autism > Methods > Emulsion PCR and target amplification
What the sources say
- Partly supportedcites [56] Omelina, E. S., Ivankin, A. V., Letiagina, A. E. & Pindyurin, A. V. Optimized PCR conditions minimizing the formation of chimeric DNA molecules from MPRA plasmid libraries. BMC Genom. 20, 536 (2019). sourceExperimental — accuracy not yet measured
The Background and Results (pages unavailable) support using optimized emulsion PCR to minimize chimeric products from MPRA plasmid libraries. The paper does not establish that it reduces PCR bias, and its results do not address the gRNA, genomic-DNA, organoid, or single-cell libraries named in the citing sentence. (LLM, conf=0.88)
- Not checked — no full text of the sourcecites [57] Williams, R. et al. Amplification of complex gene libraries by emulsion PCR. Nat. Methods 3, 545–550 (2006). source
plaindirect- Asserted: passes — The authors put it forward as true.
- Checkable: passes — It can be checked against evidence.
- Load-bearing: fails — The paper’s conclusions may not depend on it.
- Based: passes — The paper gives a reason why it holds.
Probably not a substantial claim. The paper’s conclusions may not depend on it. It may state two separate claims as one.
- Partly supported
The cited sources support only part of this claim — read each source’s verdict below.
In the paper
“This aligns with the observation that ASD risk gene coexpression networks are enriched in upper-layer neurons during development and that these neurons are preferentially affected in ASD patients6,34.”
§ Single-cell brain organoid screening identifies developmental defects in autism > Discussion
What the sources say
- Partly supportedcites [6] Parikshak, N. N. et al. Integrative functional genomic analyses implicate specific molecular pathways and circuits in autism. Cell 155, 1008–1021 (2013). sourceExperimental — accuracy not yet measured
The Results (page unavailable) link ASD-risk coexpression modules to upper-layer neuron markers and report that genes recurrently mutated in ASD probands tend to be expressed in superficial layers. The Discussion (page unavailable) treats disruption of upper-layer neurons as a prediction, not a direct observation that those neurons are preferentially affected in patients; it also says the strongest layer enrichment was found in adult tissue. (LLM, conf=0.84)
- Partly supportedcites [34] Velmeshev, D. et al. Single-cell genomics identifies cell type–specific molecular changes in autism. Science 364, 685–689 (2019). sourceExperimental — accuracy not yet measured
The paper reports that ASD-associated genes and molecular changes are enriched in upper-layer cortical neurons, and that gene expression in layer 2/3 neurons is especially affected in ASD patients (Abstract; page not provided). It does not report an analysis showing that ASD risk-gene coexpression networks are enriched in those neurons during development; it refers more generally to previous studies of fetal cell-type convergence. (LLM, conf=0.87)
plaincorrelational- Asserted: passes — The authors put it forward as true.
- Checkable: passes — It can be checked against evidence.
- Load-bearing: fails — The paper’s conclusions may not depend on it.
- Based: passes — The paper gives a reason why it holds.
Probably not a substantial claim. The paper’s conclusions may not depend on it. It may state two separate claims as one.
- Partly supported
A result the paper reports from its own data — it cites no other source for it, so there is none to check. The quote shows it is in the paper.
In the paper
“We construct a developmental gene regulatory network of cerebral organoids from single-cell transcriptomes and chromatin modalities and identify autism spectrum disorder-associated and perturbation-enriched regulatory modules.”
§ Single-cell brain organoid screening identifies developmental defects in autism > Abstract
plaincorrelational- Asserted: passes — The authors put it forward as true.
- Checkable: passes — It can be checked against evidence.
- Load-bearing: passes — The paper’s conclusions depend on it.
- Based: passes — The paper gives a reason why it holds.
It may state two separate claims as one.
A result the paper reports from its own data — it cites no other source for it, so there is none to check. The quote shows it is in the paper.
In the paper
“Among the cells with dorsal identity, we identified radial glial cells (RGCs; VIM), cycling RGCs (ASPM), outer RGCs (oRGCs; HOPX) and intermediate progenitor cells (IPCs; EOMES).”
§ Single-cell brain organoid screening identifies developmental defects in autism > CHOOSE organoids generate diverse cell types
plain- Asserted: passes — The authors put it forward as true.
- Checkable: passes — It can be checked against evidence.
- Load-bearing: unclear — It is unclear whether the paper’s conclusions depend on it.
- Based: passes — The paper gives a reason why it holds.
It may state two separate claims as one.
A result the paper reports from its own data — it cites no other source for it, so there is none to check. The quote shows it is in the paper.
In the paper
“These progenitors differentiated into excitatory neurons with specific layer identities, including layer 5/6 neurons (L5/6; BCL11B), L6 cortical thalamic projection neurons (FOXP2, TLE4)25, L4 neurons (RORB, UNC5D, NR2F1)26,27 and L2/3 neurons (SATB2).”
§ Single-cell brain organoid screening identifies developmental defects in autism > CHOOSE organoids generate diverse cell types
plaindirect- Asserted: passes — The authors put it forward as true.
- Checkable: passes — It can be checked against evidence.
- Load-bearing: passes — The paper’s conclusions depend on it.
- Based: passes — The paper gives a reason why it holds.
It may state two separate claims as one.
None of the sources cited for this claim have been checked yet.
In the paper
“Ventral radial glial cells (v-RGCs; cell cycling ventral RGCs, ccv-RGCs) differentiated into interneuron precursor cells (INPs; DLX2), which generated interneurons with lateral ganglionic eminence (LGE) origin (LGE-IN; MEIS2) or caudal ganglionic eminence (CGE) origin (CGE-IN; NR2F2)28.”
§ Single-cell brain organoid screening identifies developmental defects in autism > CHOOSE organoids generate diverse cell types
plaindirect- Asserted: passes — The authors put it forward as true.
- Checkable: passes — It can be checked against evidence.
- Load-bearing: passes — The paper’s conclusions depend on it.
- Based: passes — The paper gives a reason why it holds.
It may state two separate claims as one.
A result the paper reports from its own data — it cites no other source for it, so there is none to check. The quote shows it is in the paper.
In the paper
“Specifically, perturbing ARID1B expands ventral radial glia cells and increases their transition to early oligodendrocyte precursor cells (OPCs), a phenotype we verify in brain organoids generated from ARID1B patient-derived induced pluripotent stem cell (iPS cell) lines.”
§ Single-cell brain organoid screening identifies developmental defects in autism > Main
plaindirect- Asserted: passes — The authors put it forward as true.
- Checkable: passes — It can be checked against evidence.
- Load-bearing: passes — The paper’s conclusions depend on it.
- Based: passes — The paper gives a reason why it holds.
It may state two separate claims as one.
A result the paper reports from its own data — it cites no other source for it, so there is none to check. The quote shows it is in the paper.
In the paper
“Using single-cell multiomic data, we construct a developmental gene regulatory network (GRN) of cerebral organoids and identify ASD-enriched regulatory hubs connected to the genes that are dysregulated in response to genetic perturbations.”
§ Single-cell brain organoid screening identifies developmental defects in autism > Main
plaincorrelational- Asserted: passes — The authors put it forward as true.
- Checkable: passes — It can be checked against evidence.
- Load-bearing: passes — The paper’s conclusions depend on it.
- Based: passes — The paper gives a reason why it holds.
It may state two separate claims as one.
A result the paper reports from its own data — it cites no other source for it, so there is none to check. The quote shows it is in the paper.
In the paper
“Specifically, mutating the BAF subunit ARID1B affects the fate transition of progenitors to oligodendrocyte and interneuron precursor cells, a phenotype that we confirmed in patient-specific induced pluripotent stem cell-derived organoids.”
§ Single-cell brain organoid screening identifies developmental defects in autism > Abstract
boosteddirect- Asserted: passes — The authors put it forward as true.
- Checkable: passes — It can be checked against evidence.
- Load-bearing: passes — The paper’s conclusions depend on it.
- Based: passes — The paper gives a reason why it holds.
It may state two separate claims as one.
A result the paper reports from its own data — it cites no other source for it, so there is none to check. The quote shows it is in the paper.
In the paper
“In the ventral telencephalic cells, CREB5, MEIS2, NFIA and OLIG1 were most strongly affected, whereas dorsal telencephalon-specific DEGs were strongly enriched in SATB2, BACH2, MEF2C and EOMES modules.”
§ Single-cell brain organoid screening identifies developmental defects in autism > ASD-associated regulatory modules
boostedcorrelational- Asserted: passes — The authors put it forward as true.
- Checkable: passes — It can be checked against evidence.
- Load-bearing: passes — The paper’s conclusions depend on it.
- Based: passes — The paper gives a reason why it holds.
It may state two separate claims as one.
A result the paper reports from its own data — it cites no other source for it, so there is none to check. The quote shows it is in the paper.
In the paper
“We finally present gene regulatory subnetworks of OLIG1 and EOMES, which are both enriched in ASD risk genes and strongly affected by ASD genetic perturbations (Fig. 3g).”
§ Single-cell brain organoid screening identifies developmental defects in autism > ASD-associated regulatory modules
boostedcorrelational- Asserted: passes — The authors put it forward as true.
- Checkable: passes — It can be checked against evidence.
- Load-bearing: passes — The paper’s conclusions depend on it.
- Based: passes — The paper gives a reason why it holds.
It may state two separate claims as one.
A result the paper reports from its own data — it cites no other source for it, so there is none to check. The quote shows it is in the paper.
In the paper
“On the other hand, six perturbations specifically targeted one cell type without affecting others, including ADNP (L2/3 enrichment), POGZ (RGC enrichment) and SETD5 (ccv-RGC enrichment).”
§ Single-cell brain organoid screening identifies developmental defects in autism > Cell-type-specific effects of perturbing ASD genes
plaindirectn = 11- Asserted: passes — The authors put it forward as true.
- Checkable: passes — It can be checked against evidence.
- Load-bearing: passes — The paper’s conclusions depend on it.
- Based: passes — The paper gives a reason why it holds.
It may state two separate claims as one.
A result the paper reports from its own data — it cites no other source for it, so there is none to check. The quote shows it is in the paper.
In the paper
“Consistent with the screen data, we detected significantly decreased EOMES+ IPCs in KMT2C and PHF3 perturbations (Extended Data Fig. 11) and increased DLX2+ INPs in KMT2C, MED13, PHF3 and TBL1XR1 perturbations (Extended Data Fig. 12).”
§ Single-cell brain organoid screening identifies developmental defects in autism > Cell-type-specific effects of perturbing ASD genes
plaindirect- Asserted: passes — The authors put it forward as true.
- Checkable: passes — It can be checked against evidence.
- Load-bearing: passes — The paper’s conclusions depend on it.
- Based: passes — The paper gives a reason why it holds.
It may state two separate claims as one.
A result the paper reports from its own data — it cites no other source for it, so there is none to check. The quote shows it is in the paper.
In the paper
“We visualized the terminal fate probabilities for each cell as a circular projection, which revealed a distinct differentiation trajectory from ventral progenitors towards early OPCs (OLIG2, PDGFRA) and a branching of INPs (DLX2) into different inhibitory neuronal fates (DLX5) (Fig. 4b).”
§ Single-cell brain organoid screening identifies developmental defects in autism > Effects of ARID1B perturbation on v-RGCs
plaincorrelational- Asserted: passes — The authors put it forward as true.
- Checkable: passes — It can be checked against evidence.
- Load-bearing: passes — The paper’s conclusions depend on it.
- Based: passes — The paper gives a reason why it holds.
It may state two separate claims as one.
A result the paper reports from its own data — it cites no other source for it, so there is none to check. The quote shows it is in the paper.
In the paper
“Analysis of interneurons revealed enrichment of both CGE-INs and LGE-INs in three perturbations and enrichment of only CGE-INs or LGE-INs in four perturbations.”
§ Single-cell brain organoid screening identifies developmental defects in autism > Cell-type-specific effects of perturbing ASD genes
plaincorrelational- Asserted: passes — The authors put it forward as true.
- Checkable: passes — It can be checked against evidence.
- Load-bearing: passes — The paper’s conclusions depend on it.
- Based: passes — The paper gives a reason why it holds.
It may state two separate claims as one.
A result the paper reports from its own data — it cites no other source for it, so there is none to check. The quote shows it is in the paper.
In the paper
“Bar graph shows cells within the v-RGCs that are positive for DLX2 (68.6 versus 81.5%), OLIG2 (19.6 versus 36.2%) and both (9.8 versus 30.6%) in control versus ARID1B perturbation.”
§ Single-cell brain organoid screening identifies developmental defects in autism > Effects of ARID1B perturbation on v-RGCs
plain- Asserted: passes — The authors put it forward as true.
- Checkable: passes — It can be checked against evidence.
- Load-bearing: passes — The paper’s conclusions depend on it.
- Based: passes — The paper gives a reason why it holds.
It may state two separate claims as one.
A result the paper reports from its own data — it cites no other source for it, so there is none to check. The quote shows it is in the paper.
In the paper
“Bulk analysis of the genomic DNA with a higher cell number input (50,000–150,000) revealed high clonal complexity in both eCas9-uninduced and eCas9-induced cells, with a homogenous distribution only in uninduced cells (Extended Data Fig. 4g,h).”
§ Single-cell brain organoid screening identifies developmental defects in autism > Cell proliferation and depletion phenotypes
plain- Asserted: passes — The authors put it forward as true.
- Checkable: passes — It can be checked against evidence.
- Load-bearing: passes — The paper’s conclusions depend on it.
- Based: passes — The paper gives a reason why it holds.
It may state two separate claims as one.
A result the paper reports from its own data — it cites no other source for it, so there is none to check. The quote shows it is in the paper.
In the paper
“We found that ARID1B-perturbed cells were strongly enriched in the OPC trajectory and had a higher percentage of OLIG2 + v-RGCs (Fig. 4c,d).”
§ Single-cell brain organoid screening identifies developmental defects in autism > Effects of ARID1B perturbation on v-RGCs
boostedcorrelational- Asserted: passes — The authors put it forward as true.
- Checkable: passes — It can be checked against evidence.
- Load-bearing: passes — The paper’s conclusions depend on it.
- Based: passes — The paper gives a reason why it holds.
It may state two separate claims as one.
A result the paper reports from its own data — it cites no other source for it, so there is none to check. The quote shows it is in the paper.
In the paper
“Additionally, we could identify genes dysregulated in both dorsal and ventral populations, as well as those specifically dysregulated in one population (KMT2C, LEO1 perturbation) (Extended Data Fig. 13a).”
§ Single-cell brain organoid screening identifies developmental defects in autism > Altered gene expression upon ASD gene perturbation
hedged- Asserted: passes — The authors put it forward as true.
- Checkable: passes — It can be checked against evidence.
- Load-bearing: passes — The paper’s conclusions depend on it.
- Based: passes — The paper gives a reason why it holds.
It may state two separate claims as one.
A result the paper reports from its own data — it cites no other source for it, so there is none to check. The quote shows it is in the paper.
In the paper
“To further explore the potential consequences of such defects in patients, we analysed the prenatal brain structure of patient 2 at two gestation stages (gestational weeks (GW) 22 and GW31) by intrauterine super-resolution magnetic resonance imaging (MRI).”
§ Single-cell brain organoid screening identifies developmental defects in autism > Effects of ARID1B perturbation on v-RGCs
plaincorrelationalSingle case- Asserted: passes — The authors put it forward as true.
- Checkable: passes — It can be checked against evidence.
- Load-bearing: passes — The paper’s conclusions depend on it.
- Based: passes — The paper gives a reason why it holds.
The quote only partly states this claim.
A result the paper reports from its own data — it cites no other source for it, so there is none to check. The quote shows it is in the paper.
In the paper
“Box plots showing transition probabilities of control (n = 51) and ARID1B-perturbed (n = 46) ventral progenitor cells towards OPCs. The centre lines represent the medians, the box limits show the 25–75% interquartile ranges and the whiskers indicate 1.5× the interquartile ranges. Two-sided Wilcoxon test P value = 7.7 × 10⁻⁸.”
§ Single-cell brain organoid screening identifies developmental defects in autism > Effects of ARID1B perturbation on v-RGCs
plaincorrelationaln = 51- Asserted: passes — The authors put it forward as true.
- Checkable: passes — It can be checked against evidence.
- Load-bearing: passes — The paper’s conclusions depend on it.
- Based: passes — The paper gives a reason why it holds.
It may state two separate claims as one.
A result the paper reports from its own data — it cites no other source for it, so there is none to check. The quote shows it is in the paper.
In the paper
“Furthermore, we constructed a telencephalon developmental trajectories-based GRN and identified ASD-associated regulatory modules in dorsal and ventral cell populations.”
§ Single-cell brain organoid screening identifies developmental defects in autism > Discussion
plaincorrelational- Asserted: passes — The authors put it forward as true.
- Checkable: passes — It can be checked against evidence.
- Load-bearing: passes — The paper’s conclusions depend on it.
- Based: passes — The paper gives a reason why it holds.
It may state two separate claims as one.
In the paper
“we used a human embryonic stem cell (hES cell) line expressing an enhanced specificity SpCas9 (eCas9), which has substantially reduced off-target effects and is controlled by an upstream loxp stop element12”
§ Single-cell brain organoid screening identifies developmental defects in autism > Single-cell CRISPR screening in barcoded organoids
What the sources say
- Not checked — no full text of the sourcecites [12] Esk, C. et al. A human tissue screen identifies a regulator of ER secretion as a brain-size determinant. Science 370, 935–941 (2020). source
plaindirect- Asserted: passes — The authors put it forward as true.
- Checkable: passes — It can be checked against evidence.
- Load-bearing: fails — The paper’s conclusions may not depend on it.
- Based: passes — The paper gives a reason why it holds.
Probably not a substantial claim. The paper’s conclusions may not depend on it.
What the paper did — it cites no source for this, so there is none to check. The quote shows it is in the paper.
In the paper
“Using this strategy, we obtained an average of 2,770 unique clones for each perturbation, which we used to generate mosaic embryoid bodies (Fig. 1e).”
§ Single-cell brain organoid screening identifies developmental defects in autism > Single-cell CRISPR screening in barcoded organoids
plain- Asserted: passes — The authors put it forward as true.
- Checkable: passes — It can be checked against evidence.
- Load-bearing: passes — The paper’s conclusions depend on it.
- Based: passes — The paper gives a reason why it holds.
It may state two separate claims as one.
What the paper did — it cites no source for this, so there is none to check. The quote shows it is in the paper.
In the paper
“Our analysis indicated homogeneous distribution of the gRNAs in both the plasmid library and hES cells, which was maintained after the formation of embryoid bodies (Fig. 1d).”
§ Single-cell brain organoid screening identifies developmental defects in autism > Single-cell CRISPR screening in barcoded organoids
hedged- Asserted: passes — The authors put it forward as true.
- Checkable: passes — It can be checked against evidence.
- Load-bearing: passes — The paper’s conclusions depend on it.
- Based: passes — The paper gives a reason why it holds.
It may state two separate claims as one.
A conclusion the paper draws from its own results — it cites no other source for it, so there is none to check. The quote shows it is in the paper.
In the paper
“We also observed many perturbation-specific gene ontology terms, many of which confirm previous studies, further supporting the power of detecting complex biological phenotypes with the CHOOSE system (Extended Data Fig. 13b and Supplementary Data 4).”
§ Single-cell brain organoid screening identifies developmental defects in autism > Altered gene expression upon ASD gene perturbation
plaincorrelational- Asserted: passes — The authors put it forward as true.
- Checkable: passes — It can be checked against evidence.
- Load-bearing: passes — The paper’s conclusions depend on it.
- Based: passes — The paper gives a reason why it holds.
It may state two separate claims as one.
A conclusion the paper draws from its own results — it cites no other source for it, so there is none to check. The quote shows it is in the paper.
In the paper
“Leveraging GRN inference from multiomic data, we further identified ASD-associated TF modules during cortical development and critical regulatory hubs underlying the detected gene expression changes.”
§ Single-cell brain organoid screening identifies developmental defects in autism > ASD-associated regulatory modules
plaincorrelational- Asserted: passes — The authors put it forward as true.
- Checkable: passes — It can be checked against evidence.
- Load-bearing: passes — The paper’s conclusions depend on it.
- Based: passes — The paper gives a reason why it holds.
It may state two separate claims as one.
What the paper did — it cites no source for this, so there is none to check. The quote shows it is in the paper.
In the paper
“On average, we recovered 125 clones for each perturbation and found that the clones were distributed across all libraries (Extended Data Fig. 4c,d).”
§ Single-cell brain organoid screening identifies developmental defects in autism > Cell proliferation and depletion phenotypes
plain- Asserted: passes — The authors put it forward as true.
- Checkable: passes — It can be checked against evidence.
- Load-bearing: passes — The paper’s conclusions depend on it.
- Based: passes — The paper gives a reason why it holds.
It may state two separate claims as one.
A conclusion the paper draws from its own results — it cites no other source for it, so there is none to check. The quote shows it is in the paper.
In the paper
“Thus, we have characterized gene expression changes for each genetic perturbation in both dorsal and ventral telencephalon and uncovered molecular programs shared between different perturbations.”
§ Single-cell brain organoid screening identifies developmental defects in autism > ASD-associated regulatory modules
plaincorrelational- Asserted: passes — The authors put it forward as true.
- Checkable: passes — It can be checked against evidence.
- Load-bearing: passes — The paper’s conclusions depend on it.
- Based: passes — The paper gives a reason why it holds.
It may state two separate claims as one.
What the paper did — it cites no source for this, so there is none to check. The quote shows it is in the paper.
In the paper
“Age-matched control subjects were identified and included if they presented an absence of confounding comorbidities, including structural cerebral or cardiac anomalies or fetal growth restriction.”
§ Single-cell brain organoid screening identifies developmental defects in autism > Methods > Fetal MRI and 3D reconstruction
plain- Asserted: passes — The authors put it forward as true.
- Checkable: passes — It can be checked against evidence.
- Load-bearing: fails — The paper’s conclusions may not depend on it.
- Based: passes — The paper gives a reason why it holds.
Probably not a substantial claim. The paper’s conclusions may not depend on it.
What the paper did — it cites no source for this, so there is none to check. The quote shows it is in the paper.
In the paper
“The resulting superresolution data were quality assessed, and only cases that met high-quality standards (score of less than or equal to two of five) were included in the analysis.”
§ Single-cell brain organoid screening identifies developmental defects in autism > Methods > Fetal MRI and 3D reconstruction
plain- Asserted: passes — The authors put it forward as true.
- Checkable: passes — It can be checked against evidence.
- Load-bearing: fails — The paper’s conclusions may not depend on it.
- Based: passes — The paper gives a reason why it holds.
Probably not a substantial claim. The paper’s conclusions may not depend on it. It may state two separate claims as one.
What the paper did — it cites no source for this, so there is none to check. The quote shows it is in the paper.
In the paper
“We additionally computed a background distribution of enrichment effects from randomly permuted gRNA labels.”
§ Single-cell brain organoid screening identifies developmental defects in autism > Methods > Differential abundance testing
plain- Asserted: passes — The authors put it forward as true.
- Checkable: passes — It can be checked against evidence.
- Load-bearing: passes — The paper’s conclusions depend on it.
- Based: passes — The paper gives a reason why it holds.
Probably not a substantial claim.
What the paper did — it cites no source for this, so there is none to check. The quote shows it is in the paper.
In the paper
“No statistical methods were used to predetermine sample size unless specified.”
§ Single-cell brain organoid screening identifies developmental defects in autism > Methods > Statistics
plain- Asserted: passes — The authors put it forward as true.
- Checkable: passes — It can be checked against evidence.
- Load-bearing: fails — The paper’s conclusions may not depend on it.
- Based: passes — The paper gives a reason why it holds.
Probably not a substantial claim. The paper’s conclusions may not depend on it.
What the paper did — it cites no source for this, so there is none to check. The quote shows it is in the paper.
In the paper
“As the CHOOSE system provides a robust, precisely controlled screening strategy, we anticipate that it will be widely applied beyond brain organoids to study disease-associated genes.”
§ Single-cell brain organoid screening identifies developmental defects in autism > Discussion
plain- Asserted: passes — The authors put it forward as true.
- Checkable: passes — It can be checked against evidence.
- Load-bearing: passes — The paper’s conclusions depend on it.
- Based: fails — The paper may give no reason why it holds.
Probably not a substantial claim. The paper may give no reason why it holds.
What the paper did — it cites no source for this, so there is none to check. The quote shows it is in the paper.
In the paper
“First, our system lacks certain brain cell types, such as microglia, and does not include interneurons derived from the medial ganglionic eminence.”
§ Single-cell brain organoid screening identifies developmental defects in autism > Discussion
plain- Asserted: passes — The authors put it forward as true.
- Checkable: passes — It can be checked against evidence.
- Load-bearing: unclear — It is unclear whether the paper’s conclusions depend on it.
- Based: passes — The paper gives a reason why it holds.
It may state two separate claims as one.
What the paper did — it cites no source for this, so there is none to check. The quote shows it is in the paper.
In the paper
“Tests were performed on log-normalized transcript counts Y while treating library, cell_type and n_UMI as covariates in the model:Yi≈n_UMI+library+cell_type+condition.”
§ Single-cell brain organoid screening identifies developmental defects in autism > Methods > Differential expression analysis
plain- Asserted: passes — The authors put it forward as true.
- Checkable: passes — It can be checked against evidence.
- Load-bearing: passes — The paper’s conclusions depend on it.
- Based: passes — The paper gives a reason why it holds.
Probably not a substantial claim.
What the paper did — it cites no source for this, so there is none to check. The quote shows it is in the paper.
In the paper
“Next, we filtered high-quality cells based on the number of genes detected (minimum 1,000, maximum 8,000), removing cells with high mitochondrial (less than 15%) or ribosomal (less than 20%) messenger RNA content.”
§ Single-cell brain organoid screening identifies developmental defects in autism > Methods > Preprocessing of single-cell transcriptomics data
plain- Asserted: passes — The authors put it forward as true.
- Checkable: passes — It can be checked against evidence.
- Load-bearing: passes — The paper’s conclusions depend on it.
- Based: passes — The paper gives a reason why it holds.
Probably not a substantial claim. It may state two separate claims as one.
What the paper did — it cites no source for this, so there is none to check. The quote shows it is in the paper.
In the paper
“After colony expansion, gDNA was extracted using DNA QuickExtract Solution (Lucigen), followed by PCR and Sanger sequencing to determine efficient repair of the mutation.”
§ Single-cell brain organoid screening identifies developmental defects in autism > Methods > Generation of isogenic control cell line for patient 1
plainSingle case- Asserted: passes — The authors put it forward as true.
- Checkable: passes — It can be checked against evidence.
- Load-bearing: fails — The paper’s conclusions may not depend on it.
- Based: passes — The paper gives a reason why it holds.
Probably not a substantial claim. The paper’s conclusions may not depend on it.
What the paper did — it cites no source for this, so there is none to check. The quote shows it is in the paper.
In the paper
“No blinding and randomization were used unless specified.”
§ Single-cell brain organoid screening identifies developmental defects in autism > Methods > Statistics
plain- Asserted: passes — The authors put it forward as true.
- Checkable: passes — It can be checked against evidence.
- Load-bearing: fails — The paper’s conclusions may not depend on it.
- Based: passes — The paper gives a reason why it holds.
Probably not a substantial claim. The paper’s conclusions may not depend on it.
What the paper did — it cites no source for this, so there is none to check. The quote shows it is in the paper.
In the paper
“To control for confounding effects through differential gRNA sampling in different libraries, we used a CMH test stratified by library.”
§ Single-cell brain organoid screening identifies developmental defects in autism > Methods > Differential abundance testing
plain- Asserted: passes — The authors put it forward as true.
- Checkable: passes — It can be checked against evidence.
- Load-bearing: passes — The paper’s conclusions depend on it.
- Based: passes — The paper gives a reason why it holds.
Probably not a substantial claim.
What the paper did — it cites no source for this, so there is none to check. The quote shows it is in the paper.
In the paper
“Samples with more than 85% viability were processed.”
§ Single-cell brain organoid screening identifies developmental defects in autism > Methods > CHOOSE screen
plain- Asserted: passes — The authors put it forward as true.
- Checkable: passes — It can be checked against evidence.
- Load-bearing: fails — The paper’s conclusions may not depend on it.
- Based: passes — The paper gives a reason why it holds.
Probably not a substantial claim. The paper’s conclusions may not depend on it.
What the paper did — it cites no source for this, so there is none to check. The quote shows it is in the paper.
In the paper
“For this, we used 14 scRNA-seq libraries obtained from independent pools of organoids as replicates from three batches.”
§ Single-cell brain organoid screening identifies developmental defects in autism > Methods > Differential abundance testing
plain- Asserted: passes — The authors put it forward as true.
- Checkable: passes — It can be checked against evidence.
- Load-bearing: passes — The paper’s conclusions depend on it.
- Based: passes — The paper gives a reason why it holds.
Probably not a substantial claim.
In the paper
“Infection rate was controlled to be lower than 5% to prevent multiple infections18”
§ Single-cell brain organoid screening identifies developmental defects in autism > Methods > CHOOSE screen
What the sources say
- Not checked — no full text of the sourcecites [18] Doench, J. G. Am I ready for CRISPR? A user’s guide to genetic screens. Nat. Rev. Genet. 19, 67–80 (2018). source
plaindirect- Asserted: passes — The authors put it forward as true.
- Checkable: passes — It can be checked against evidence.
- Load-bearing: passes — The paper’s conclusions depend on it.
- Based: passes — The paper gives a reason why it holds.
Probably not a substantial claim.
What the paper did — it cites no source for this, so there is none to check. The quote shows it is in the paper.
In the paper
“All cell lines were authenticated using a short tandem repeat assay, tested for genomic integrity using single-nucleotide polymorphism (SNP) array genotyping and routinely tested negative for mycoplasma.”
§ Single-cell brain organoid screening identifies developmental defects in autism > Methods > Stem cell and cerebral organoid culture conditions
plain- Asserted: passes — The authors put it forward as true.
- Checkable: passes — It can be checked against evidence.
- Load-bearing: fails — The paper’s conclusions may not depend on it.
- Based: passes — The paper gives a reason why it holds.
Probably not a substantial claim. The paper’s conclusions may not depend on it. It may state two separate claims as one.
A conclusion the paper draws from its own results — it cites no other source for it, so there is none to check. The quote shows it is in the paper.
In the paper
“Taken together, the enrichment of v-RGCs and ccv-RGCs (Fig. 2a), the higher transition probability of v-RGCs to early OPCs, and the increased proportion of OLIG2 + cells in our screen and in organoids generated from two patient iPS cell lines all suggest that ARID1B perturbation leads to abnormal ventral progenitor expansion and aberrant cell fate specification (Fig. 4i).”
§ Single-cell brain organoid screening identifies developmental defects in autism > Effects of ARID1B perturbation on v-RGCs
hedgeddirectn = 2- Asserted: passes — The authors put it forward as true.
- Checkable: passes — It can be checked against evidence.
- Load-bearing: passes — The paper’s conclusions depend on it.
- Based: passes — The paper gives a reason why it holds.
It may state two separate claims as one.
A conclusion the paper draws from its own results — it cites no other source for it, so there is none to check. The quote shows it is in the paper.
In the paper
“suggesting that both convergent and divergent mechanisms contribute to ASD pathophysiology.”
§ Single-cell brain organoid screening identifies developmental defects in autism > Discussion
hedgeddirect- Asserted: passes — The authors put it forward as true.
- Checkable: passes — It can be checked against evidence.
- Load-bearing: passes — The paper’s conclusions depend on it.
- Based: passes — The paper gives a reason why it holds.
It may state two separate claims as one.
The paper relies on this without support.
CRISPR screens in organoids are limited by low-content readouts, often using guide RNA counts to assess proliferation phenotypes.
“However, such screens are limited by low-content readouts, which often use guide RNA (gRNA) counts to assess proliferation phenotypes when challenged with genetic perturbations.”
The paper relies on this without support.
CRISPR screening coupled with single-cell transcriptomic readout has not been fully explored in organoids.
“Although CRISPR screening coupled with single-cell transcriptomic readout provides unprecedented resolution for phenotypic characterization14–16, such approaches have not been fully explored in organoids.”
The paper relies on this without support.
The feasibility of single-cell perturbation screening in heterogeneous tissues that undergo long-term differentiation and consist of diverse cell types remains unclear.
“The feasibility of single-cell perturbation screening in heterogeneous tissues that undergo long-term differentiation and consist of diverse cell types remains unclear.”
The paper relies on this without support.
Successful genome editing causes frameshift mutations, resulting in loss of blue fluorescent protein fluorescence, enabling quantitative evaluation of guide RNA efficiency.
“Successful genome editing causes frameshift mutations, resulting in the loss of blue fluorescent protein (BFP) fluorescence, which enables the quantitative evaluation of gRNA efficiency”
The paper relies on this without support.
OLIG1 is preferentially expressed in the ventral telencephalon and is a key regulator for interneuron and oligodendrocyte lineages.
“Oligodendrocyte transcription factor 1 (OLIG1) is preferentially expressed in the ventral telencephalon and is a key regulator for interneuron and oligodendrocyte lineages.”
The paper relies on this without support.
EOMES is a key transcription factor for the fate specification of intermediate progenitor cells in the dorsal telencephalon.
“Eomesodermin (EOMES) is a key TF for the fate specification of IPCs in the dorsal telencephalon.”
Self-check
Percentages, sums and reported differences re-computed from the paper’s own numbers.
Each contradiction between two passages listed here was confirmed by an independent check.
Rated minor: it would not touch a result — a value no result rests on, a p-value that stays on the same side of the significance level, or a conflict that is clerical, resolved elsewhere in the paper, or outside its own findings.
In the paper
§ Single-cell brain organoid screening identifies developmental defects in autism > Effects of ARID1B perturbation on v-RGCs
“f, Immunohistochemistry for early OPCs (OLIG2) and INPs (DLX2) of day 40 ventralized brain organoids derived from control (c.220dupG repair) and two ARID1B patient iPS cells.”
§ Single-cell brain organoid screening identifies developmental defects in autism > Effects of ARID1B perturbation on v-RGCs
“Patient 1 harbours a nucleotide duplication (c.2201dupG), resulting in an early STOP codon.”
Rated minor: it would not touch a result — a value no result rests on, a p-value that stays on the same side of the significance level, or a conflict that is clerical, resolved elsewhere in the paper, or outside its own findings.
In the paper
§ Single-cell brain organoid screening identifies developmental defects in autism > Effects of ARID1B perturbation on v-RGCs
“Taken together, the enrichment of v-RGCs and ccv-RGCs (Fig. 2a), the higher transition probability of v-RGCs to early OPCs, and the increased proportion of OLIG2 + cells in our screen and in organoids generated from two patient iPS cell lines all suggest that ARID1B perturbation leads to abnormal ventral progenitor expansion and aberrant cell fate specification (Fig. 4i).”
§ Single-cell brain organoid screening identifies developmental defects in autism > Cell proliferation and depletion phenotypes
“a, Box plot showing the representation of gRNAs in eCas9-induced and uninduced organoid pools (induced cells, n = 14 independent pools of organoids, three batches; uninduced cells, n = 8 independent pools of organoids, two batches).”
Citations
Cites
Wickham, H. (2016) · Use R! · doi:10.1007/978-3-319-24277-4 · Cited by 34,873
Cutadapt removes adapter sequences from high-throughput sequencing reads
Martin, M. (2011) · EMBnet.journal · doi:10.14806/ej.17.1.200 · Cited by 33,889
Fast unfolding of communities in large networks
Blondel, V. D., Guillaume, J.-L., Lambiotte, R., & Lefebvre, E. (2008) · Journal of Statistical Mechanics: Theory and Experiment · doi:10.1088/1742-5468/2008/10/p10008 · Cited by 21,424 · cited 1×
“Cells were partitioned into clusters using the Louvain algorithm (58) with a resolution of 2.”
MethodA Programmable Dual-RNA–Guided DNA Endonuclease in Adaptive Bacterial Immunity
Jinek, M., Chylinski, K., Fonfara, I., Hauer, M., Doudna, J. A., & Charpentier, E. (2012) · Science · doi:10.1126/science.1225829 · Cited by 17,116
Integrated analysis of multimodal single-cell data
Hao, Y., Hao, S., Andersen-Nissen, E., Mauck, W. M., Zheng, S., Butler, A., Lee, M. J., Wilk, A. J., Darby, C., Zagar, M., et al. (2020) · doi:10.1101/2020.10.12.335331 · Cited by 15,508 · cited 1×
“High-quality superresolution reconstruction was obtained (72).”
Comprehensive Integration of Single-Cell Data
Stuart, T., Butler, A., Hoffman, P., Hafemeister, C., Papalexi, E., Mauck, W. M., Hao, Y., Stoeckius, M., Smibert, P., & Satija, R. (2019) · Cell · doi:10.1016/j.cell.2019.05.031 · Cited by 15,453
clusterProfiler 4.0: A universal enrichment tool for interpreting omics data
(2021) · doi:10.1016/j.xinn.2021.100141 · Cited by 12,455
Fast, sensitive and accurate integration of single-cell data with Harmony
Korsunsky, I., Millard, N., Fan, J., Slowikowski, K., Zhang, F., Wei, K., Baglaenko, Y., Brenner, M., Loh, P.-R., & Raychaudhuri, S. (2019) · Nature Methods · doi:10.1038/s41592-019-0619-0 · Cited by 10,488
UMAP: Uniform Manifold Approximation and Projection
McInnes, L., Healy, J., Saul, N., & Großberger, L. (2018) · Journal of Open Source Software · doi:10.21105/joss.00861 · Cited by 9,826
Near-optimal probabilistic RNA-seq quantification
Bray, N. L., Pimentel, H., Melsted, P., & Pachter, L. (2016) · Nature Biotechnology · doi:10.1038/nbt.3519 · Cited by 9,723 · cited 1×
“2)(59) through the command line tool loompy from fastq from the python package loompy (version 3.”
Method
Cited by
Sorted by citations
Energy metabolism in health and diseases
Liu, H., Wang, S., Wang, J., Guo, X., Song, Y., Fu, K., Gao, Z., Liu, D., He, W., & Yang, L. (2025) · Signal Transduction and Targeted Therapy · doi:10.1038/s41392-025-02141-x · Cited by 484
Inferring and perturbing cell fate regulomes in human brain organoids
Fleck, J. S., Jansen, S. M. J., Wollny, D., Zenk, F., Seimiya, M., Jain, A., Okamoto, R., Santel, M., He, Z., Camp, J. G., et al. (2023) · Nature · doi:10.1038/s41586-022-05279-8 · Cited by 315
“Such network analysis can guide future experiments designed to program specific neuronal states, and can be used to interpret gene perturbations in human organoids 45 .”
Self-citationPatient-derived organoids in precision cancer medicine
Tong, L., Cui, W., Zhang, B., Fonseca, P., Zhao, Q. C., Zhang, P., Xu, B., Zhang, Q., Li, Z., Seashore-Ludlow, B. A., et al. (2024) · Med · doi:10.1016/j.medj.2024.08.010 · Cited by 192
An integrated transcriptomic cell atlas of human neural organoids
He, Z., Dony, L., Fleck, J. S., Szałata, A., Li, K. X., Slišković, I., Lin, H., Santel, M., Atamian, A., Quadrato, G., et al. (2024) · Nature · doi:10.1038/s41586-024-08172-8 · Cited by 190
Self-citationMolecular cascades and cell type–specific signatures in ASD revealed by single-cell genomics
Wamsley, B., Bicks, L. K., Cheng, Y., Kawaguchi, R., Quintero, D., Grundman, J., Liu, J., Xiao, S., Hawken, N., Margolis, M., et al. (2024) · Science · doi:10.1126/science.adh2602 · Cited by 155
“We emphasize that more definitive determination of the causal impact of risk genes on these transcriptional regulatory circuits awaits direct experimental perturbations, for example, in human in vitro organoid models ( 62 – 64 ).”
Background
Metadata
- Authors
- Li, C., Fleck, J. S., Martins-Costa, C., Burkard, T. R., Themann, J., Stuempflen, M., Peer, A. M., Vertesy, Á., Littleboy, J. B., Esk, C., Elling, U., Kasprian, G., Corsini, N. S., Treutlein, B., & Knoblich, J. A.
- Affiliations
- Institute of Molecular Biotechnology (AT)
- ETH Zurich (CH)
- Medical University of Vienna (AT)
- Corresponding author
- Li, Chong
- Treutlein, Barbara
- Knoblich, Juergen A.
- ORCID
- Venue
- Nature
- Published
- 2023-09-13
- Volume
- 621
- Issue
- 7978
- Pages
- 373-380
- ISSN
- 0028-0836 (ISSN-L)
- 1476-4687
- PMC
- PMC10499611
- OpenAlex
- W4386697296
- Semantic Scholar
- 7794beca1a3f20e084766fc84bcb357f90f7f608
- Cited by
- 283
- References
- 104
- Citations by year
- 2026: 80 · 2025: 108 · 2024: 74 · 2023: 18
- FWCI
- 20.75
- Type
- journal article
- Language
- en
- Update notices
- correction (2023-11-14)
- Open access
- hybrid
- doi.org
- Locations
- Nature (publishedVersion, cc-by)
- bioRxiv (Cold Spring Harbor Laboratory) (acceptedVersion, cc-by-nc-nd)
- PubMed (publishedVersion)
- PubMed Central (submittedVersion, cc-by)
- Funders
- National Science Foundation
- Silicon Valley Community Foundation (CZF2019-002440)
- Simons Foundation Autism Research Initiative (724430)
- Boehringer Ingelheim Fonds
- Schweizerischer Nationalfonds zur Förderung der Wissenschaftlichen Forschung (192604, 310030)
- Österreichischen Akademie der Wissenschaften (SFB F78)
- Topics
- Life Sciences › Biochemistry, Genetics and Molecular Biology › Molecular Biology › Pluripotent Stem Cells Research
- Life Sciences › Biochemistry, Genetics and Molecular Biology › Genetics › Genetics and Neurodevelopmental Disorders
- Life Sciences › Neuroscience › Cognitive Neuroscience › Autism Spectrum Disorder Research
- Keywords
- autism spectrum disorder, brain organoids, single-cell transcriptomics, cell fate determination, gene regulatory networks, ARID1B, oligodendrocyte precursor cells, excitatory neurons, neurodevelopmental disorders, susceptibility genes
- MeSH terms
- Autism Spectrum Disorder, Gene Editing, Loss of Function Mutation, CRISPR-Associated Protein 9, Single-Cell Gene Expression Analysis, RNA, Guide, CRISPR-Cas Systems, Autistic Disorder, Brain, Developmental Disabilities, Chromatin, DNA Helicases, DNA-Binding Proteins, Humans, Mosaicism, Neurons, Nuclear Proteins, Organoids, Transcription Factors, Transcription, Genetic, Cell Lineage, CRISPR-Cas Systems
About these checks
Registry, retraction, Cites and statistics results are computed, not judged, with one exception: a printed reference that no index lists is read once by a model before it counts as a citation error. Claims are extracted by a model and kept only when their quote appears verbatim in the text; each cited source is then checked, with a model’s help, for whether it says what the claim relies on. Those verdicts can be wrong — read the claim’s quote and the cited source before relying on one.
A language model drew the claims from the paper on 2026-10-23, under version 3 of the claim definition (model deepseek-v4.1-flash, prompt extract-v3).
A second model labelled each claim on 2026-10-23 (model jev-1.13-20260917, definition revision gold-guideline-v0.2).
Cited sources are checked with a language model’s help (gpt-6-sol).
Statistics and arithmetic are recomputed, not judged.
Confidence bands are shown only for fields calibrated on our annotated test set. None is calibrated yet, so no band is shown.
What counts as a claim ›How we measure confidence ›How we check this ›
Are you an author, or do you see a problem with this page? Request a review
