

The DOI matches its Crossref record; 59 of the 60 references it cites were found in a registry or an index; 23 of the 28 sources its claims cite were checked for support.
Clonal hematopoiesis is associated with protection from Alzheimer’s disease
Open accessPublished version of a preprint
Abstract
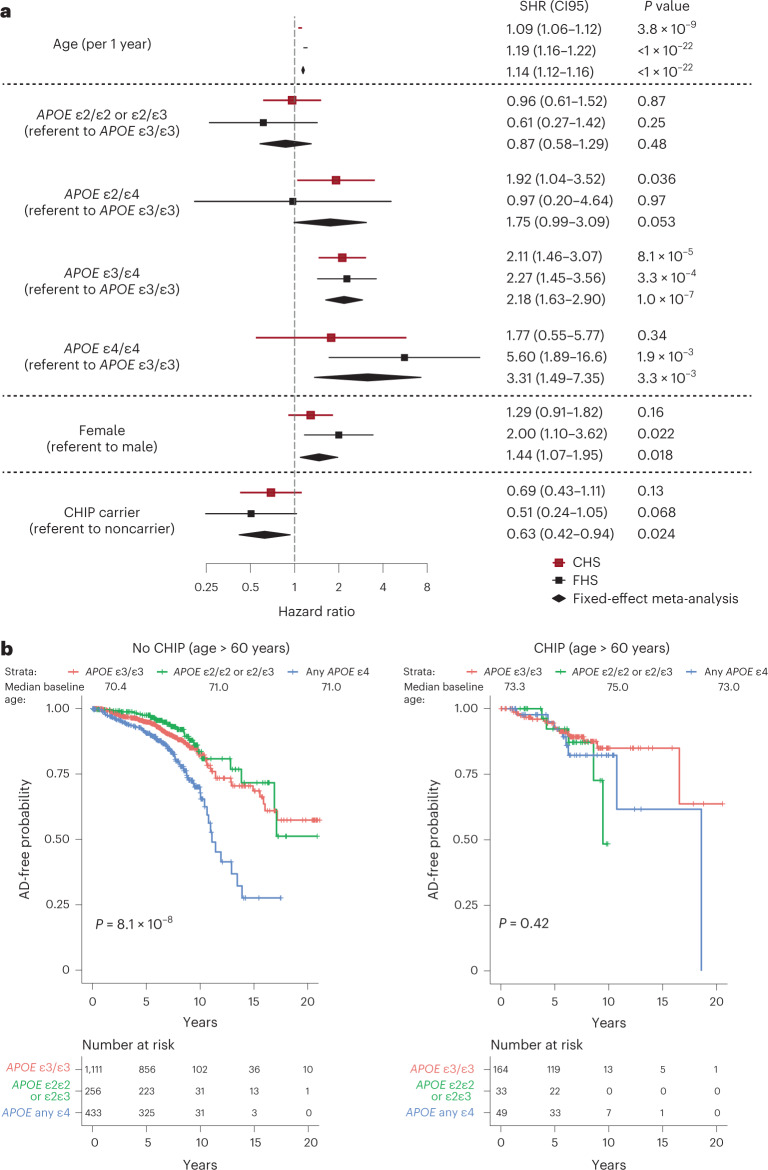
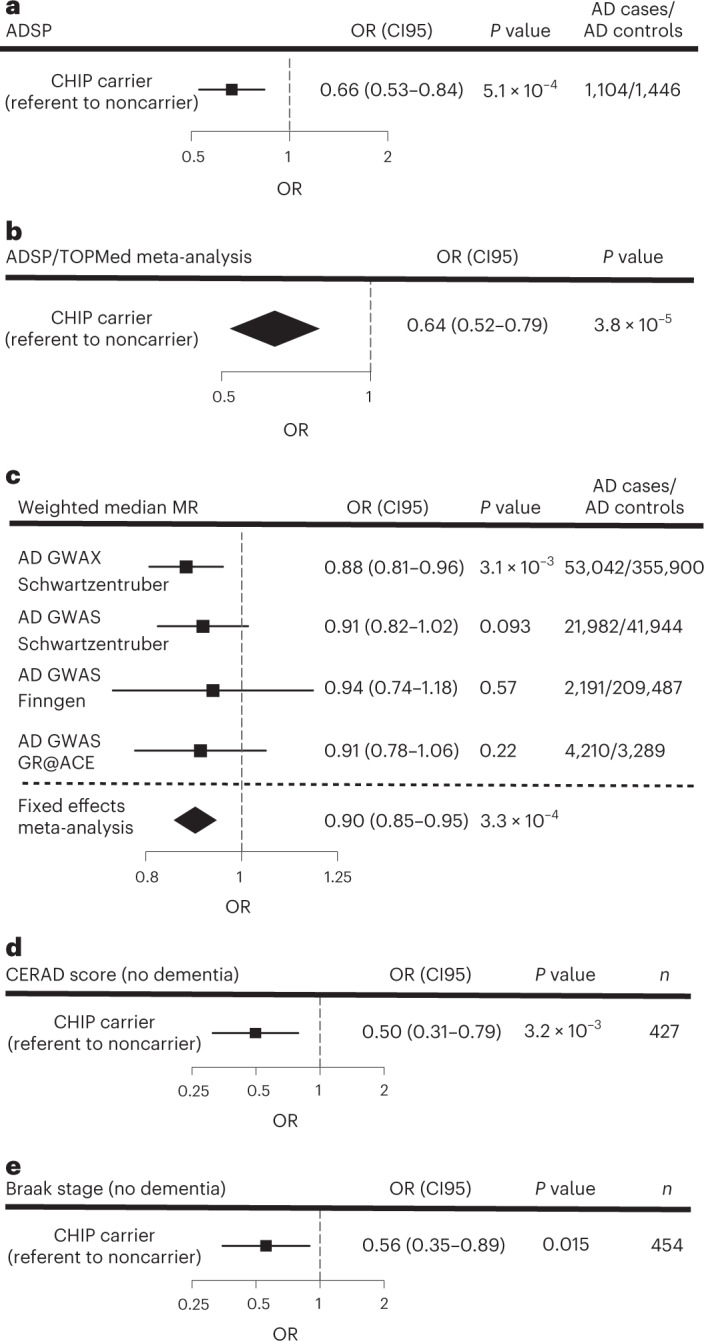
Clonal hematopoiesis of indeterminate potential (CHIP) is a premalignant expansion of mutated hematopoietic stem cells. As CHIP-associated mutations are known to alter the development and function of myeloid cells, we hypothesized that CHIP may also be associated with the risk of Alzheimer’s disease (AD), a disease in which brain-resident myeloid cells are thought to have a major role. To perform association tests between CHIP and AD dementia, we analyzed blood DNA sequencing data from 1,362 individuals with AD and 4,368 individuals without AD. Individuals with CHIP had a lower risk of AD dementia (meta-analysis odds ratio (OR) = 0.64, P = 3.8 × 10 −5 ), and Mendelian randomization analyses supported a potential causal association. We observed that the same mutations found in blood were also detected in microglia-enriched fraction of the brain in seven of eight CHIP carriers. Single-nucleus chromatin accessibility profiling of brain-derived nuclei in six CHIP carriers revealed that the mutated cells comprised a large proportion of the microglial pool in the samples examined. While additional studies are required to validate the mechanistic findings, these results suggest that CHIP may have a role in attenuating the risk of AD.
Overview
AI snapshot
Written from the paper’s full text.
TL;DR
Clonal hematopoiesis of indeterminate potential (CHIP) was associated with lower risk of Alzheimer’s disease (AD) dementia across cohorts, with Mendelian randomization supporting a potential causal protective effect. CHIP-mutant cells were also detected in brain microglia-enriched fractions, suggesting marrow-derived myeloid cells may infiltrate the brain and influence AD risk.
Key findings
- In a meta-analysis of ADSP, CHS, and FHS, CHIP carriers had lower risk of AD dementia (OR = 0.64, P = 3.8 × 10⁻⁵); in ADSP APOE ε3ε3 participants, CHIP with VAF > 0.08 was associated with lower AD risk (OR = 0.66, P = 5.5 × 10⁻⁴).
- Mendelian randomization using 24 CHIP-associated polymorphisms found higher genetic risk of CHIP associated with reduced odds of AD (OR = 0.90 per 1 log-odds increase in CHIP risk, P = 3.3 × 10⁻⁴), while reverse-direction MR showed no evidence (OR = 0.97, P = 0.26).
- CHIP was associated with lower AD neuropathologic change in participants without dementia: lower CERAD neuritic plaque score (OR = 0.50, P = 3.2 × 10⁻³) and lower Braak stage (OR = 0.56, P = 0.015).
- CHIP variants were detected in the microglia-enriched NeuN− c-MAF+ brain fraction in seven of eight CHIP carriers; snATAC-seq estimated 30% to 95% of microglia were mutant in six CHIP samples, and microglia proportion among glia was higher in CHIP carriers (8.2%) than controls (5.1%; P = 0.042).
Methods
- Association analyses used blood DNA sequencing from TOPMed cohorts FHS (n = 2,437; 92 incident AD) and CHS (n = 743; 166 incident AD), plus ADSP case-control WES limited to APOE ε3ε3 individuals (1,104 AD cases, 1,446 controls), with CHIP defined from curated gene variants and VAF cutoffs.
- Time-to-event competing risks regression, logistic regression, fixed-effects meta-analysis, and Mendelian randomization were used; ADSP autopsy subsets were analyzed for CERAD score (n = 427) and Braak stage (n = 454) by ordinal logistic regression.
- Brain validation used postmortem ACT samples from eight CHIP carriers and four noncarriers, with nuclei isolation, NeuN/c-MAF sorting, amplicon sequencing, and snATAC-seq of 94,367 high-quality nuclei plus reference datasets.
Limitations
- The paper states that no differences in chromatin accessibility were found between microglia from CHIP carriers and noncarriers that could explain AD protection, possibly due to limited sample size, mutational heterogeneity, or assessment only in people without AD or significant ADNC.
- The paper states it cannot conclude that protection from AD is due to infiltrating mutant cells; identifying biologically meaningful differences between mutant and wild-type microglia would strengthen the causal hypothesis.
- Evident from the text: brain mechanistic analyses relied on small numbers of donors (eight CHIP carriers, four noncarriers; six with snATAC-seq), and the ADSP association replication was restricted to APOE ε3ε3 individuals because of age/sex imbalance in other genotype groups.
Model-written summary. Check it against the paper before relying on it.
Integrity signals
Registry
Cites
Statistics
Figures
Verification
Claims the paper makes
43 Own result · 27 Own method · 15 Own interpretation · 9 Supported · 6 Partly supported · 5 No basis given · 3 No full text of the sources · 1 Supported so far · 1 Couldn’t confirm · accuracy not yet measured
The cited sources support only part of this claim — read each source’s verdict below.
In the paper
“As CHIP-associated mutations are known to alter the development and function of myeloid cells”
- Also stated in: § Main · plain
“Because CHIP-associated mutations influence the function of myeloid cells8,11,14, we tested whether CHIP was associated with the risk of AD.”
§ Clonal hematopoiesis is associated with protection from Alzheimer’s disease > Abstract
What the sources say
- Partly supportedcites [8] Jaiswal, S. et al. Clonal hematopoiesis and risk of atherosclerotic cardiovascular disease. N. Engl. J. Med. 377, 111–121 (2017). sourceExperimental — accuracy not yet measured
The Results section on Tet2 loss in myeloid cells reports altered macrophage inflammatory gene expression and secretion, supporting an effect on myeloid-cell function. The Introduction says CHIP-associated mutations give hematopoietic stem cells a selective advantage, but does not establish that they alter myeloid-cell development; the demonstrated functional effect is chiefly for Tet2, not CHIP-associated mutations generally. The copy provides no page numbers for these passages. (LLM, conf=0.85)
- Partly supportedcites [11] Fuster, J. J. et al. Clonal hematopoiesis associated with TET2 deficiency accelerates atherosclerosis development in mice. Science 355, 842–847 (2017). sourceExperimental — accuracy not yet measured
The indexed paper reports that TET2-deficient cells in mice show a myeloid differentiation bias and that TET2-deficient macrophages have altered inflammatory responses. This supports the claim for TET2, but the paper does not establish the same effects for CHIP-associated mutations generally. The indexed passages are labeled “Abstract”; no page numbers are supplied. (LLM, conf=0.84)
- Partly supportedcites [14] Zhang, Q. et al. Tet2 is required to resolve inflammation by recruiting Hdac2 to specifically repress IL-6. Nature 525, 389–393 (2015). sourceExperimental — accuracy not yet measured
The paper reports that Tet2 deficiency changes inflammatory gene expression and IL-6 production in dendritic cells and macrophages, supporting an effect on myeloid-cell function. But it explicitly says developmental defects in those cells were not observed (main text, Extended Data Fig. 1f), and its findings concern Tet2 loss rather than CHIP-associated mutations generally. (LLM, conf=0.88)
boosteddirect- Asserted: passes — The authors put it forward as true.
- Checkable: passes — It can be checked against evidence.
- Load-bearing: passes — The paper’s conclusions depend on it.
- Based: passes — The paper gives a reason why it holds.
- Also stated in: § Main · plain
Every source the paper cites for this claim was checked and supports it.
In the paper
“Genome-wide association studies (GWAS) have implicated functional alterations of microglia (MG), the macrophage-like hematopoietic cells in the brain, as a major driver of AD risk13.”
§ Clonal hematopoiesis is associated with protection from Alzheimer’s disease > Main
What the sources say
- Supportedcites [13] Nott, A. et al. Brain cell type-specific enhancer-promoter interactome maps and disease-risk association. Science 366, 1134–1139 (2019). source
The paper’s Abstract (page unavailable) reports that sporadic AD risk variants were largely confined to microglia enhancers and linked to an extended microglia gene network. It also reports that deleting an AD-risk enhancer abolished BIN1 expression in microglia but not in neurons or astrocytes, supporting the claim’s broad paraphrase about microglial function and AD risk. (LLM, conf=0.87)
plaindirect- Asserted: passes — The authors put it forward as true.
- Checkable: passes — It can be checked against evidence.
- Load-bearing: passes — The paper’s conclusions depend on it.
- Based: passes — The paper gives a reason why it holds.
- Supported
Every source the paper cites for this claim was checked and supports it.
In the paper
“we also performed two-sample MR using 36 polymorphisms for risk of AD as the instruments18 and CHIP as the outcome, which found no evidence of a causal effect in this direction (OR = 0.97 per 1 log-odds increase in risk of AD, P = 0.26 using the weighted median estimator).”
§ Clonal hematopoiesis is associated with protection from Alzheimer’s disease > Results > Mendelian randomization analyses of CHIP and AD
What the sources say
- Supportedcites [18] Schwartzentruber, J. et al. Genome-wide meta-analysis, fine-mapping and integrative prioritization implicate new Alzheimer’s disease risk genes. Nat. Genet. 53, 392–402 (2021). source
The citation is attached to the AD-risk polymorphisms used as instruments, not to the citing authors’ MR result. The source reports AD-risk loci in Results and discusses lead SNPs across 36 loci in Extended Data Fig. 2, supporting its use as the source of AD-risk variants. (LLM, conf=0.86)
plain- Asserted: passes — The authors put it forward as true.
- Checkable: passes — It can be checked against evidence.
- Load-bearing: passes — The paper’s conclusions depend on it.
- Based: passes — The paper gives a reason why it holds.
- Supported
Every source the paper cites for this claim was checked and supports it.
In the paper
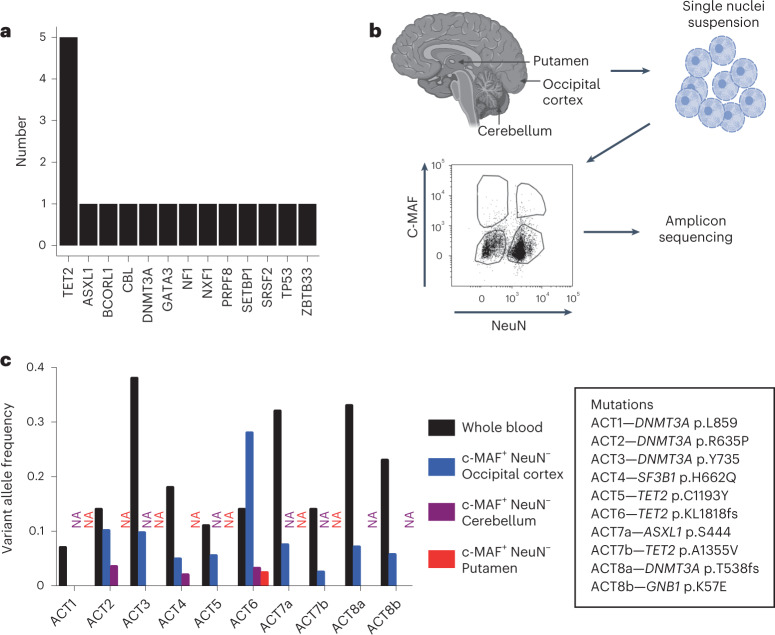
“Similar to a prior study22, we found mutations consistent with CHIP in 17 brain samples (Fig. 4a and Supplementary Table 13), although paired blood samples were not available for this set.”
§ Clonal hematopoiesis is associated with protection from Alzheimer’s disease > Results > Detection of CHIP variants in the human brain
What the sources say
- Supportedcites [22] Keogh, M. J. et al. High prevalence of focal and multi-focal somatic genetic variants in the human brain. Nat. Commun. 9, 4257 (2018). source
The citation is attached to “Similar to a prior study,” not to the citing authors’ finding of 17 ADSP brain samples. In Results and Discussion, “Multiple regional mutations” (page unavailable), the source reports brain mutations in genes associated with clonal haematopoiesis and says particular mutations strongly support a clonal haematopoietic origin. Its study used 54 brains, so it does not establish the citing authors’ 17-of-1,776 figure. (LLM, conf=0.91)
plainn = 17- Asserted: passes — The authors put it forward as true.
- Checkable: passes — It can be checked against evidence.
- Load-bearing: passes — The paper’s conclusions depend on it.
- Based: passes — The paper gives a reason why it holds.
- Supported
The cited sources that could be checked couldn’t confirm or dispute this claim.
In the paper
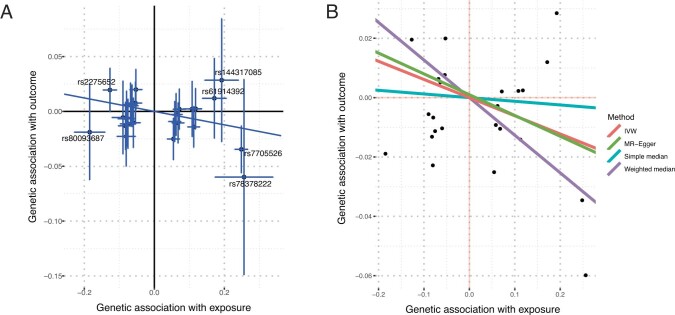
“One- and two-sample MR using 24 CHIP-associated polymorphisms18 as the instruments (Supplementary Table 7) found that higher genetic risk of CHIP was associated with reduced odds of AD using the weighted median estimator (OR = 0.90 per 1 log-odds increase in risk of CHIP, P = 3.3 × 10⁻⁴, Fig. 2c).”
§ Clonal hematopoiesis is associated with protection from Alzheimer’s disease > Results > Mendelian randomization analyses of CHIP and AD
What the sources say
- Could not verifycites [18] Schwartzentruber, J. et al. Genome-wide meta-analysis, fine-mapping and integrative prioritization implicate new Alzheimer’s disease risk genes. Nat. Genet. 53, 392–402 (2021). sourceExperimental — accuracy not yet measured
The Results section reports an Alzheimer’s disease GWAS meta-analysis, and Online Methods describes fine-mapping and AD meta-analysis, but neither reports the claimed CHIP Mendelian-randomization result. Searches for CHIP, Mendelian randomization, the weighted-median estimate, and the stated P value found no passage addressing it. (LLM, conf=0.76)
plaincorrelational- Asserted: passes — The authors put it forward as true.
- Checkable: passes — It can be checked against evidence.
- Load-bearing: passes — The paper’s conclusions depend on it.
- Based: passes — The paper gives a reason why it holds.
- Could not verify
Every source the paper cites for this claim was checked and supports it.
In the paper
“We further used the MR-PRESSO global test49 to assess for horizontal pleiotropy and found no significant P values in the four studies used in the MR meta-analysis (UKB GWAX P = 0.07, UKB GWAS P = 0.20, FinnGen P = 0.84 and GR@ACE P = 0.91, all P values unadjusted for multiple comparisons).”
§ Clonal hematopoiesis is associated with protection from Alzheimer’s disease > Methods > Statistical analysis plan
What the sources say
- Supportedcites [49] Verbanck, M., Chen, C. Y., Neale, B. & Do, R. Detection of widespread horizontal pleiotropy in causal relationships inferred from Mendelian randomization between complex traits and diseases. Nat. Genet. 50, 693–698 (2018). source
The citation identifies the MR-PRESSO global test used by the citing authors, not the source of their four study-specific P values. The source paper’s Results section states that it developed MR-PRESSO and that its global test evaluates horizontal pleiotropy; the P values are presented as the citing authors’ own findings. (LLM, conf=0.94)
plain- Asserted: passes — The authors put it forward as true.
- Checkable: passes — It can be checked against evidence.
- Load-bearing: passes — The paper’s conclusions depend on it.
- Based: passes — The paper gives a reason why it holds.
- Supported
Every source the paper cites for this claim was checked and supports it.
In the paper
“CHIP is known to be associated with atherosclerotic cardiovascular disease11.”
§ Clonal hematopoiesis is associated with protection from Alzheimer’s disease > Methods > Statistical analysis plan
What the sources say
- Supportedcites [11] Fuster, J. J. et al. Clonal hematopoiesis associated with TET2 deficiency accelerates atherosclerosis development in mice. Science 355, 842–847 (2017). source
The paper states that clonal hematopoiesis correlates with an increased risk of atherosclerotic cardiovascular disease. Its discussion of prior human studies also reports an association with coronary heart disease and stroke, while distinguishing association from causation. (LLM, conf=0.93)
boostedcorrelational- Asserted: passes — The authors put it forward as true.
- Checkable: passes — It can be checked against evidence.
- Load-bearing: passes — The paper’s conclusions depend on it.
- Based: passes — The paper gives a reason why it holds.
- Supported
Every source the paper cites for this claim was checked and supports it.
In the paper
“we noticed that there were multiple shared loci in the CHIP GWAS and a recent GWAS for hypertension51”
§ Clonal hematopoiesis is associated with protection from Alzheimer’s disease > Methods > Statistical analysis plan
What the sources say
- Supportedcites [51] Evangelou, E. et al. Genetic analysis of over 1 million people identifies 535 new loci associated with blood pressure traits. Nat. Genet. 50 1412–1425 (2018). source
The Online Methods (International Consortium for Blood Pressure GWAS) identify this as a blood-pressure genetics GWAS, and the Results (Association lookups with other traits and diseases) describe its associated loci. The citing authors say 'we noticed' the overlap with their CHIP GWAS; they cite this paper to identify the blood-pressure GWAS, not as the source of that observation. (LLM, conf=0.90)
plaincorrelational- Asserted: passes — The authors put it forward as true.
- Checkable: passes — It can be checked against evidence.
- Load-bearing: passes — The paper’s conclusions depend on it.
- Based: passes — The paper gives a reason why it holds.
- Supported
A result the paper reports from its own data — it cites no other source for it, so there is none to check. The quote shows it is in the paper.
In the paper
“We detected the same mutations that were present in blood in six of eight unfractionated brains with VAF ranging from 0.004 to 0.02”
§ Clonal hematopoiesis is associated with protection from Alzheimer’s disease > Results > Detection of CHIP variants in the human brain
plainn = 6- Asserted: passes — The authors put it forward as true.
- Checkable: passes — It can be checked against evidence.
- Load-bearing: passes — The paper’s conclusions depend on it.
- Based: passes — The paper gives a reason why it holds.
A result the paper reports from its own data — it cites no other source for it, so there is none to check. The quote shows it is in the paper.
In the paper
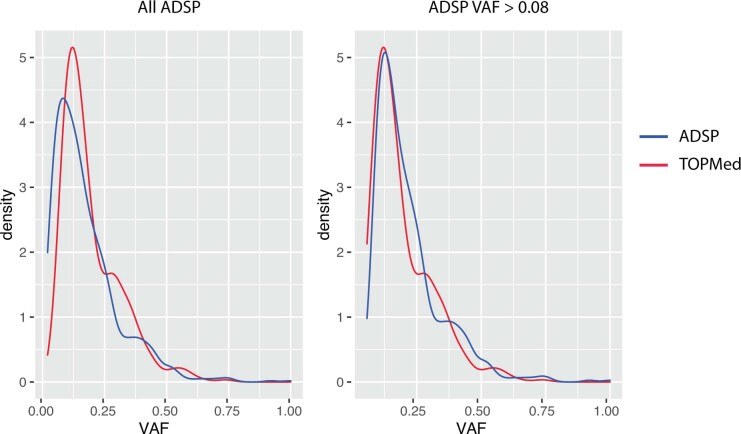
“We found that CHIP with VAF > 0.08 was associated with lower risk of AD dementia in ADSP using logistic regression (odds ratio (OR) = 0.66, P = 5.5 × 10⁻⁴; Fig. 2a and Supplementary Table 5).”
§ Clonal hematopoiesis is associated with protection from Alzheimer’s disease > Results > Association between CHIP and AD dementia
plaincorrelational- Asserted: passes — The authors put it forward as true.
- Checkable: passes — It can be checked against evidence.
- Load-bearing: passes — The paper’s conclusions depend on it.
- Based: passes — The paper gives a reason why it holds.
- Probably not a substantial claim. 33
- It may state two separate claims as one. 22
The cited sources support only part of this claim — read each source’s verdict below.
In the paper
“APOE genotype is the strongest genetic risk factor for AD21, with APOE ε2 conferring protection from disease and APOE ε4 conferring higher risk, compared to the APOE ε3 allele”
§ Clonal hematopoiesis is associated with protection from Alzheimer’s disease > Results > Stratified associations between CHIP and AD
What the sources say
- Partly supportedcites [21] Yamazaki, Y., Zhao, N., Caulfield, T. R., Liu, C. C. & Bu, G. Apolipoprotein E and Alzheimer disease: pathobiology and targeting strategies. Nat. Rev. Neurol. 15, 501–518 (2019). sourceExperimental — accuracy not yet measured
The Introduction identifies APOE as a major risk determinant of late-onset AD and says ε2 is associated with decreased risk and ε4 with increased risk relative to ε3. It does not establish that APOE is the strongest genetic risk factor for AD generally; its risk-factor framing is specifically about late-onset AD. (LLM, conf=0.85)
plaindirect- Asserted: passes — The authors put it forward as true.
- Checkable: passes — It can be checked against evidence.
- Load-bearing: fails — The paper’s conclusions may not depend on it.
- Based: passes — The paper gives a reason why it holds.
Probably not a substantial claim. The paper’s conclusions may not depend on it. It may state two separate claims as one.
- Partly supported
The cited sources support only part of this claim — read each source’s verdict below.
In the paper
“Clone size, which is approximated by the variant allele fraction (VAF), has previously been shown to be an important predictor of risk for blood cancer1,17 and cardiovascular outcomes8,9.”
§ Clonal hematopoiesis is associated with protection from Alzheimer’s disease > Results > Association between CHIP and AD dementia
What the sources say
- Supportedcites [1] Jaiswal, S. et al. Age-related clonal hematopoiesis associated with adverse outcomes. N. Engl. J. Med. 371, 2488–98 (2014). source
The Results section on hematologic cancer reports substantially higher risk at a variant allele fraction of 0.10 or greater and a higher mean fraction among people who subsequently developed cancer. The cardiometabolic-disease Results section reports greater cardiovascular risk among mutation carriers with a variant allele fraction of 0.10 or greater. The paper also describes that fraction as indicating the proportion of blood cells carrying the mutation. (LLM, conf=0.93)
- Supportedcites [17] Abelson, S. et al. Prediction of acute myeloid leukaemia risk in healthy individuals. Nature 559, 400–404 (2018). source
The paper reports that the size of the largest driver clone was strongly associated with AML progression risk and that risk from individual mutations was generally proportional to VAF (Abstract passage [6]). The cardiovascular-outcomes part of the citing sentence carries separate citations and is not attributed to this source. (LLM, conf=0.92)
- Supportedcites [8] Jaiswal, S. et al. Clonal hematopoiesis and risk of atherosclerotic cardiovascular disease. N. Engl. J. Med. 377, 111–121 (2017). source
The Results section uses variant allele fraction as a measure of clone size and reports greater hematologic-malignancy risk for larger clones. The Discussion states that coronary events increased with clone size and that imaging showed a dose-response relationship between clone size and atherosclerosis. Page numbers were not available in our copy. (LLM, conf=0.93)
- Partly supportedcites [9] Bick, A. G. et al. Inherited causes of clonal haematopoiesis in 97,691 whole genomes. Nature 586, 763–768 (2020). sourceExperimental — accuracy not yet measured
Extended Data Fig. 1 (page unavailable) explicitly uses variant allele fraction to measure CHIP clone size. The Abstract and ‘Germline genetic determinants of CHIP’ section (pages unavailable) describe associations between CHIP and hematologic cancer or cardiovascular disease, but do not establish that clone size predicts risk for either outcome. (LLM, conf=0.86)
plaincorrelational- Asserted: passes — The authors put it forward as true.
- Checkable: passes — It can be checked against evidence.
- Load-bearing: fails — The paper’s conclusions may not depend on it.
- Based: passes — The paper gives a reason why it holds.
Probably not a substantial claim. The paper’s conclusions may not depend on it.
- Supported
Every source the paper cites for this claim was checked and supports it.
In the paper
“which is the most protective common inherited variant for AD26.”
§ Clonal hematopoiesis is associated with protection from Alzheimer’s disease > Discussion
What the sources say
- Supportedcites [26] Serrano-Pozo, A., Das, S. & Hyman, B. T. APOE and Alzheimer’s disease: advances in genetics, pathophysiology, and therapeutic approaches. Lancet Neurol. 20, 68–80 (2021). source
The Introduction calls the APOE ε2 allele “by far the strongest genetic protective factor against sporadic Alzheimer’s disease.” It describes ε2 as relatively rare, but that does not undermine the claim that it is the most protective common inherited variant. (LLM, conf=0.91)
plaincorrelational- Asserted: passes — The authors put it forward as true.
- Checkable: passes — It can be checked against evidence.
- Load-bearing: fails — The paper’s conclusions may not depend on it.
- Based: passes — The paper gives a reason why it holds.
Probably not a substantial claim. The paper’s conclusions may not depend on it.
- Supported
Every source the paper cites for this claim was checked and supports it.
In the paper
“a recent paper found that the genetic liability of CHIP was associated with an increased risk of lung, prostate, ovarian, oral and endometrial cancers7”
§ Clonal hematopoiesis is associated with protection from Alzheimer’s disease > Methods > Statistical analysis plan
What the sources say
- Supportedcites [7] Kar, S. P. et al. Genome-wide analyses of 200,453 individuals yield new insights into the causes and consequences of clonal hematopoiesis. Nat. Genet. https://doi.org/10.1038/s41588-022-01121-z (2022). source
The Results section (Mendelian randomization analyses) explicitly reports increased risks of lung, prostate, ovarian, oral cavity/pharyngeal, and endometrial cancers associated with genetic liability to clonal hematopoiesis. The citing sentence accurately paraphrases that finding. (LLM, conf=0.95)
plaincorrelational- Asserted: passes — The authors put it forward as true.
- Checkable: passes — It can be checked against evidence.
- Load-bearing: fails — The paper’s conclusions may not depend on it.
- Based: passes — The paper gives a reason why it holds.
Probably not a substantial claim. The paper’s conclusions may not depend on it.
- Supported
The sources with a verdict support this claim; the rest weren’t checked yet, have no full text we could read, or their verdicts aren’t rated yet.
In the paper
“Marrow-derived cells may have an ameliorative effect on neurodegenerative phenotypes in mice33,34, possibly due to their superior phagocytic capacity35.”
§ Clonal hematopoiesis is associated with protection from Alzheimer’s disease > Discussion
What the sources say
- Not checked — no full text of the sourcecites [33] Simard, A. R., Soulet, D., Gowing, G., Julien, J. P. & Rivest, S. Bone marrow-derived microglia play a critical role in restricting senile plaque formation in Alzheimer’s disease. Neuron 49, 489–502 (2006). source
- Not checked — no full text of the sourcecites [34] El Khoury, J. et al. Ccr2 deficiency impairs microglial accumulation and accelerates progression of Alzheimer-like disease. Nat. Med. 13, 432–438 (2007). source
- Supportedcites [35] Lund, H. et al. Competitive repopulation of an empty microglial niche yields functionally distinct subsets of microglia-like cells. Nat. Commun. 9, 4845 (2018). source
Citation 35 is attached to the proposed superior phagocytic capacity, not the preceding claim about ameliorating neurodegenerative phenotypes. In Results (‘Repopulating cells differ transcriptionally and functionally’; page unavailable), the paper reports greater uptake of bacterial microparticles and labeled myelin by monocyte-derived macrophages than by resident or repopulated microglia. (LLM, conf=0.93)
hedgedconditional- Asserted: passes — The authors put it forward as true.
- Checkable: passes — It can be checked against evidence.
- Load-bearing: passes — The paper’s conclusions depend on it.
- Based: passes — The paper gives a reason why it holds.
Probably not a substantial claim. It may state two separate claims as one.
Every source the paper cites for this claim was checked and supports it.
In the paper
“previous observational studies have found inverse associations between cancer and AD, but the mechanism for this is unknown50”
§ Clonal hematopoiesis is associated with protection from Alzheimer’s disease > Methods > Statistical analysis plan
What the sources say
- Supportedcites [50] Ospina-Romero, M. et al. Association between Alzheimer disease and cancer with evaluation of study biases: a systematic review and meta-analysis. JAMA Netw. Open 3, e2025515 (2020). source
The Introduction reports that observational studies have consistently found an inverse association between cancer and Alzheimer disease. It presents a shared biological cause as a hypothesis, while the Conclusions say survival bias cannot yet be ruled out and further studies are needed to determine the explanation. (LLM, conf=0.92)
plaincorrelational- Asserted: passes — The authors put it forward as true.
- Checkable: passes — It can be checked against evidence.
- Load-bearing: fails — The paper’s conclusions may not depend on it.
- Based: passes — The paper gives a reason why it holds.
Probably not a substantial claim. The paper’s conclusions may not depend on it. It may state two separate claims as one.
- Supported
The cited sources support only part of this claim — read each source’s verdict below.
In the paper
“There is a growing body of evidence from mice that bone marrow-derived myeloid cells can enter the brain during homeostasis31,32.”
§ Clonal hematopoiesis is associated with protection from Alzheimer’s disease > Discussion
What the sources say
- Partly supportedcites [31] Cugurra, A. et al. Skull and vertebral bone marrow are myeloid cell reservoirs for the meninges and CNS parenchyma. Science 373, eabf7844 (2021). sourceExperimental — accuracy not yet measured
The Introduction and Results report that, in mice, bone marrow-derived myeloid cells reach the dural meninges and other brain borders under homeostatic conditions. They distinguish this from entry into CNS parenchyma, which the paper reports following injury or neuroinflammation. Thus the source supports homeostatic entry to brain borders, but not clearly entry into brain tissue during homeostasis. (LLM, conf=0.87)
- Partly supportedcites [32] Herisson, F. et al. Direct vascular channels connect skull bone marrow and the brain surface enabling myeloid cell migration. Nat. Neurosci. 21, 1209–1217 (2018). sourceExperimental — accuracy not yet measured
The Results section (“Tracking cell origins in different inflammatory sites”; page unavailable) reports skull marrow-derived cells in mouse brain parenchyma after induced meningoencephalitis. That supports entry into the brain, but the paper studies stroke and induced inflammation; it does not establish entry during homeostasis. (LLM, conf=0.86)
plain- Asserted: passes — The authors put it forward as true.
- Checkable: passes — It can be checked against evidence.
- Load-bearing: passes — The paper’s conclusions depend on it.
- Based: passes — The paper gives a reason why it holds.
Probably not a substantial claim.
- Partly supported
The cited sources support only part of this claim — read each source’s verdict below.
In the paper
“as CHIP mutations are known to increase the fitness of HSCs and myeloid progenitors5”
§ Clonal hematopoiesis is associated with protection from Alzheimer’s disease > Results > Single-nucleus chromatin accessibility profiling of human brains
What the sources say
- Partly supportedcites [5] Jaiswal, S. & Elbert, B. L. Clonal hematopoiesis in human aging and disease. Science 366, eaan4673 (2019). sourceExperimental — accuracy not yet measured
The Introduction (page unavailable) describes mutations that confer a fitness advantage on HSCs, and “Mechanisms of clonal expansion” reports an HSC competitive advantage for some CHIP-associated mutations. The paper does not establish increased fitness in myeloid progenitors, and it notes that mice with certain CHIP-associated spliceosome mutations show an HSC competitive disadvantage. Thus the unqualified claim is broader than the evidence in our copy. (LLM, conf=0.86)
boosteddirect- Asserted: passes — The authors put it forward as true.
- Checkable: passes — It can be checked against evidence.
- Load-bearing: passes — The paper’s conclusions depend on it.
- Based: passes — The paper gives a reason why it holds.
Probably not a substantial claim.
- Partly supported
The cited sources support only part of this claim — read each source’s verdict below.
In the paper
“GWAS have strongly implicated microglial genes involved in ligand recognition and phagocytosis, such as APOE, TREM2, CD33 and the MS4A cluster, in the biology of AD36.”
§ Clonal hematopoiesis is associated with protection from Alzheimer’s disease > Discussion
What the sources say
- Partly supportedcites [36] Efthymiou, A. G. & Goate, A. M. Late onset Alzheimer’s disease genetics implicates microglial pathways in disease risk. Mol. Neurodegener. 12, 43 (2017). sourceExperimental — accuracy not yet measured
The AD GWAS studies section links the MS4A cluster to AD risk, and the sequencing and rare-variants section describes TREM2’s role in ligand binding and microglial phagocytosis. The Conclusion also implicates CD33 and TREM2 in phagocytosis. But the common-variants section says the MS4A proteins’ exact function and ligand-binding partners remain unknown, so the claim overstates the evidence that all the listed genes have the stated functions. (LLM, conf=0.86)
boostedcorrelational- Asserted: passes — The authors put it forward as true.
- Checkable: passes — It can be checked against evidence.
- Load-bearing: passes — The paper’s conclusions depend on it.
- Based: passes — The paper gives a reason why it holds.
Probably not a substantial claim.
- Partly supported
A result the paper reports from its own data — it cites no other source for it, so there is none to check. The quote shows it is in the paper.
In the paper
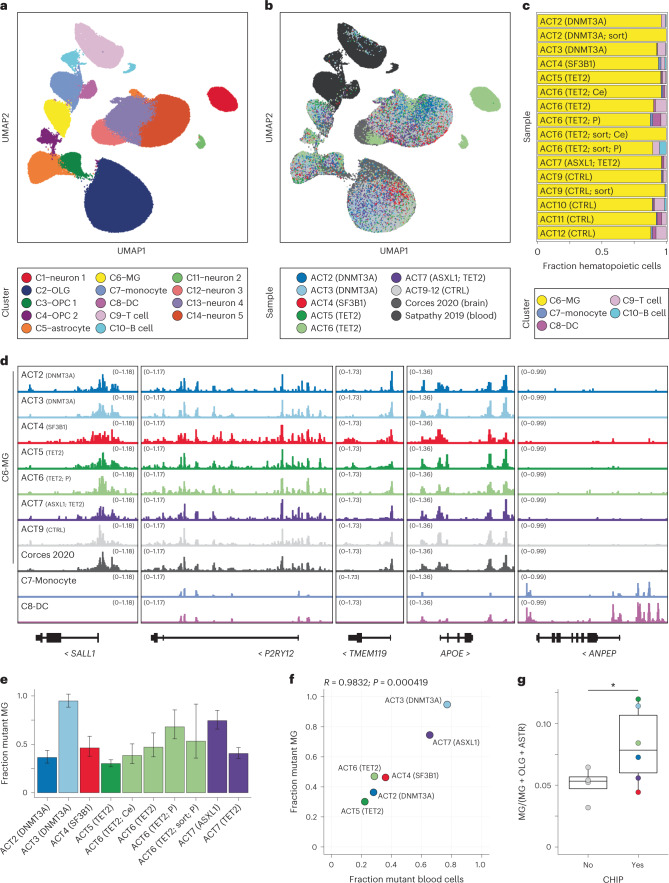
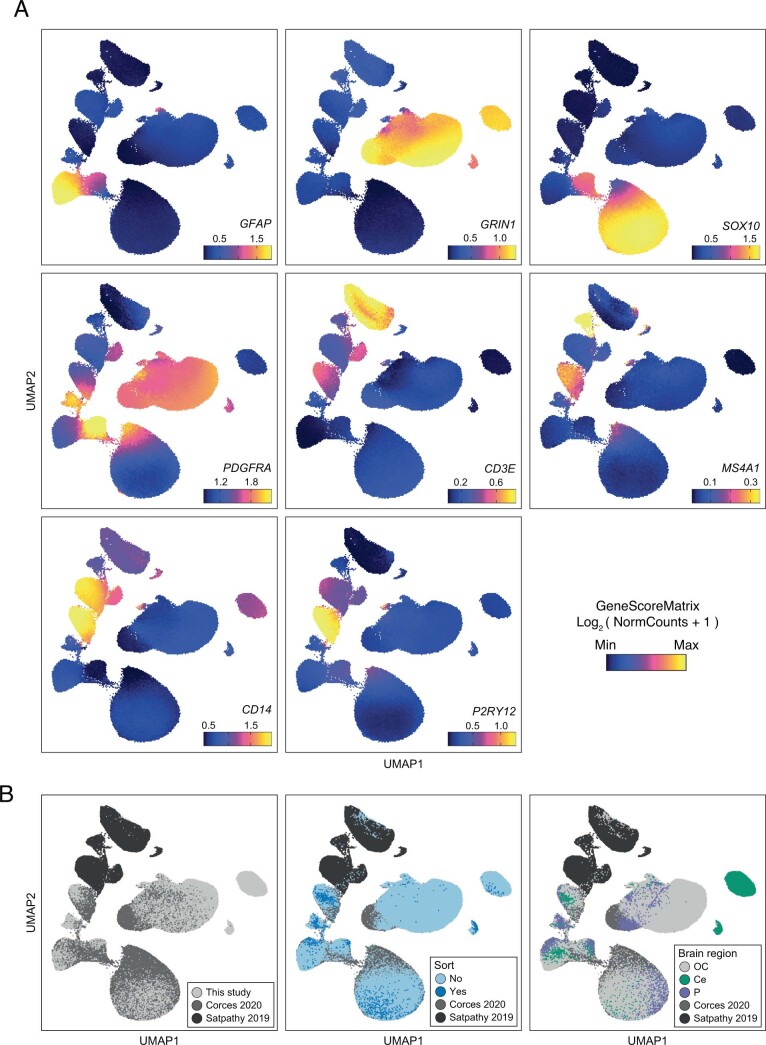
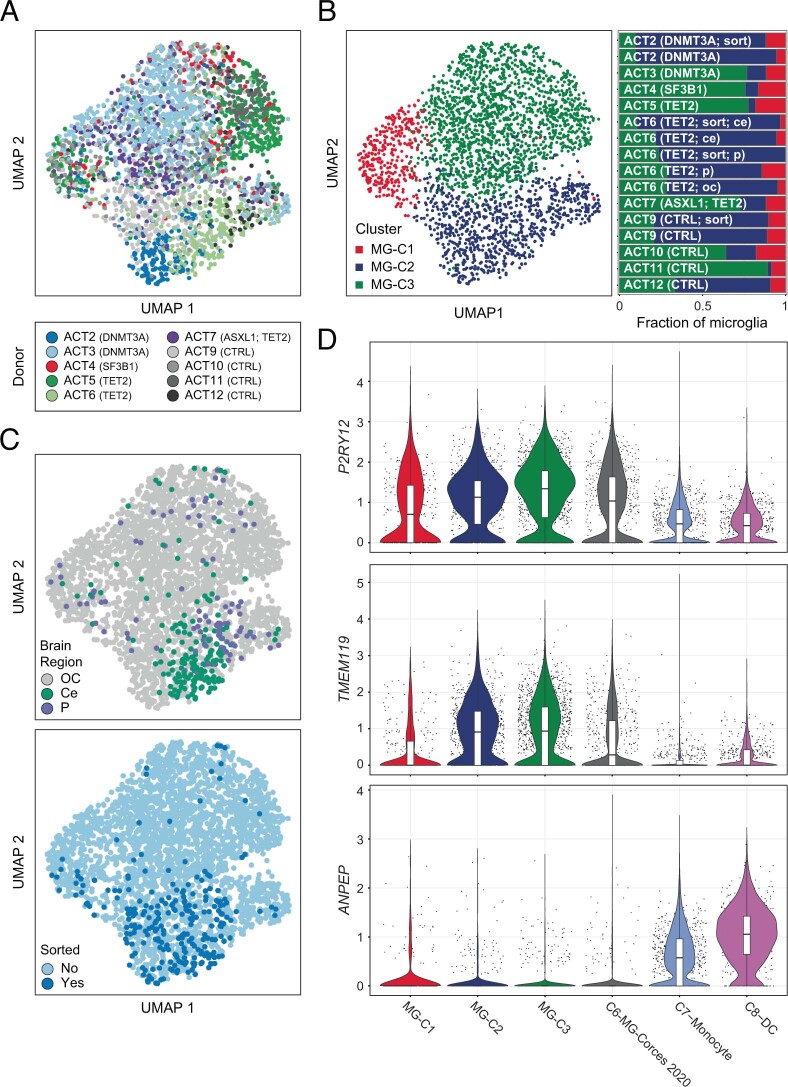
“We identified 14 clusters encompassing the major brain and hematopoietic cell types (Fig. 5a,b), including one cluster that contained previously described MG, as well as myeloid cells from each of our samples (C6; Fig. 5b, Extended Data Fig. 6 and Supplementary Table 15).”
§ Clonal hematopoiesis is associated with protection from Alzheimer’s disease > Results > Single-nucleus chromatin accessibility profiling of human brains
plain- Asserted: passes — The authors put it forward as true.
- Checkable: passes — It can be checked against evidence.
- Load-bearing: unclear — It is unclear whether the paper’s conclusions depend on it.
- Based: passes — The paper gives a reason why it holds.
It may state two separate claims as one.
A result the paper reports from its own data — it cites no other source for it, so there is none to check. The quote shows it is in the paper.
In the paper
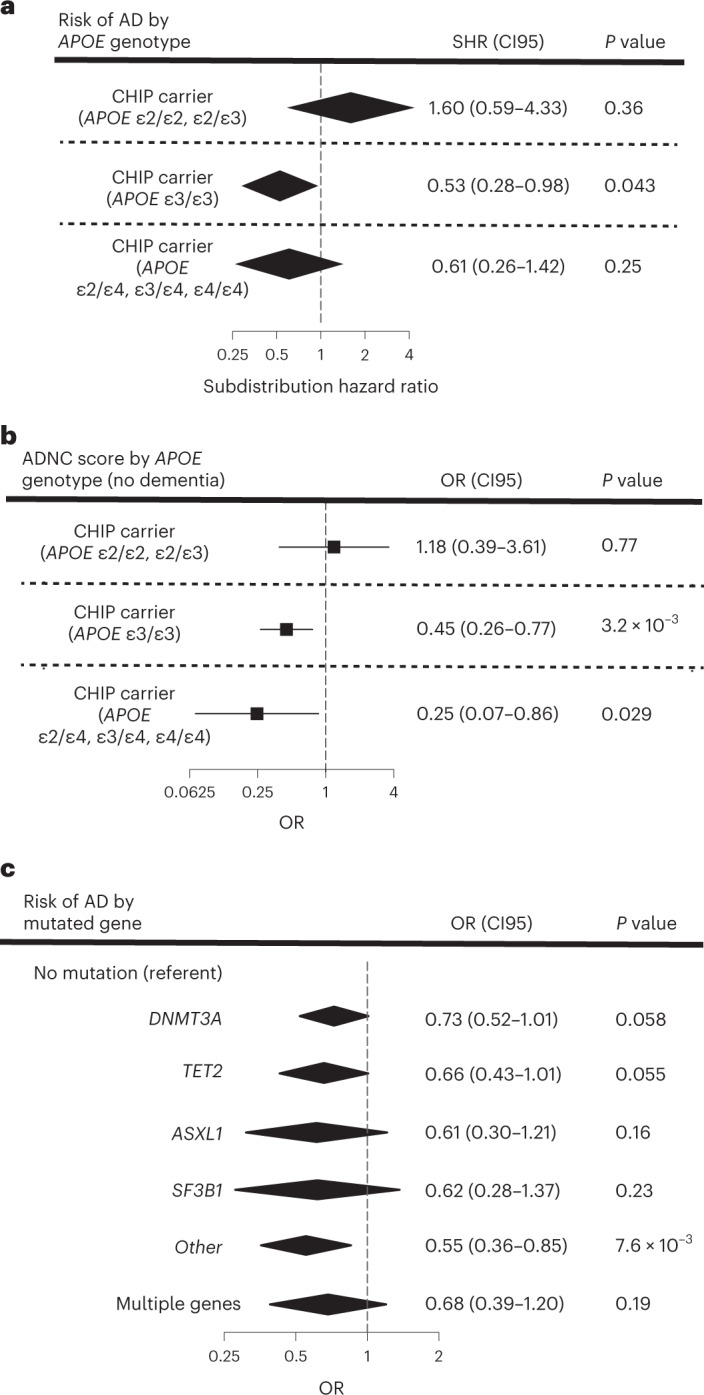
“In CHS and FHS, the decrement in risk for AD dementia associated with CHIP was of a similar magnitude among people with the APOE ε3ε3 genotype or with an APOE ε4 allele, but not seen in those with APOE ε2ε2 or APOE ε2ε3 genotypes”
§ Clonal hematopoiesis is associated with protection from Alzheimer’s disease > Results > Stratified associations between CHIP and AD
plaincorrelational- Asserted: passes — The authors put it forward as true.
- Checkable: passes — It can be checked against evidence.
- Load-bearing: unclear — It is unclear whether the paper’s conclusions depend on it.
- Based: passes — The paper gives a reason why it holds.
It may state two separate claims as one.
A result the paper reports from its own data — it cites no other source for it, so there is none to check. The quote shows it is in the paper.
In the paper
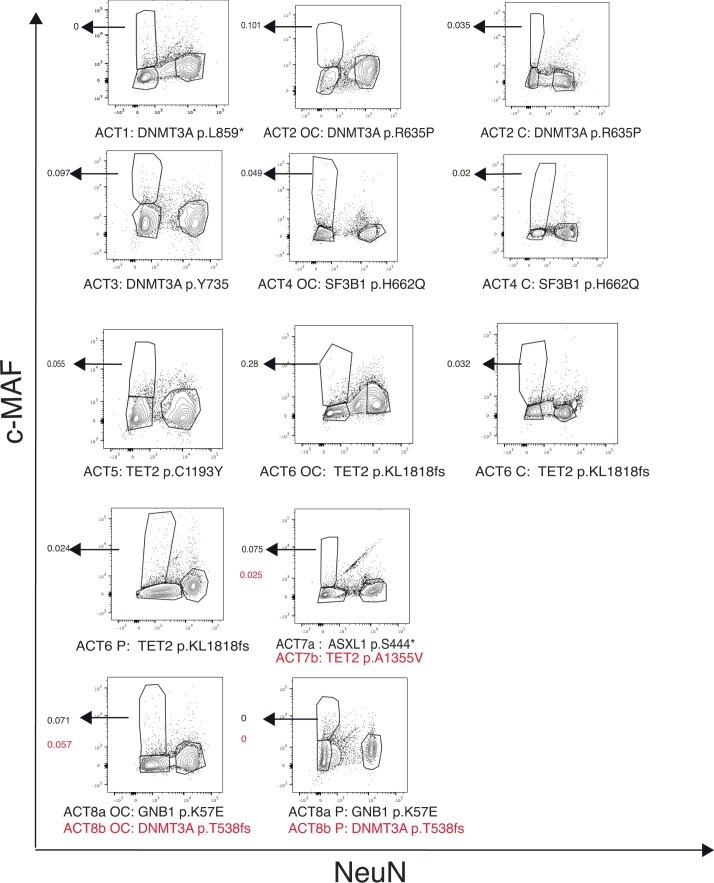
“We observed that the same mutations found in blood were also detected in microglia-enriched fraction of the brain in seven of eight CHIP carriers.”
- Also stated in: § Detection of CHIP variants in the human brain · plain
“The CHIP somatic variants were found in the NeuN− c-MAF+ population in seven out of eight brains, with a VAF that ranged from 0.02 to 0.28 (representing 4% to 56% of NeuN− c-MAF+ nuclei).”
§ Clonal hematopoiesis is associated with protection from Alzheimer’s disease > Abstract
plainn = 7- Asserted: passes — The authors put it forward as true.
- Checkable: passes — It can be checked against evidence.
- Load-bearing: passes — The paper’s conclusions depend on it.
- Based: passes — The paper gives a reason why it holds.
It may state two separate claims as one.
- Also stated in: § Detection of CHIP variants in the human brain · plain
A result the paper reports from its own data — it cites no other source for it, so there is none to check. The quote shows it is in the paper.
In the paper
“Regression models that examined the interaction of CHIP with APOE genotype showed a consistent direction of effect as the stratified models for both AD and ADNC, although the individual interaction terms did not reach statistical significance”
§ Clonal hematopoiesis is associated with protection from Alzheimer’s disease > Results > Stratified associations between CHIP and AD
plaincorrelational- Asserted: passes — The authors put it forward as true.
- Checkable: passes — It can be checked against evidence.
- Load-bearing: unclear — It is unclear whether the paper’s conclusions depend on it.
- Based: passes — The paper gives a reason why it holds.
It may state two separate claims as one.
A result the paper reports from its own data — it cites no other source for it, so there is none to check. The quote shows it is in the paper.
In the paper
“We identified three subclusters, all of which exhibited accessibility profiles consistent with MG, but we did not observe consistent differences in subcluster proportions between CHIP and non-CHIP samples”
§ Clonal hematopoiesis is associated with protection from Alzheimer’s disease > Results > Single-nucleus chromatin accessibility profiling of human brains
plain- Asserted: passes — The authors put it forward as true.
- Checkable: passes — It can be checked against evidence.
- Load-bearing: unclear — It is unclear whether the paper’s conclusions depend on it.
- Based: passes — The paper gives a reason why it holds.
It may state two separate claims as one.
A result the paper reports from its own data — it cites no other source for it, so there is none to check. The quote shows it is in the paper.
In the paper
“Small numbers of cells in our brain samples clustered with circulating immune cells, predominantly T cells, and were found in all unsorted brains (mean = 7.2% of total hematopoietic cells, range 3.7–12.5%).”
§ Clonal hematopoiesis is associated with protection from Alzheimer’s disease > Results > Single-nucleus chromatin accessibility profiling of human brains
plain- Asserted: passes — The authors put it forward as true.
- Checkable: passes — It can be checked against evidence.
- Load-bearing: unclear — It is unclear whether the paper’s conclusions depend on it.
- Based: passes — The paper gives a reason why it holds.
It may state two separate claims as one.
A result the paper reports from its own data — it cites no other source for it, so there is none to check. The quote shows it is in the paper.
In the paper
“APOE genotype was strongly associated with AD dementia risk in those without CHIP age 60 years or older (P = 8.1 × 10⁻⁸ by log-rank test), but not in CHIP carriers of the same age (P = 0.42 by log-rank test)”
§ Clonal hematopoiesis is associated with protection from Alzheimer’s disease > Results > Association between CHIP and AD dementia
boostedcorrelational- Asserted: passes — The authors put it forward as true.
- Checkable: passes — It can be checked against evidence.
- Load-bearing: passes — The paper’s conclusions depend on it.
- Based: passes — The paper gives a reason why it holds.
It may state two separate claims as one.
A result the paper reports from its own data — it cites no other source for it, so there is none to check. The quote shows it is in the paper.
In the paper
“In ADSP participants without dementia, ADNC was lower in CHIP carriers compared to noncarriers with the APOE ε3ε3 genotype or with an APOE ε4 allele, but this effect was seen not in those with APOE ε2ε2 or APOE ε2ε3 genotypes”
§ Clonal hematopoiesis is associated with protection from Alzheimer’s disease > Results > Stratified associations between CHIP and AD
plaincorrelational- Asserted: passes — The authors put it forward as true.
- Checkable: passes — It can be checked against evidence.
- Load-bearing: passes — The paper’s conclusions depend on it.
- Based: passes — The paper gives a reason why it holds.
It may state two separate claims as one.
A result the paper reports from its own data — it cites no other source for it, so there is none to check. The quote shows it is in the paper.
In the paper
“We determined that the percentage of MG ranged from 7.6% to 25% in the sorted samples, representing an 11.5-fold to 34.5-fold enrichment for MG in the occipital cortex and cerebellum”
§ Clonal hematopoiesis is associated with protection from Alzheimer’s disease > Results > Single-nucleus chromatin accessibility profiling of human brains
plain- Asserted: passes — The authors put it forward as true.
- Checkable: passes — It can be checked against evidence.
- Load-bearing: unclear — It is unclear whether the paper’s conclusions depend on it.
- Based: passes — The paper gives a reason why it holds.
It may state two separate claims as one.
A result the paper reports from its own data — it cites no other source for it, so there is none to check. The quote shows it is in the paper.
In the paper
“We found that there was a significant effect in some methods, but not others (IVW, effect = 0.144, P = 0.62; weighted median, effect = 0.666, P = 6.3 × 10⁻⁵; MR-PRESSO, effect = 0.144, P = 0.63; MR-RAPS, effect = 0.173, P = 0.014).”
§ Clonal hematopoiesis is associated with protection from Alzheimer’s disease > Methods > Statistical analysis plan
plaincorrelational- Asserted: passes — The authors put it forward as true.
- Checkable: passes — It can be checked against evidence.
- Load-bearing: passes — The paper’s conclusions depend on it.
- Based: passes — The paper gives a reason why it holds.
It may state two separate claims as one.
A result the paper reports from its own data — it cites no other source for it, so there is none to check. The quote shows it is in the paper.
In the paper
“This is illustrated by the distribution of AD cases and controls amongst APOE ε4 carriers, where AD cases were strongly enriched for younger females and controls were preferentially older males.”
§ Clonal hematopoiesis is associated with protection from Alzheimer’s disease > Methods > Statistical analysis plan
boostedcorrelational- Asserted: passes — The authors put it forward as true.
- Checkable: passes — It can be checked against evidence.
- Load-bearing: passes — The paper’s conclusions depend on it.
- Based: passes — The paper gives a reason why it holds.
It may state two separate claims as one.
In the paper
“MG are believed to have little contribution from marrow-derived cells in adulthood23, so it would be surprising to find the mutations in this compartment.”
§ Clonal hematopoiesis is associated with protection from Alzheimer’s disease > Results > Single-nucleus chromatin accessibility profiling of human brains
What the sources say
- Not checked — no full text of the sourcecites [23] Ginhoux, F. & Jung, S. Monocytes and macrophages: developmental pathways and tissue homeostasis. Nat. Rev. Immunol. 14, 392–404 (2014). source
hedged- Asserted: passes — The authors put it forward as true.
- Checkable: passes — It can be checked against evidence.
- Load-bearing: passes — The paper’s conclusions depend on it.
- Based: passes — The paper gives a reason why it holds.
Probably not a substantial claim.
A conclusion the paper draws from its own results — it cites no other source for it, so there is none to check. The quote shows it is in the paper.
In the paper
“In contrast, CHIP somatic variants were not detected in the NeuN+ c-MAF− neuronal population and were absent or at low levels in the other two populations (Fig. 4c and Extended Data Fig. 3), effectively excluding granulocytes and lymphocytes as the source of the mutations.”
§ Clonal hematopoiesis is associated with protection from Alzheimer’s disease > Results > Detection of CHIP variants in the human brain
plainn = 7- Asserted: passes — The authors put it forward as true.
- Checkable: passes — It can be checked against evidence.
- Load-bearing: passes — The paper’s conclusions depend on it.
- Based: passes — The paper gives a reason why it holds.
It may state two separate claims as one.
A conclusion the paper draws from its own results — it cites no other source for it, so there is none to check. The quote shows it is in the paper.
In the paper
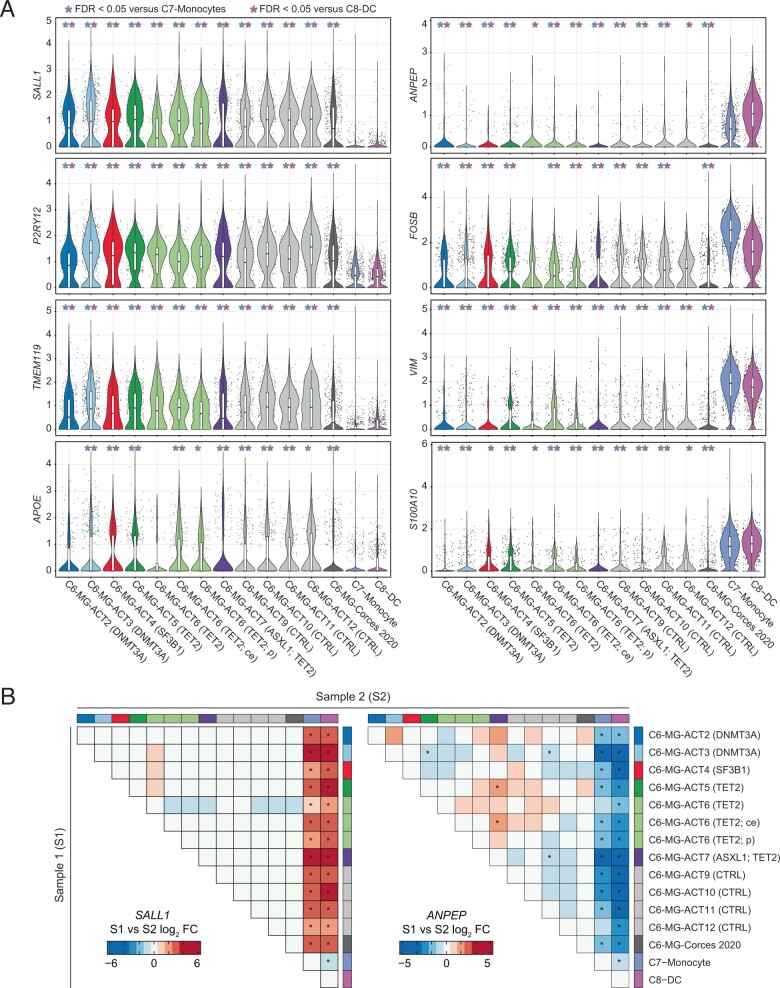
“In total, these results indicate that the cells in C6 exhibit aggregate similarity to MG and are distinct from monocytes (C7) and dendritic cells (C8).”
§ Clonal hematopoiesis is associated with protection from Alzheimer’s disease > Results > Single-nucleus chromatin accessibility profiling of human brains
hedged- Asserted: passes — The authors put it forward as true.
- Checkable: passes — It can be checked against evidence.
- Load-bearing: unclear — It is unclear whether the paper’s conclusions depend on it.
- Based: passes — The paper gives a reason why it holds.
It may state two separate claims as one.
What the paper did — it cites no source for this, so there is none to check. The quote shows it is in the paper.
In the paper
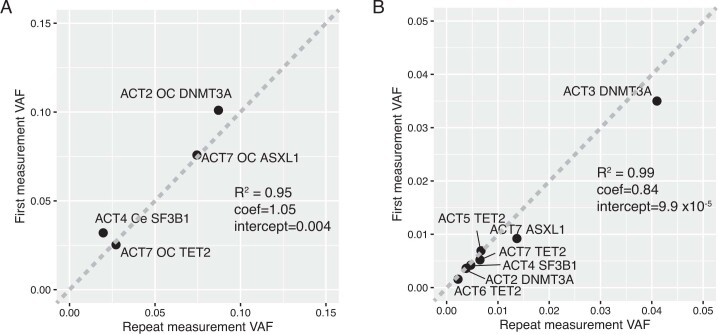
“To determine whether the observed VAF was reproducible across replicates, we repeated the VAF measurement in the NeuN− c-MAF+ gate for four mutations and obtained concordant results”
§ Clonal hematopoiesis is associated with protection from Alzheimer’s disease > Results > Detection of CHIP variants in the human brain
plain- Asserted: passes — The authors put it forward as true.
- Checkable: passes — It can be checked against evidence.
- Load-bearing: fails — The paper’s conclusions may not depend on it.
- Based: passes — The paper gives a reason why it holds.
Probably not a substantial claim. The paper’s conclusions may not depend on it.
What the paper did — it cites no source for this, so there is none to check. The quote shows it is in the paper.
In the paper
“visual examination of a plot of the Martingale residuals for age revealed that the linearity assumption was met.”
§ Clonal hematopoiesis is associated with protection from Alzheimer’s disease > Methods > Statistical analysis plan
plain- Asserted: passes — The authors put it forward as true.
- Checkable: passes — It can be checked against evidence.
- Load-bearing: fails — The paper’s conclusions may not depend on it.
- Based: passes — The paper gives a reason why it holds.
Probably not a substantial claim. The paper’s conclusions may not depend on it.
A conclusion the paper draws from its own results — it cites no other source for it, so there is none to check. The quote shows it is in the paper.
In the paper
“Therefore, while the data presented here are suggestive, we cannot currently conclude that the mechanism of protection from AD seen in CHIP carriers is due to these infiltrating cells.”
§ Clonal hematopoiesis is associated with protection from Alzheimer’s disease > Discussion
hedged- Asserted: passes — The authors put it forward as true.
- Checkable: passes — It can be checked against evidence.
- Load-bearing: passes — The paper’s conclusions depend on it.
- Based: passes — The paper gives a reason why it holds.
Probably not a substantial claim.
What the paper did — it cites no source for this, so there is none to check. The quote shows it is in the paper.
In the paper
“To exclude confounding due to survivorship bias, we performed the analysis using CRR, with death as the competing risk.”
§ Clonal hematopoiesis is associated with protection from Alzheimer’s disease > Methods > Statistical analysis plan
plain- Asserted: passes — The authors put it forward as true.
- Checkable: passes — It can be checked against evidence.
- Load-bearing: passes — The paper’s conclusions depend on it.
- Based: passes — The paper gives a reason why it holds.
Probably not a substantial claim.
In the paper
“As mid-life hypertension has been reported to be associated with an increased risk of AD in observational studies52”
§ Clonal hematopoiesis is associated with protection from Alzheimer’s disease > Methods > Statistical analysis plan
What the sources say
- Not checked — no full text of the sourcecites [52] Reitz, C., Brayne, C. & Mayeux, R. Epidemiology of Alzheimer disease. Nat. Rev. Neurol. 7 137–152 (2011). source
hedgedcorrelational- Asserted: passes — The authors put it forward as true.
- Checkable: passes — It can be checked against evidence.
- Load-bearing: passes — The paper’s conclusions depend on it.
- Based: passes — The paper gives a reason why it holds.
Probably not a substantial claim.
The paper states this without a source or data behind it here, so there is nothing to check it against. The quote shows it is in the paper.
In the paper
“some are thought to be relevant to cancers generally, including solid tumors (TERT, PARP1, ATM, TP53, BCL2L1 and SETBP1)”
§ Clonal hematopoiesis is associated with protection from Alzheimer’s disease > Methods > Statistical analysis plan
hedgedcorrelational- Asserted: passes — The authors put it forward as true.
- Checkable: passes — It can be checked against evidence.
- Load-bearing: passes — The paper’s conclusions depend on it.
- Based: passes — The paper gives a reason why it holds.
Probably not a substantial claim.
What the paper did — it cites no source for this, so there is none to check. The quote shows it is in the paper.
In the paper
“Clearly, our selected germline IVs are independent of sex and other unlinked genetic variants.”
§ Clonal hematopoiesis is associated with protection from Alzheimer’s disease > Methods > Statistical analysis plan
boosted- Asserted: passes — The authors put it forward as true.
- Checkable: passes — It can be checked against evidence.
- Load-bearing: passes — The paper’s conclusions depend on it.
- Based: fails — The paper may give no reason why it holds.
Probably not a substantial claim. The paper may give no reason why it holds. It may state two separate claims as one.
What the paper did — it cites no source for this, so there is none to check. The quote shows it is in the paper.
In the paper
“To control for this possibility, we also included family as a cluster variable in the CRR model for FHS using the R package crrSC”
§ Clonal hematopoiesis is associated with protection from Alzheimer’s disease > Methods > Statistical analysis plan
plaindirect- Asserted: passes — The authors put it forward as true.
- Checkable: passes — It can be checked against evidence.
- Load-bearing: passes — The paper’s conclusions depend on it.
- Based: passes — The paper gives a reason why it holds.
Probably not a substantial claim.
In the paper
“Adjudication for Alzheimer’s phenotypes was done by a committee41, comprising at least two neurologists and a neuropsychologist.”
§ Clonal hematopoiesis is associated with protection from Alzheimer’s disease > Methods > Study population
What the sources say
- Not checked — no full text of the sourcecites [41] Seshadri, S. et al. Plasma homocysteine as a risk factor for dementia and Alzheimer’s disease. N. Engl. J. Med. 346, 476–483 (2002). source
plain- Asserted: passes — The authors put it forward as true.
- Checkable: passes — It can be checked against evidence.
- Load-bearing: fails — The paper’s conclusions may not depend on it.
- Based: passes — The paper gives a reason why it holds.
Probably not a substantial claim. The paper’s conclusions may not depend on it.
A conclusion the paper draws from its own results — it cites no other source for it, so there is none to check. The quote shows it is in the paper.
In the paper
“Given that higher blood pressure is a risk factor for AD, this does not explain the inverse association between CHIP and AD seen in our MR analysis and observational study.”
§ Clonal hematopoiesis is associated with protection from Alzheimer’s disease > Methods > Statistical analysis plan
plain- Asserted: passes — The authors put it forward as true.
- Checkable: passes — It can be checked against evidence.
- Load-bearing: passes — The paper’s conclusions depend on it.
- Based: passes — The paper gives a reason why it holds.
It may state two separate claims as one.
- Rests on an assumption: Higher blood pressure is a risk factor for Alzheimer's disease.
What the paper did — it cites no source for this, so there is none to check. The quote shows it is in the paper.
In the paper
“To confirm the reproducibility of the VAF measurements, DNA from unsorted brain nuclei or sorted Maf+ NeuN− was used for library prep and sequencing in a second replicate.”
§ Clonal hematopoiesis is associated with protection from Alzheimer’s disease > Methods > DNA extraction, amplification and sequencing
plain- Asserted: passes — The authors put it forward as true.
- Checkable: passes — It can be checked against evidence.
- Load-bearing: passes — The paper’s conclusions depend on it.
- Based: passes — The paper gives a reason why it holds.
Probably not a substantial claim.
What the paper did — it cites no source for this, so there is none to check. The quote shows it is in the paper.
In the paper
“visual examination of a plot of the Schoenfeld residuals revealed that the proportional hazards assumption was met for each covariate”
§ Clonal hematopoiesis is associated with protection from Alzheimer’s disease > Methods > Statistical analysis plan
plain- Asserted: passes — The authors put it forward as true.
- Checkable: passes — It can be checked against evidence.
- Load-bearing: fails — The paper’s conclusions may not depend on it.
- Based: passes — The paper gives a reason why it holds.
Probably not a substantial claim. The paper’s conclusions may not depend on it.
A conclusion the paper draws from its own results — it cites no other source for it, so there is none to check. The quote shows it is in the paper.
In the paper
“The observation that the effect sizes were similar with several different driver genes suggests that there could be shared mechanisms leading to protection from AD across several different mutations.”
§ Clonal hematopoiesis is associated with protection from Alzheimer’s disease > Discussion
hedgedconditional- Asserted: passes — The authors put it forward as true.
- Checkable: passes — It can be checked against evidence.
- Load-bearing: fails — The paper’s conclusions may not depend on it.
- Based: passes — The paper gives a reason why it holds.
Probably not a substantial claim. The paper’s conclusions may not depend on it.
A conclusion the paper draws from its own results — it cites no other source for it, so there is none to check. The quote shows it is in the paper.
In the paper
“It is unlikely that tumors of solid organs could directly influence the biology of AD.”
§ Clonal hematopoiesis is associated with protection from Alzheimer’s disease > Methods > Statistical analysis plan
hedged- Asserted: passes — The authors put it forward as true.
- Checkable: passes — It can be checked against evidence.
- Load-bearing: passes — The paper’s conclusions depend on it.
- Based: fails — The paper may give no reason why it holds.
Probably not a substantial claim. The paper may give no reason why it holds.
A conclusion the paper draws from its own results — it cites no other source for it, so there is none to check. The quote shows it is in the paper.
In the paper
“CHIP has moderate heritability relative to other traits”
§ Clonal hematopoiesis is associated with protection from Alzheimer’s disease > Methods > Statistical analysis plan
plain- Asserted: passes — The authors put it forward as true.
- Checkable: passes — It can be checked against evidence.
- Load-bearing: fails — The paper’s conclusions may not depend on it.
- Based: passes — The paper gives a reason why it holds.
Probably not a substantial claim. The paper’s conclusions may not depend on it.
What the paper did — it cites no source for this, so there is none to check. The quote shows it is in the paper.
In the paper
“we had 1,104 AD cases and 1,446 controls who were well matched by age.”
§ Clonal hematopoiesis is associated with protection from Alzheimer’s disease > Methods > Statistical analysis plan
plainn = 1,104- Asserted: passes — The authors put it forward as true.
- Checkable: passes — It can be checked against evidence.
- Load-bearing: fails — The paper’s conclusions may not depend on it.
- Based: passes — The paper gives a reason why it holds.
Probably not a substantial claim. The paper’s conclusions may not depend on it.
What the paper did — it cites no source for this, so there is none to check. The quote shows it is in the paper.
In the paper
“although the estimated fraction of mutant cells is likely more reliable from the unsorted brain.”
§ Clonal hematopoiesis is associated with protection from Alzheimer’s disease > Discussion
hedged- Asserted: passes — The authors put it forward as true.
- Checkable: passes — It can be checked against evidence.
- Load-bearing: fails — The paper’s conclusions may not depend on it.
- Based: fails — The paper may give no reason why it holds.
Probably not a substantial claim. The paper’s conclusions may not depend on it. The paper may give no reason why it holds.
What the paper did — it cites no source for this, so there is none to check. The quote shows it is in the paper.
In the paper
“To rule out sequencing errors or other technical artifacts that could be artificially inflating the mutant allele fraction, we also performed amplicon sequencing using the same primers on a negative control brain sample from a donor known to not be a CHIP carrier.”
§ Clonal hematopoiesis is associated with protection from Alzheimer’s disease > Methods > DNA extraction, amplification and sequencing
plainSingle case- Asserted: passes — The authors put it forward as true.
- Checkable: passes — It can be checked against evidence.
- Load-bearing: passes — The paper’s conclusions depend on it.
- Based: passes — The paper gives a reason why it holds.
Probably not a substantial claim.
What the paper did — it cites no source for this, so there is none to check. The quote shows it is in the paper.
In the paper
“Consent for brain donation was obtained from each donor and the study was approved by the University of Washington Institutional Review Board and by the Kaiser Permanente Washington Institutional Review Board.”
§ Clonal hematopoiesis is associated with protection from Alzheimer’s disease > Methods > Nuclei isolation from human postmortem brain tissue
plain- Asserted: passes — The authors put it forward as true.
- Checkable: passes — It can be checked against evidence.
- Load-bearing: fails — The paper’s conclusions may not depend on it.
- Based: passes — The paper gives a reason why it holds.
Probably not a substantial claim. The paper’s conclusions may not depend on it. It may state two separate claims as one.
What the paper did — it cites no source for this, so there is none to check. The quote shows it is in the paper.
In the paper
“After clustering, reproducible peaks were determined for each cluster individually to ensure that cell type-specific peaks were retained.”
§ Clonal hematopoiesis is associated with protection from Alzheimer’s disease > Methods > Single-nucleus ATAC-sequencing
plain- Asserted: passes — The authors put it forward as true.
- Checkable: passes — It can be checked against evidence.
- Load-bearing: fails — The paper’s conclusions may not depend on it.
- Based: passes — The paper gives a reason why it holds.
Probably not a substantial claim. The paper’s conclusions may not depend on it.
What the paper did — it cites no source for this, so there is none to check. The quote shows it is in the paper.
In the paper
“These simulations indicated that the confidence intervals for the estimate of mutant MG are not overly broad based on expected input parameters.”
hedged- Asserted: passes — The authors put it forward as true.
- Checkable: passes — It can be checked against evidence.
- Load-bearing: fails — The paper’s conclusions may not depend on it.
- Based: passes — The paper gives a reason why it holds.
Probably not a substantial claim. The paper’s conclusions may not depend on it.
What the paper did — it cites no source for this, so there is none to check. The quote shows it is in the paper.
In the paper
“Doublets were removed in two steps. First, for each sample, doublets were predicted and removed based on similarity to computationally simulated doublets. Second, after initial clustering, we identified a cluster of putative doublets that was weakly enriched for markers of multiple cell types. This cluster was removed and the remaining nuclei were reprocessed and reclustered.”
§ Clonal hematopoiesis is associated with protection from Alzheimer’s disease > Methods > Single-nucleus ATAC-sequencing
hedged- Asserted: passes — The authors put it forward as true.
- Checkable: passes — It can be checked against evidence.
- Load-bearing: fails — The paper’s conclusions may not depend on it.
- Based: passes — The paper gives a reason why it holds.
Probably not a substantial claim. The paper’s conclusions may not depend on it. It may state two separate claims as one.
What the paper did — it cites no source for this, so there is none to check. The quote shows it is in the paper.
In the paper
“Although Harmony batch correction is implemented and part of the standard workflow in ArchR, we did not use any batch correction to ensure that any biological differences between the samples would be preserved.”
§ Clonal hematopoiesis is associated with protection from Alzheimer’s disease > Methods > Single-nucleus ATAC-sequencing
plain- Asserted: passes — The authors put it forward as true.
- Checkable: passes — It can be checked against evidence.
- Load-bearing: fails — The paper’s conclusions may not depend on it.
- Based: passes — The paper gives a reason why it holds.
Probably not a substantial claim. The paper’s conclusions may not depend on it. It may state two separate claims as one.
What the paper did — it cites no source for this, so there is none to check. The quote shows it is in the paper.
In the paper
“The eight CHIP carriers represented all donors known to have CHIP and with autopsy specimens available. The four without CHIP represented a random selection of the study cohort.”
§ Clonal hematopoiesis is associated with protection from Alzheimer’s disease > Methods > Nuclei isolation from human postmortem brain tissue
plainn = 8- Asserted: passes — The authors put it forward as true.
- Checkable: passes — It can be checked against evidence.
- Load-bearing: passes — The paper’s conclusions depend on it.
- Based: passes — The paper gives a reason why it holds.
Probably not a substantial claim. It may state two separate claims as one.
The authors state this as an assumption.
All nonmicroglial hematopoietic cells in the brain samples were mutant.
“We conservatively assumed that all nonmicroglial hematopoietic cells were mutant and subtracted the number of these cells from the total mutant cell count”
The authors state this as an assumption.
The instrumental variables for CHIP are relevant, i.e., associated with CHIP.
“The assumptions for the validity of MR analyses are relevance, independence and exclusion restriction of the independent variables (IVs)48.”
The authors state this as an assumption.
The instrumental variables for CHIP are independent of unmeasured confounders.
“Independence: This assumption presupposes that the CHIP IVs are not associated with unmeasured confounders.”
The authors state this as an assumption.
The instrumental variables affect AD only through CHIP (exclusion restriction).
“The assumptions for the validity of MR analyses are relevance, independence and exclusion restriction of the independent variables (IVs)48.”
The authors state this as an assumption.
All nonmicroglial hematopoietic cells were mutant.
“We assumed that all nonmicroglial hematopoietic cells were mutant”
The authors state this as an assumption.
Only hematopoietic cells can carry the CHIP variant.
“We assume that only hematopoietic cells can carry the CHIP variant.”
The paper relies on this without support.
Higher blood pressure is a risk factor for Alzheimer's disease.
“Given that higher blood pressure is a risk factor for AD”
Claims other papers make about this one
Each is checked against this paper’s own text: does it say what the citing paper says it does?
The cited source doesn’t support the claim as written.
In the citing paper
“Stratification by APOE genotype indicated that the protective association was strongest among APOE ε3/ε3 individuals, whereas no significant effect was detected in ε2 or ε4 carriers [10].”
From Clonal Hematopoiesis of Indeterminate Potential as an Emerging Interdisciplinary Risk Factor in Alzheimer’s Disease: Current Evidence and Future Directions (2026) · cites this paper as [10]
Checked by a reasoning model — may be wrong.
Experimental — accuracy not yet measuredThe source backs part of the claim, not all of it — or backs it for a different population, condition or comparison.
In the citing paper
“Two recent studies investigating CHIP variants primarily using whole-exome sequencing (WES) data from blood cells found no effect24 or a protective effect25 on AD risk.”
From Somatic cancer variants enriched in Alzheimer’s disease microglia-like cells drive inflammatory and proliferative states (2026) · cites this paper as [25]
Experimental — accuracy not yet measuredThe source backs part of the claim, not all of it — or backs it for a different population, condition or comparison.
In the citing paper
“However, there is conflicting evidence regarding the impact of CH on Alzheimer’s disease (AD).5,10”
From TET2-mutant myeloid cells mitigate Alzheimer’s disease progression via CNS infiltration and enhanced phagocytosis in mice (2025) · cites this paper as [5]
Experimental — accuracy not yet measuredThe source backs part of the claim, not all of it — or backs it for a different population, condition or comparison.
In the citing paper
“during neurodegeneration, the integrity of the blood–brain barrier declines. This may facilitate debated levels of peripheral monocytes to infiltrate the central nervous system and differentiate into microglia-like cells.”
From Clonal Hematopoiesis of Indeterminate Potential as an Emerging Interdisciplinary Risk Factor in Alzheimer’s Disease: Current Evidence and Future Directions (2026) · cites this paper as [10]
Experimental — accuracy not yet measuredThe source backs part of the claim, not all of it — or backs it for a different population, condition or comparison.
In the citing paper
“any somatic mutations present in the peripheral hematopoietic system could theoretically be imported into the brain’s immune environment, posing a mechanistic link between systemic aging and local neuroinflammation [10,24,25,26].”
From Clonal Hematopoiesis of Indeterminate Potential as an Emerging Interdisciplinary Risk Factor in Alzheimer’s Disease: Current Evidence and Future Directions (2026) · cites this paper as [10]
Experimental — accuracy not yet measured
The source backs part of the claim, not all of it — or backs it for a different population, condition or comparison.
In the citing paper
“emerging data suggest mutation-specific effects that may uniquely modulate neurodegenerative pathogenesis [10,14].”
From Clonal Hematopoiesis of Indeterminate Potential as an Emerging Interdisciplinary Risk Factor in Alzheimer’s Disease: Current Evidence and Future Directions (2026) · cites this paper as [10]
Experimental — accuracy not yet measuredThe source backs part of the claim, not all of it — or backs it for a different population, condition or comparison.
In the citing paper
“Accumulating evidence indicates that the impact of clonal hematopoiesis on AD risk is strongly dependent on the identity of the driver gene and host genetic context [10,13].”
From Clonal Hematopoiesis of Indeterminate Potential as an Emerging Interdisciplinary Risk Factor in Alzheimer’s Disease: Current Evidence and Future Directions (2026) · cites this paper as [10]
Experimental — accuracy not yet measuredThe source backs part of the claim, not all of it — or backs it for a different population, condition or comparison.
In the citing paper
“While TET2 mutations have been most consistently associated with enhanced amyloid clearance and attenuated neuropathology in experimental systems [10,14]”
From Clonal Hematopoiesis of Indeterminate Potential as an Emerging Interdisciplinary Risk Factor in Alzheimer’s Disease: Current Evidence and Future Directions (2026) · cites this paper as [10]
Experimental — accuracy not yet measuredThe source backs part of the claim, not all of it — or backs it for a different population, condition or comparison.
In the citing paper
“Notably, three independent analytical frameworks have now been applied to the same ADSP cohort, yielding disparate results.”
From Clonal Hematopoiesis of Indeterminate Potential as an Emerging Interdisciplinary Risk Factor in Alzheimer’s Disease: Current Evidence and Future Directions (2026) · cites this paper as [10]
Experimental — accuracy not yet measuredThe source backs part of the claim, not all of it — or backs it for a different population, condition or comparison.
In the citing paper
“Notably, both studies relied on the ADSP as a validation cohort yet arrived at strikingly opposed conclusions, underscoring the sensitivity of inferred CHIP effects to methodological heterogeneity.”
From Clonal Hematopoiesis of Indeterminate Potential as an Emerging Interdisciplinary Risk Factor in Alzheimer’s Disease: Current Evidence and Future Directions (2026) · cites this paper as [10]
Experimental — accuracy not yet measuredThe source backs part of the claim, not all of it — or backs it for a different population, condition or comparison.
In the citing paper
“Gene-specific effects, clonal burden, host genetic background, and neurovascular integrity all shape whether CHIP-derived immune cells exert protective or pathogenic influences in the aging brain [10,11,13,19,33,34].”
From Clonal Hematopoiesis of Indeterminate Potential as an Emerging Interdisciplinary Risk Factor in Alzheimer’s Disease: Current Evidence and Future Directions (2026) · cites this paper as [10]
Experimental — accuracy not yet measuredThe source backs part of the claim, not all of it — or backs it for a different population, condition or comparison.
In the citing paper
“This suggests that inferred CHIP-AD associations are strongly shaped by methodological choices, including CHIP definition (VAF 2% vs. 8%) and cohort stratification based on APOE genotype.”
From Clonal Hematopoiesis of Indeterminate Potential as an Emerging Interdisciplinary Risk Factor in Alzheimer’s Disease: Current Evidence and Future Directions (2026) · cites this paper as [10]
Experimental — accuracy not yet measuredThe source backs part of the claim, not all of it — or backs it for a different population, condition or comparison.
In the citing paper
“These mechanistic insights provide a plausible biological framework for the heterogeneous and sometimes contradictory epidemiological findings observed across studies, particularly those derived from shared cohorts such as the ADSP [10,13,34].”
From Clonal Hematopoiesis of Indeterminate Potential as an Emerging Interdisciplinary Risk Factor in Alzheimer’s Disease: Current Evidence and Future Directions (2026) · cites this paper as [10]
Experimental — accuracy not yet measuredThe source backs part of the claim, not all of it — or backs it for a different population, condition or comparison.
In the citing paper
“DNMT3A-mutant CHIP has shown protective associations with cognitive outcomes in some population-based and clinical cohorts as well as specific subgroups in these studies, particularly for larger clones and in select disease contexts [10,11,19,33].”
From Clonal Hematopoiesis of Indeterminate Potential as an Emerging Interdisciplinary Risk Factor in Alzheimer’s Disease: Current Evidence and Future Directions (2026) · cites this paper as [10]
Experimental — accuracy not yet measuredThe source backs part of the claim, not all of it — or backs it for a different population, condition or comparison.
In the citing paper
“Multiple epidemiological studies have identified the Apolipoprotein E genotype, particularly APOE ε3/ε3 alleles, as a key modifier of CHIP-associated AD risk [10,13].”
From Clonal Hematopoiesis of Indeterminate Potential as an Emerging Interdisciplinary Risk Factor in Alzheimer’s Disease: Current Evidence and Future Directions (2026) · cites this paper as [10]
Experimental — accuracy not yet measuredThe source backs part of the claim, not all of it — or backs it for a different population, condition or comparison.
In the citing paper
“In contrast to earlier assumptions of restricted infiltration, it has been demonstrated that CHIP-mutated clones not only populate the brain’s immune compartment but can exhibit a higher variant allele fraction (VAF) within the isolated microglial pool than in the peripheral blood [10].”
From Clonal Hematopoiesis of Indeterminate Potential as an Emerging Interdisciplinary Risk Factor in Alzheimer’s Disease: Current Evidence and Future Directions (2026) · cites this paper as [10]
Experimental — accuracy not yet measuredThe source backs part of the claim, not all of it — or backs it for a different population, condition or comparison.
In the citing paper
“The net effect of CHIP on Alzheimer’s disease risk is, therefore, determined by the balance between protective neuroimmune modulation and deleterious vascular and inflammatory influences, shaped by mutation type, clonal burden, disease stage, and host genetic background, including the APOE genotype [10,13].”
From Clonal Hematopoiesis of Indeterminate Potential as an Emerging Interdisciplinary Risk Factor in Alzheimer’s Disease: Current Evidence and Future Directions (2026) · cites this paper as [10]
Experimental — accuracy not yet measuredThe source backs part of the claim, not all of it — or backs it for a different population, condition or comparison.
In the citing paper
“While recent evidence demonstrates that CHIP-associated mutations can be detected in microglia resident in the brain and correlate with peripheral clonal burden, this phenomenon appears to fluctuate and is context-dependent [10,34].”
From Clonal Hematopoiesis of Indeterminate Potential as an Emerging Interdisciplinary Risk Factor in Alzheimer’s Disease: Current Evidence and Future Directions (2026) · cites this paper as [10]
Experimental — accuracy not yet measuredThe source backs part of the claim, not all of it — or backs it for a different population, condition or comparison.
In the citing paper
“Several studies report that the CHIP-associated risk of AD differs substantially by APOE genotype, with effects appearing most pronounced in individuals with APOE ε3/ε3 [10,13].”
From Clonal Hematopoiesis of Indeterminate Potential as an Emerging Interdisciplinary Risk Factor in Alzheimer’s Disease: Current Evidence and Future Directions (2026) · cites this paper as [10]
Experimental — accuracy not yet measuredThe cited source says what the claim attributes to it.
In the citing paper
“We further confirmed the enrichment of somatic variants in AD when considering only CHIP variants previously identified from blood whole-genome sequencing datasets25,37 (Figure S3A–C).”
From Somatic cancer variants enriched in Alzheimer’s disease microglia-like cells drive inflammatory and proliferative states (2026) · cites this paper as [25]
The cited source says what the claim attributes to it.
In the citing paper
“A few small studies of primary brain samples have hinted that cancer-associated variants and clonal overgrowth might occur in brain microglia, which proliferate throughout life25,27,28.”
From Somatic cancer variants enriched in Alzheimer’s disease microglia-like cells drive inflammatory and proliferative states (2026) · cites this paper as [25]
The cited source says what the claim attributes to it.
In the citing paper
“Peripheral immune cells may also replace microglial populations,5,23,30–32 though this is controversial.”
From TET2-mutant myeloid cells mitigate Alzheimer’s disease progression via CNS infiltration and enhanced phagocytosis in mice (2025) · cites this paper as [5]
The cited source says what the claim attributes to it.
In the citing paper
“evidence for protective effects stems from large-scale population-based analyses, encompassing cohorts ranging from approximately 5000 to over 500,000 individuals, suggest that CHIP carriers may exhibit a significantly reduced incidence of clinically diagnosed AD [10,11].”
From Clonal Hematopoiesis of Indeterminate Potential as an Emerging Interdisciplinary Risk Factor in Alzheimer’s Disease: Current Evidence and Future Directions (2026) · cites this paper as [10]
The cited source says what the claim attributes to it.
In the citing paper
“the authors demonstrate that CHIP carriers exhibit a reduced risk of AD dementia compared with non-carriers, independent of age, sex, and APOE genotype [10].”
From Clonal Hematopoiesis of Indeterminate Potential as an Emerging Interdisciplinary Risk Factor in Alzheimer’s Disease: Current Evidence and Future Directions (2026) · cites this paper as [10]
The cited source says what the claim attributes to it.
In the citing paper
“Meta-analysis across cohorts revealed a 36% reduction in AD risk among CHIP carriers [10].”
From Clonal Hematopoiesis of Indeterminate Potential as an Emerging Interdisciplinary Risk Factor in Alzheimer’s Disease: Current Evidence and Future Directions (2026) · cites this paper as [10]
The cited source says what the claim attributes to it.
In the citing paper
“CHIP carriers displayed lower Consortium to Establish a Registry for Alzheimer’s Disease (CERAD) scores, representing a reduced burden of neuritic amyloid plaque and reduced Braak staging. These factors indicate less advanced regional progression and severity of tau pathology [10].”
From Clonal Hematopoiesis of Indeterminate Potential as an Emerging Interdisciplinary Risk Factor in Alzheimer’s Disease: Current Evidence and Future Directions (2026) · cites this paper as [10]
The cited source says what the claim attributes to it.
In the citing paper
“This presence confirms that CHIP-derived myeloid cells can directly integrate into the central nervous system and may participate actively in neuroimmune processes relevant to AD pathogenesis [10,37].”
From Clonal Hematopoiesis of Indeterminate Potential as an Emerging Interdisciplinary Risk Factor in Alzheimer’s Disease: Current Evidence and Future Directions (2026) · cites this paper as [10]
The cited source says what the claim attributes to it.
In the citing paper
“Protection from AD was primarily driven by larger clones (>8%), with weaker effects observed at lower VAF thresholds (>2%) [10].”
From Clonal Hematopoiesis of Indeterminate Potential as an Emerging Interdisciplinary Risk Factor in Alzheimer’s Disease: Current Evidence and Future Directions (2026) · cites this paper as [10]
The cited source says what the claim attributes to it.
In the citing paper
“protection was observed across multiple CHIP-associated genes, suggesting a general effect of CH rather than a strictly gene-specific association [10].”
From Clonal Hematopoiesis of Indeterminate Potential as an Emerging Interdisciplinary Risk Factor in Alzheimer’s Disease: Current Evidence and Future Directions (2026) · cites this paper as [10]
The cited source says what the claim attributes to it.
In the citing paper
“These differences likely stem in part from divergent sampling strategies and inherent selection bias in defining and selecting CHIP-positive individuals, including the stringent APOE-stratified sampling strategy employed by Bouzid et al.”
From Clonal Hematopoiesis of Indeterminate Potential as an Emerging Interdisciplinary Risk Factor in Alzheimer’s Disease: Current Evidence and Future Directions (2026) · cites this paper as [10]
The cited source says what the claim attributes to it.
In the citing paper
“Post-mortem analyses by Bouzid et al. demonstrated that a subset of microglia from CHIP carriers harbored identical somatic mutations compared to those observed in peripheral blood, with mutation frequencies correlating with peripheral clonal burden [10].”
From Clonal Hematopoiesis of Indeterminate Potential as an Emerging Interdisciplinary Risk Factor in Alzheimer’s Disease: Current Evidence and Future Directions (2026) · cites this paper as [10]
The cited source says what the claim attributes to it.
In the citing paper
“While large CHIP clones in the ADSP cohort have been associated with a reduced AD risk and attenuated neuropathology [10], smaller clones, mosaic chromosomal alterations [34], and specific genetic contexts, most notably APOE stratification, may have increased susceptibility [13].”
From Clonal Hematopoiesis of Indeterminate Potential as an Emerging Interdisciplinary Risk Factor in Alzheimer’s Disease: Current Evidence and Future Directions (2026) · cites this paper as [10]
The cited source says what the claim attributes to it.
In the citing paper
“However, several studies have demonstrated that clonal burden is a critical determinant of phenotypic effect.”
From Clonal Hematopoiesis of Indeterminate Potential as an Emerging Interdisciplinary Risk Factor in Alzheimer’s Disease: Current Evidence and Future Directions (2026) · cites this paper as [10]
The cited source says what the claim attributes to it.
In the citing paper
“In particular, protective associations with AD and attenuated neuropathology were observed predominantly in individuals carrying large CHIP clones, typically defined by VAF thresholds of ≥8%; however, smaller clones showed weaker, null, or inconsistent associations [10,33].”
From Clonal Hematopoiesis of Indeterminate Potential as an Emerging Interdisciplinary Risk Factor in Alzheimer’s Disease: Current Evidence and Future Directions (2026) · cites this paper as [10]
The cited source says what the claim attributes to it.
In the citing paper
“suggesting a selective fitness advantage or preferential recruitment of mutated myeloid cells to the central nervous system [10].”
From Clonal Hematopoiesis of Indeterminate Potential as an Emerging Interdisciplinary Risk Factor in Alzheimer’s Disease: Current Evidence and Future Directions (2026) · cites this paper as [10]
The cited source says what the claim attributes to it.
In the citing paper
“Specifically, single-nucleus sequencing has revealed that mutated microglia-like cells can constitute a substantial proportion of the brain’s immune niche”
From Clonal Hematopoiesis of Indeterminate Potential as an Emerging Interdisciplinary Risk Factor in Alzheimer’s Disease: Current Evidence and Future Directions (2026) · cites this paper as [10]
Self-check
Percentages, sums and reported differences re-computed from the paper’s own numbers.
Each contradiction between two passages listed here was confirmed by an independent check.
Rated major: it would touch a result — a value a result rests on, reported and recomputed p-values on opposite sides of the significance level, two passages that conflict with no sign which is right, or a cited work retracted before this paper was published.
In the paper
§ Clonal hematopoiesis is associated with protection from Alzheimer’s disease > Methods > Study population
“After exclusion of participants with coronary heart disease or stroke, or with missing information on age at blood draw or AD diagnosis, a total of 743 persons remained for this analysis.”
§ Clonal hematopoiesis is associated with protection from Alzheimer’s disease > Methods > Statistical analysis plan
“After excluding those without information on AD diagnosis, there were 2,437 persons in FHS and 620 persons in CHS.”
Rated minor: it would not touch a result — a value no result rests on, a p-value that stays on the same side of the significance level, or a conflict that is clerical, resolved elsewhere in the paper, or outside its own findings.
In the paper
§ Clonal hematopoiesis is associated with protection from Alzheimer’s disease > Results > Detection of CHIP variants in the human brain
“We first obtained brain DNA-derived WES data from 1,776 persons in ADSP”
§ Clonal hematopoiesis is associated with protection from Alzheimer’s disease > Results > Detection of CHIP variants in the human brain
“a, Barplot of putative CHIP mutations identified from whole exome sequencing of brain DNA from 1,775 persons in ADSP.”
Rated minor: it would not touch a result — a value no result rests on, a p-value that stays on the same side of the significance level, or a conflict that is clerical, resolved elsewhere in the paper, or outside its own findings.
In the paper
§ Clonal hematopoiesis is associated with protection from Alzheimer’s disease > Methods > Single-nucleus ATAC-sequencing
“To evaluate the fraction of mutated MG (as shown in Fig. 5d and Supplementary Table 16)”
§ Clonal hematopoiesis is associated with protection from Alzheimer’s disease > Results > Single-nucleus chromatin accessibility profiling of human brains
“e, Calculation of the proportion of MG bearing a CHIP mutation in each sample.”
Rated minor: it would not touch a result — a value no result rests on, a p-value that stays on the same side of the significance level, or a conflict that is clerical, resolved elsewhere in the paper, or outside its own findings.
In the paper
§ Clonal hematopoiesis is associated with protection from Alzheimer’s disease > Methods > Statistical analysis plan
“424 people with ε3ε4 genotype”
§ Clonal hematopoiesis is associated with protection from Alzheimer’s disease > Methods > Statistical analysis plan
“162 people with ε3ε4 genotype”
Citations
Cites
Bowden, J., Davey Smith, G., Haycock, P. C., & Burgess, S. (2016) · Genetic Epidemiology · doi:10.1002/gepi.21965 · Cited by 8,922
Verbanck, M., Chen, C.-Y., Neale, B., & Do, R. (2018) · Nature Genetics · doi:10.1038/s41588-018-0099-7 · Cited by 8,591
Neuroinflammation in Alzheimer's disease
Heneka, M. T., Carson, M. J., Khoury, J. E., Landreth, G. E., Brosseron, F., Feinstein, D. L., Jacobs, A. H., Wyss-Coray, T., Vitorica, J., Ransohoff, R. M., et al. (2015) · The Lancet Neurology · doi:10.1016/s1474-4422(15)70016-5 · Cited by 6,226
Mendelian Randomization Analysis With Multiple Genetic Variants Using Summarized Data
Burgess, S., Butterworth, A., & Thompson, S. G. (2013) · Genetic Epidemiology · doi:10.1002/gepi.21758 · Cited by 6,050
Age-related clonal hematopoiesis associated with adverse outcomes
Jaiswal, S., Fontanillas, P., Flannick, J., Manning, A., Grauman, P. V., Mar, B. G., Lindsley, R. C., Mermel, C. H., Burtt, N., Chavez, A., et al. (2014) · New England Journal of Medicine · doi:10.1056/nejmoa1408617 · Cited by 4,841 · cited 2×
“Clone size, which is approximated by the variant allele fraction (VAF), has previously been shown to be an important predictor of risk for blood cancer (4, 15) and cardiovascular outcomes (6, 7).”
Self-citationSkrivankova, V. W., Richmond, R. C., Woolf, B. A. R., Yarmolinsky, J., Davies, N. M., Swanson, S. A., VanderWeele, T. J., Higgins, J. P. T., Timpson, N. J., Dimou, N., et al. (2021) · JAMA · doi:10.1001/jama.2021.18236 · Cited by 3,994
Clonal hematopoiesis and blood-cancer risk inferred from blood DNA sequence
Genovese, G., Kähler, A. K., Handsaker, R. E., Lindberg, J., Rose, S. A., Bakhoum, S. F., Chambert, K., Mick, E., Neale, B. M., Fromer, M., et al. (2014) · New England Journal of Medicine · doi:10.1056/nejmoa1409405 · Cited by 3,531
Plasma Homocysteine as a Risk Factor for Dementia and Alzheimer's Disease
Seshadri, S., Beiser, A., Selhub, J., Jacques, P. F., Rosenberg, I. H., D'Agostino, R. B., Wilson, P. W. F., & Wolf, P. A. (2002) · New England Journal of Medicine · doi:10.1056/nejmoa011613 · Cited by 3,237
Self-citationBraak, H., Alafuzoff, I., Arzberger, T., Kretzschmar, H., & Del Tredici, K. (2006) · Acta Neuropathologica · doi:10.1007/s00401-006-0127-z · Cited by 3,172
Hyman, B. T., Phelps, C. H., Beach, T. G., Bigio, E. H., Cairns, N. J., Carrillo, M. C., Dickson, D. W., Duyckaerts, C., Frosch, M. P., Masliah, E., et al. (2012) · Alzheimer's & Dementia · doi:10.1016/j.jalz.2011.10.007 · Cited by 3,092
Self-citationAlzheimer Disease Genetics Consortium (ADGC), Kunkle, B. W., The European Alzheimer’s Disease Initiative (EADI), Cohorts for Heart and Aging Research in Genomic Epidemiology Consortium (CHARGE), Genetic and Environmental Risk in AD/Defining Genetic, P. A. E. R. F. A. D. C. (., Grenier-Boley, B., Sims, R., Bis, J. C., Damotte, V., Naj, A. C., et al. (2019) · Nature Genetics · doi:10.1038/s41588-019-0358-2 · Cited by 2,946
Self-citationClonal hematopoiesis and risk of atherosclerotic cardiovascular disease
Jaiswal, S., Natarajan, P., Silver, A. J., Gibson, C. J., Bick, A. G., Shvartz, E., McConkey, M., Gupta, N., Gabriel, S., Ardissino, D., et al. (2017) · New England Journal of Medicine · doi:10.1056/nejmoa1701719 · Cited by 2,683 · cited 4×
“Clone size, which is approximated by the variant allele fraction (VAF), has previously been shown to be an important predictor of risk for blood cancer (4, 15) and cardiovascular outcomes (6, 7).”
InfluentialSelf-citationSequencing of 53,831 diverse genomes from the NHLBI TOPMed Program
Taliun, D., Harris, D. N., Kessler, M. D., Carlson, J., Szpiech, Z. A., Torres, R., Taliun, S. A. G., Corvelo, A., Gogarten, S. M., Kang, H. M., et al. (2021) · Nature · doi:10.1038/s41586-021-03205-y · Cited by 2,213
Self-citationAge-related mutations associated with clonal hematopoietic expansion and malignancies
Xie, M., Lu, C., Wang, J., McLellan, M. D., Johnson, K. J., Wendl, M. C., McMichael, J. F., Schmidt, H. K., Yellapantula, V., Miller, C. A., et al. (2014) · Nature Medicine · doi:10.1038/nm.3733 · Cited by 1,874
Monocytes and macrophages: developmental pathways and tissue homeostasis
Ginhoux, F., & Jung, S. (2014) · Nature Reviews Immunology · doi:10.1038/nri3671 · Cited by 1,840
Epidemiology of Alzheimer disease
Reitz, C., Brayne, C., & Mayeux, R. (2011) · Nature Reviews Neurology · doi:10.1038/nrneurol.2011.2 · Cited by 1,675
Clonal hematopoiesis associated with TET2 deficiency accelerates atherosclerosis development in mice
Fuster, J. J., MacLauchlan, S., Zuriaga, M. A., Polackal, M. N., Ostriker, A. C., Chakraborty, R., Wu, C.-L., Sano, S., Muralidharan, S., Rius, C., et al. (2017) · Science · doi:10.1126/science.aag1381 · Cited by 1,536
Apolipoprotein E and Alzheimer disease: pathobiology and targeting strategies
Yamazaki, Y., Zhao, N., Caulfield, T. R., Liu, C.-C., & Bu, G. (2019) · Nature Reviews Neurology · doi:10.1038/s41582-019-0228-7 · Cited by 1,425
ArchR is a scalable software package for integrative single-cell chromatin accessibility analysis
Granja, J. M., Corces, M. R., Pierce, S. E., Bagdatli, S. T., Choudhry, H., Chang, H. Y., & Greenleaf, W. J. (2021) · Nature Genetics · doi:10.1038/s41588-021-00790-6 · Cited by 1,392
Program, T. M. V., Evangelou, E., Warren, H. R., Mosen-Ansorena, D., Mifsud, B., Pazoki, R., Gao, H., Ntritsos, G., Dimou, N., Cabrera, C. P., et al. (2018) · Nature Genetics · doi:10.1038/s41588-018-0205-x · Cited by 1,381
Self-citationSimard, A. R., Soulet, D., Gowing, G., Julien, J.-P., & Rivest, S. (2006) · Neuron · doi:10.1016/j.neuron.2006.01.022 · Cited by 1,265
Clonal hematopoiesis in human aging and disease
Jaiswal, S., & Ebert, B. L. (2019) · Science · doi:10.1126/science.aan4673 · Cited by 1,156 · cited 1×
“as DNMT3A, TET2, and ASXL1, and can be detected by sequencing of DNA from peripheral blood or bone marrow cells (2).”
Self-citationAPOE and Alzheimer’s disease: Advances in genetics, pathophysiology, and therapeutic approaches
Serrano-Pozo, A., Das, S., & Hyman, B. T. (2021) · The Lancet Neurology · doi:10.1016/s1474-4422(20)30412-9 · Cited by 1,037
Satpathy, A. T., Granja, J. M., Yost, K. E., Qi, Y., Meschi, F., McDermott, G. P., Olsen, B. N., Mumbach, M. R., Pierce, S. E., Corces, M. R., et al. (2019) · Nature Biotechnology · doi:10.1038/s41587-019-0206-z · Cited by 980
Self-citationThe framingham offspring study. Design and preliminary data
Feinleib, M., Kannel, W. B., Garrison, R. J., McNamara, P. M., & Castelli, W. P. (1975) · Preventive Medicine · doi:10.1016/0091-7435(75)90037-7 · Cited by 926
El Khoury, J., Toft, M., Hickman, S. E., Means, T. K., Terada, K., Geula, C., & Luster, A. D. (2007) · Nature Medicine · doi:10.1038/nm1555 · Cited by 915
Origin and differentiation of microglia
Ginhoux, F., Lim, S., Hoeffel, G., Low, D., & Huber, T. (2013) · Frontiers in Cellular Neuroscience · doi:10.3389/fncel.2013.00045 · Cited by 905 · cited 1×
“contribution from HSC-derived cells in adulthood (22).”
Splansky, G. L., Corey, D., Yang, Q., Atwood, L. D., Cupples, L. A., Benjamin, E. J., D'Agostino, R. B., Fox, C. S., Larson, M. G., Murabito, J. M., et al. (2007) · American Journal of Epidemiology · doi:10.1093/aje/kwm021 · Cited by 860
Prediction of acute myeloid leukaemia risk in healthy individuals
Abelson, S., Collord, G., Ng, S. W. K., Weissbrod, O., Mendelson Cohen, N., Niemeyer, E., Barda, N., Zuzarte, P. C., Heisler, L., Sundaravadanam, Y., et al. (2018) · Nature · doi:10.1038/s41586-018-0317-6 · Cited by 850
Tet2 is required to resolve inflammation by recruiting Hdac2 to specifically repress IL-6
Zhang, Q., Zhao, K., Shen, Q., Han, Y., Gu, Y., Li, X., Zhao, D., Liu, Y., Wang, C., Zhang, X., et al. (2015) · Nature · doi:10.1038/nature15252 · Cited by 807 · cited 1×
“3 Given that the common CHIP-associated mutations are known to alter the development and function of myeloid cells (6, 9, 11), we hypothesized that CHIP may also be associated with risk of AD.”
Dementia and Alzheimer Disease Incidence: A Prospective Cohort Study
Kukull, W. A., Higdon, R., Bowen, J. D., McCormick, W. C., Teri, L., Schellenberg, G. D., van Belle, G., Jolley, L., & Larson, E. B. (2002) · Archives of Neurology · doi:10.1001/archneur.59.11.1737 · Cited by 806
Self-citationInherited causes of clonal haematopoiesis in 97,691 whole genomes
Bick, A. G., Weinstock, J. S., Nandakumar, S. K., Fulco, C. P., Bao, E. L., Zekavat, S. M., Szeto, M. D., Liao, X., Leventhal, M. J., Nasser, J., et al. (2020) · Nature · doi:10.1038/s41586-020-2819-2 · Cited by 733
Self-citationBrain cell type–specific enhancer–promoter interactome maps and disease - risk association
Nott, A., Holtman, I. R., Coufal, N. G., Schlachetzki, J. C. M., Yu, M., Hu, R., Han, C. Z., Pena, M., Xiao, J., Wu, Y., et al. (2019) · Science · doi:10.1126/science.aay0793 · Cited by 699
Skull and vertebral bone marrow are myeloid cell reservoirs for the meninges and CNS parenchyma
Cugurra, A., Mamuladze, T., Rustenhoven, J., Dykstra, T., Beroshvili, G., Greenberg, Z. J., Baker, W., Papadopoulos, Z., Drieu, A., Blackburn, S., et al. (2021) · Science · doi:10.1126/science.abf7844 · Cited by 681
Somatic mutations precede acute myeloid leukemia years before diagnosis
Desai, P., Mencia-Trinchant, N., Savenkov, O., Simon, M. S., Cheang, G., Lee, S., Samuel, M., Ritchie, E. K., Guzman, M. L., Ballman, K. V., et al. (2018) · Nature Medicine · doi:10.1038/s41591-018-0081-z · Cited by 619
Herisson, F., Frodermann, V., Courties, G., Rohde, D., Sun, Y., Vandoorne, K., Wojtkiewicz, G. R., Masson, G. S., Vinegoni, C., Kim, J., et al. (2018) · Nature Neuroscience · doi:10.1038/s41593-018-0213-2 · Cited by 610
Population dynamics of normal human blood inferred from somatic mutations
Lee-Six, H., Øbro, N. F., Shepherd, M. S., Grossmann, S., Dawson, K., Belmonte, M., Osborne, R. J., Huntly, B. J. P., Martincorena, I., Anderson, E., et al. (2018) · Nature · doi:10.1038/s41586-018-0497-0 · Cited by 604 · cited 1×
“Hematopoietic stem cells (HSCs) randomly accumulate somatic mutations during aging (1).”
Late onset Alzheimer’s disease genetics implicates microglial pathways in disease risk
Efthymiou, A. G., & Goate, A. M. (2017) · Molecular Neurodegeneration · doi:10.1186/s13024-017-0184-x · Cited by 562
Leukemia-associated somatic mutations drive distinct patterns of age-related clonal hemopoiesis
McKerrell, T., Park, N., Moreno, T., Grove, C. S., Ponstingl, H., Stephens, J., Crawley, C., Craig, J., Scott, M. A., Hodkinson, C., et al. (2015) · Cell Reports · doi:10.1016/j.celrep.2015.02.005 · Cited by 534
Schwartzentruber, J., Cooper, S., Liu, J. Z., Barrio-Hernandez, I., Bello, E., Kumasaka, N., Young, A. M. H., Franklin, R. J. M., Johnson, T., Estrada, K., et al. (2021) · Nature Genetics · doi:10.1038/s41588-020-00776-w · Cited by 532 · cited 1×
“Summary statistics from a large AD genome-wide association study (GWAS) and GWAS-by-proxy metaanalysis(16) were then used to perform Mendelian randomization using the inverse-variance weighted”
Sano, S., Oshima, K., Wang, Y., Katanasaka, Y., Sano, M., & Walsh, K. (2018) · Circulation Research · doi:10.1161/circresaha.118.313225 · Cited by 417
Kar, S. P., Quiros, P. M., Gu, M., Jiang, T., Mitchell, J., Langdon, R., Iyer, V., Barcena, C., Vijayabaskar, M. S., Fabre, M. A., et al. (2022) · Nature Genetics · doi:10.1038/s41588-022-01121-z · Cited by 377
Corces, M. R., Shcherbina, A., Kundu, S., Gloudemans, M. J., Frésard, L., Granja, J. M., Louie, B. H., Eulalio, T., Shams, S., Bagdatli, S. T., et al. (2020) · Nature Genetics · doi:10.1038/s41588-020-00721-x · Cited by 358
Self-citationSomatic mutations and cell identity linked by Genotyping of Transcriptomes
Nam, A. S., Kim, K.-T., Chaligne, R., Izzo, F., Ang, C., Taylor, J., Myers, R. M., Abu-Zeinah, G., Brand, R., Omans, N. D., et al. (2019) · Nature · doi:10.1038/s41586-019-1367-0 · Cited by 333
Common and rare variant associations with clonal haematopoiesis phenotypes
Kessler, M. D., Damask, A., O’Keeffe, S., Banerjee, N., Li, D., Watanabe, K., Marketta, A., Van Meter, M., Semrau, S., Horowitz, J., et al. (2022) · Nature · doi:10.1038/s41586-022-05448-9 · Cited by 313
Lund, H., Pieber, M., Parsa, R., Han, J., Grommisch, D., Ewing, E., Kular, L., Needhamsen, M., Espinosa, A., Nilsson, E., et al. (2018) · Nature Communications · doi:10.1038/s41467-018-07295-7 · Cited by 249
Evaluation of Dementia in the Cardiovascular Health Cognition Study
López, O. L., Kuller, L. H., Fitzpatrick, A. L., Ives, D. G., Becker, J. T., & Beauchamp, N. (2003) · Neuroepidemiology · doi:10.1159/000067110 · Cited by 239
Skrivankova, V. W., Richmond, R. C., Woolf, B. A. R., Yarmolinsky, J., Davies, N. M., Swanson, S. A., VanderWeele, T. J., Higgins, J. P., Timpson, N. J., Dimou, N., et al. (2021) · Apollo (University of Cambridge) · doi:10.17863/cam.77918 · Cited by 209
The Alzheimer's Disease Sequencing Project: Study design and sample selection
Beecham, G. W., Bis, J. C., Martin, E. R., Choi, S.-H., DeStefano, A. L., van Duijn, C. M., Fornage, M., Gabriel, S. B., Koboldt, D. C., Larson, D. E., et al. (2017) · Neurology Genetics · doi:10.1212/nxg.0000000000000194 · Cited by 195
Self-citationThe Framingham Study An Epidemiological Approach to Coronary Heart Disease
Dawber, T. R., & Kannel, W. B. (1966) · Circulation · doi:10.1161/01.cir.34.4.553 · Cited by 177
Moreno–Grau, S., de Rojas, I., Hernández, I., Quintela, I., Montrreal, L., Alegret, M., Hernández‐Olasagarre, B., Madrid, L., González‐Pérez, A., Maroñas, O., et al. (2019) · Alzheimer s & Dementia · doi:10.1016/j.jalz.2019.06.4950 · Cited by 161
Miller, T. E., Lareau, C. A., Verga, J. A., DePasquale, E. A. K., Liu, V., Ssozi, D., Sándor, K., Yin, Y., Ludwig, L. S., Farran, C. A. E., et al. (2022) · Nature Biotechnology · doi:10.1038/s41587-022-01210-8 · Cited by 150
Self-citationNam, A. S., Dusaj, N., Izzo, F., Murali, R., Myers, R. M., Mouhieddine, T. H., Sotelo, J., Benbarche, S., Waarts, M., Gaiti, F., et al. (2022) · Nature Genetics · doi:10.1038/s41588-022-01179-9 · Cited by 140
Clonal hematopoiesis associated with epigenetic aging and clinical outcomes
Nachun, D. C., Lu, A. T.-H., Bick, A. G., Natarajan, P., Weinstock, J. S., Szeto, M. D., Kathiresan, S., Abecasis, G. R., Taylor, K. D., Guo, X., et al. (2021) · Aging Cell · doi:10.1111/acel.13366 · Cited by 136
Self-citationNeuronal Nuclei Isolation from Human Postmortem Brain Tissue
Matevossian, A., & Akbarian, S. (2008) · Journal of Visualized Experiments · doi:10.3791/914 · Cited by 126
Ospina-Romero, M., Glymour, M. M., Hayes-Larson, E., Mayeda, E. R., Graff, R. E., Brenowitz, W. D., Ackley, S. F., Witte, J. S., & Kobayashi, L. C. (2020) · JAMA Network Open · doi:10.1001/jamanetworkopen.2020.25515 · Cited by 124
Aberrant activation of TCL1A promotes stem cell expansion in clonal haematopoiesis
Weinstock, J. S., Gopakumar, J., Burugula, B. B., Uddin, M. M., Jahn, N., Belk, J. A., Bouzid, H., Dániel, B., Miao, Z., Ly, N., et al. (2023) · Nature · doi:10.1038/s41586-023-05806-1 · Cited by 120
Self-citationHigh prevalence of focal and multi-focal somatic genetic variants in the human brain
Keogh, M. J., Wei, W., Aryaman, J., Walker, L., van den Ameele, J., Coxhead, J., Wilson, I., Bashton, M., Beck, J., West, J., et al. (2018) · Nature Communications · doi:10.1038/s41467-018-06331-w · Cited by 74
Biological and induction effects of phenobarbital and 3-methylcholanthrene in mink (Mustela vison).
Shull, L. R., Rush, G. F., Olson, B. A., et al. (1983) · Drug Metabolism and Disposition · doi:10.1016/s0090-9556(25)08047-x · Cited by 11
Cited by
Sorted by citations
Revised criteria for diagnosis and staging of Alzheimer's disease: Alzheimer's Association Workgroup
Jack, C. R., Andrews, J. S., Beach, T. G., Buracchio, T., Dunn, B., Graf, A., Hansson, O., Ho, C., Jagust, W., McDade, E., et al. (2024) · Alzheimer's & Dementia · doi:10.1002/alz.13859 · Cited by 2,803
Causes and consequences of clonal hematopoiesis
Weeks, L. D., & Ebert, B. L. (2023) · Blood · doi:10.1182/blood.2023022222 · Cited by 169
Clonal haematopoiesis and dysregulation of the immune system
Belizaire, R., Wong, W. J., Robinette, M. L., & Ebert, B. L. (2023) · Nature Reviews Immunology · doi:10.1038/s41577-023-00843-3 · Cited by 161
Clonal hematopoiesis, somatic mosaicism, and age-associated disease
Evans, M. A., & Walsh, K. X. (2022) · Physiological Reviews · doi:10.1152/physrev.00004.2022 · Cited by 112
Cellular senescence, DNA damage, and neuroinflammation in the aging brain
Zhang, W., Sun, H., Wang, X., Dumont, A. S., & Liu, Q. (2024) · Trends in Neurosciences · doi:10.1016/j.tins.2024.04.003 · Cited by 121
Metadata
- Authors
- Bouzid, H., Belk, J. A., Jan, M., Qi, Y., Sarnowski, C., Wirth, S., Ma, L., Chrostek, M. R., Ahmad, H., Nachun, D., Yao, W., NHLBI Trans-Omics for Precision Medicine (TOPMed) Consortium, Bis, J., Psaty, B., Beiser, A., Bick, A. G., Bis, J. C., Fornage, M., Longstreth, W. T., Lopez, O. L., Natarajan, P., Psaty, B. M., Satizabal, C. L., Weinstock, J., Larson, E. B., Crane, P. K., Keene, C. D., Seshadri, S., Satpathy, A. T., Montine, T. J., & Jaiswal, S.
- Affiliations
- Stanford Medicine (US)
- Stanford University (US)
- Massachusetts General Hospital (US)
- The University of Texas Health Science Center at Houston (US)
- Boston University (US)
- Vanderbilt University Medical Center (US)
- Brown Foundation Institute of Molecular Medicine for the Prevention of Human Diseases (US)
- Broad Institute (US)
- University of Michigan (US)
- Kaiser Permanente Washington Health Research Institute (US)
- University of Washington (US)
- The University of Texas at San Antonio Health Science Center (US)
- Corresponding author
- Jaiswal, Siddhartha
- ORCID
- Belk, Julia A.
- Jan, Max
- Qi, Yanyan
- Sarnowski, Chloé
- Wirth, Sara
- Chrostek, Matthew R.
- Ahmad, Herra
- Nachun, Daniel
- Yao, Winnie
- Beiser, Alexa
- Bick, Alexander G.
- Bis, Joshua C.
- Fornage, Myriam
- Lopez, Oscar L.
- Natarajan, Pradeep
- Psaty, Bruce M.
- Weinstock, Joshua
- Larson, Eric B.
- Crane, Paul K.
- Keene, C. Dirk
- Seshadri, Sudha
- Satpathy, Ansuman T.
- Montine, Thomas J.
- Jaiswal, Siddhartha
- Venue
- Nature Medicine
- Published
- 2023-06-15
- Volume
- 29
- Issue
- 7
- Pages
- 1662-1670
- ISSN
- 1078-8956 (ISSN-L)
- 1546-170X
- PMC
- PMC10353941
- OpenAlex
- W4380785142
- Semantic Scholar
- 3970db4d8b0a3f1881e30cd191d2f97be962e3ea
- Cited by
- 169
- References
- 60
- Citations by year
- 2026: 42 · 2025: 58 · 2024: 44 · 2023: 19
- FWCI
- 23.48
- Type
- journal article
- Language
- en
- Open access
- hybrid
- doi.org
- Locations
- Nature Medicine (publishedVersion, cc-by)
- medRxiv (acceptedVersion, cc-by-nc-nd)
- PubMed (publishedVersion)
- PubMed Central (submittedVersion, cc-by)
- Digital Commons-TMC (Texas Medical Center) (submittedVersion)
- Informationszentrum Lebenswissenschaften (ZB MED) (submittedVersion, cc-by)
- Funders
- U.S. Department of Health & Human Services | National Institutes of Health (DP2-HL157540, R01-HL148565, K08CA230188)
- Burroughs Wellcome Fund (DP5 OD029586)
- Fondation Leducq (TNE-18CVD04)
- Ludwig Center for Cancer Stem Cell Research at Stanford University Knight Initiative for Brain Resilience
- U.S. Department of Health & Human Services | NIH | National Institute on Aging (R00 AG066849)
- Fireman Endowed Chair in Vascular Medicine
- Nancy and Buster Alvord Endowment
- U.S. Department of Health & Human Services | NIH | Office of Extramural Research, National Institutes of Health (AG053959)
- Topics
- Life Sciences › Neuroscience › Cellular and Molecular Neuroscience › Alzheimer's disease research and treatments
- Health Sciences › Medicine › Psychiatry and Mental health › Dementia and Cognitive Impairment Research
- Life Sciences › Neuroscience › Neurology › Neuroinflammation and Neurodegeneration Mechanisms
- Keywords
- clonal hematopoiesis of indeterminate potential, Alzheimer's disease, dementia risk, microglia, myeloid cells, brain microglia, Mendelian randomization, causal relationship
- MeSH terms
- Clonal Hematopoiesis, Alzheimer Disease, Hematopoiesis, Hematopoietic Stem Cells, Humans, Mutation, Precancerous Conditions
About these checks
Registry, retraction, Cites and statistics results are computed, not judged, with one exception: a printed reference that no index lists is read once by a model before it counts as a citation error. Claims are extracted by a model and kept only when their quote appears verbatim in the text; each cited source is then checked, with a model’s help, for whether it says what the claim relies on. Those verdicts can be wrong — read the claim’s quote and the cited source before relying on one.
A language model drew the claims from the paper on 2026-10-19, under version 3 of the claim definition (model deepseek-v4.1-flash, prompt extract-v3).
A second model labelled each claim on 2026-10-19 (model jev-1.13-20260917, definition revision gold-guideline-v0.2).
Cited sources are checked with a language model’s help (gpt-6-sol).
Statistics and arithmetic are recomputed, not judged.
Confidence bands are shown only for fields calibrated on our annotated test set. None is calibrated yet, so no band is shown.
What counts as a claim ›How we measure confidence ›How we check this ›
Are you an author, or do you see a problem with this page? Request a review
