

The DOI matches its Crossref record; 43 of the 43 references it cites were found in a registry or an index; 49 of the 65 sources its claims cite were checked for support.
Effects of tirzepatide on circulatory overload and end-organ damage in heart failure with preserved ejection fraction and obesity: a secondary analysis of the SUMMIT trial
Open accessAbstract
Patients with obesity-related heart failure with preserved ejection fraction (HFpEF) display circulatory volume expansion and pressure overload contributing to cardiovascular–kidney end-organ damage. In the SUMMIT trial, patients with HFpEF and obesity were randomized to the long-acting glucose-dependent insulinotropic polypeptide receptor and glucagon-like peptide-1 receptor agonist tirzepatide ( n = 364, 200 women) or placebo ( n = 367, 193 women). As reported separately, tirzepatide decreased cardiovascular death or worsening heart failure. Here, in this mechanistic secondary analysis of the SUMMIT trial, tirzepatide treatment at 52 weeks, as compared with placebo, reduced systolic blood pressure (estimated treatment difference (ETD) −5 mmHg, 95% confidence interval (CI) −7 to −3; P < 0.001), decreased estimated blood volume (ETD −0.58 l, 95% CI −0.63 to −0.52; P < 0.001) and reduced C-reactive protein levels (ETD −37.2%, 95% CI −45.7 to −27.3; P < 0.001). These changes were coupled with an increase in estimated glomerular filtration rate (ETD 2.90 ml min −1 1.73 m −2 yr −1 , 95% CI 0.94 to 4.86; P = 0.004), a decrease in urine albumin–creatinine ratio (ETD 24 weeks, −25.0%, 95% CI −36 to −13%; P < 0.001; 52 weeks, −15%, 95% CI −28 to 0.1; P = 0.051), a reduction in N-terminal prohormone B-type natriuretic peptide levels (ETD 52 weeks −10.5%, 95% CI −20.7 to 1.0%; P = 0.07) and a reduction in troponin T levels (ETD 52 weeks −10.4%, 95% CI −16.7 to −3.6; P = 0.003). In post hoc exploratory analyses, decreased estimated blood volume with tirzepatide treatment was significantly correlated with decreased blood pressure, reduced microalbuminuria, improved Kansas City Cardiomyopathy Questionnaire Clinical Summary Score and increased 6-min walk distance. Moreover, decreased C-reactive protein levels were correlated with reduced troponin T levels and improved 6-min walk distance. In conclusion, tirzepatide reduced circulatory volume–pressure overload and systemic inflammation and mitigated cardiovascular–kidney end-organ injury in patients with HFpEF and obesity, providing new insights into the mechanisms of benefit from tirzepatide. ClinicalTrials.gov registration: NCT04847557 .
Overview
AI snapshot
Written from the paper’s full text.
TL;DR
In a mechanistic secondary analysis of the SUMMIT trial, tirzepatide reduced circulatory volume–pressure overload and systemic inflammation in patients with obesity-related HFpEF. These changes were accompanied by improved kidney function, reduced albuminuria and myocardial injury, with estimated blood volume reductions correlating with clinical improvement.
Key findings
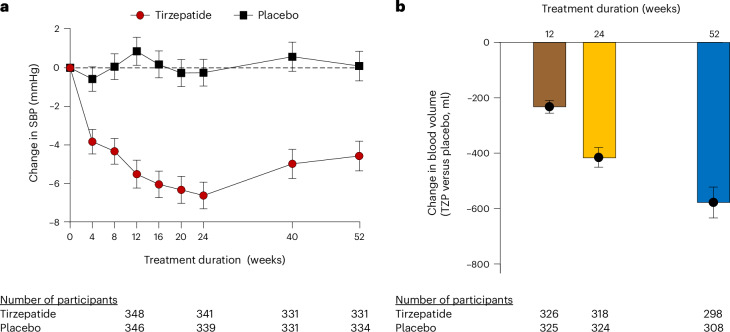
- At 52 weeks, tirzepatide versus placebo reduced systolic blood pressure (ETD −4.7 mmHg, 95% CI −6.8 to −2.5; P < 0.001), estimated blood volume (ETD −0.58 l, 95% CI −0.63 to −0.52; P < 0.001), estimated plasma volume (ETD −0.32 l, 95% CI −0.36 to −0.27; P < 0.001) and pulse pressure (ETD −3.9 mmHg, 95% CI −5.6 to −2.2; P < 0.001); diastolic blood pressure effects were not statistically significant.
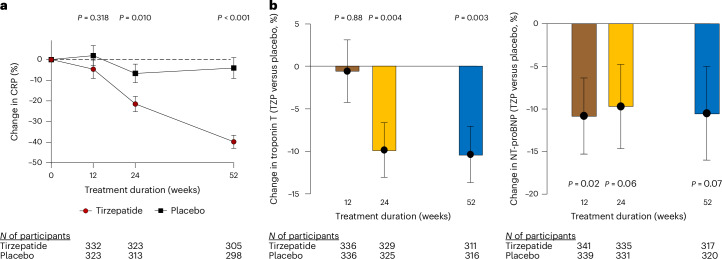
- Tirzepatide reduced high-sensitivity CRP at 52 weeks (ETD −37.2%, 95% CI −45.7 to −27.3; P < 0.001), troponin T at 52 weeks (ETD −10.4%, 95% CI −16.7 to −3.6; P = 0.003), and NT-proBNP at 52 weeks (ETD −10.5%, 95% CI −20.7 to 1.0; P = 0.072). Among patients with elevated baseline CRP, normalization occurred in 40.4% with tirzepatide versus 19.4% with placebo (odds ratio 2.90, 95% CI 1.82 to 4.64; P < 0.001).
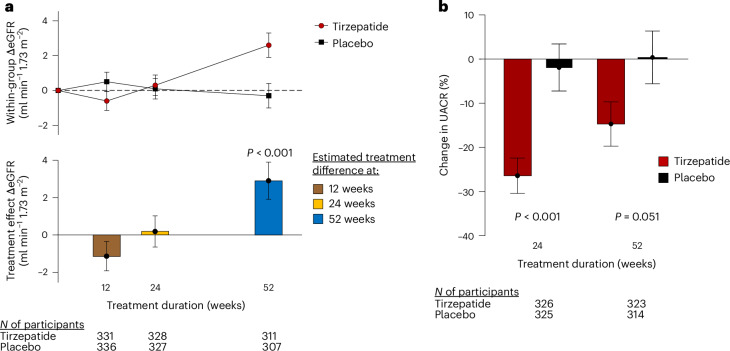
- Kidney outcomes: eGFR improved at 52 weeks with tirzepatide versus placebo (ETD 2.9 ml min−1 1.73 m−2, 95% CI 0.9 to 4.9; P = 0.004), and UACR decreased at 24 weeks (ETD −25.0%, 95% CI −35.5 to −12.7; P < 0.001) and 52 weeks (ETD −15.1%, 95% CI −28.0 to 0.1; P = 0.051).
- In post hoc exploratory analyses, reductions in estimated blood volume with tirzepatide correlated with decreases in systolic blood pressure (slope 6.12, 95% CI 3.47 to 8.78; P < 0.001), decreases in albuminuria (slope 46.7, 95% CI 11.48 to 81.87; P = 0.009), improved KCCQ-CSS (slope −6.287, 95% CI −8.091 to −4.482; P < 0.001) and increased 6-min walk distance (slope −1.175, 95% CI −1.810 to −0.539; P < 0.001). Decreased CRP correlated with reduced troponin T (slope 0.239, 95% CI 0.029 to 0.450; P = 0.026) and improved 6-min walk distance (slope −0.002, 95% CI −0.004 to 0.000; P = 0.016).
Methods
- Secondary mechanistic analysis of the SUMMIT trial (NCT04847557), a randomized, double-blind, placebo-controlled trial in 731 patients with obesity-related HFpEF: tirzepatide n = 364, placebo n = 367, at 129 centers in 9 countries. Tirzepatide was titrated to 15.0 mg per week subcutaneously as tolerated.
- Assessed outcomes included blood pressure, estimated blood volume and plasma volume, eGFR, urine albumin–creatinine ratio, high-sensitivity CRP, high-sensitivity troponin T and NT-proBNP at baseline and 12, 24 and 52 weeks. Primary eGFR analysis used cystatin C–based CKD-EPI; sensitivity analyses used creatinine-based and combined creatinine–cystatin C formulas.
- Main analysis used mixed-effects model repeated measures including treatment, time, treatment-by-time interaction, stratification factors and baseline value; linear and logistic regression explored correlations. Estimated blood volume/plasma volume and regression analyses were post hoc/exploratory; no correction was made for multiple hypothesis testing.
Limitations
- The paper states that plasma volume was estimated using a weight-based formula (Kaplan–Hakim), so weight loss with tirzepatide would mathematically be expected to reduce estimated plasma volume; the magnitude of blood/plasma volume reduction may therefore be overestimated. Direct indicator-dilution measurement was considered impractical in a large multicenter trial.
- The paper states that estimated blood volume/plasma volume and the regression analyses were post hoc and exploratory, so these data should be treated as hypothesis-generating; all other outcomes were prespecified. No adjustment was made for multiple hypothesis testing.
- The paper notes that follow-up for most measures was 52 weeks, limiting conclusions about longer-term effects. It also notes that troponin T can be elevated in skeletal muscle disorders, though such patients were excluded, and that weight loss may reduce skeletal muscle and affect creatinine-based eGFR, which is why cystatin C was used; kidney benefits were consistent across eGFR formulas. Evident from the text: NT-proBNP was only slightly elevated on average and elevated NT-proBNP was not required for eligibility, limiting the ability to detect further reductions.
Model-written summary. Check it against the paper before relying on it.
Integrity signals
Registry
Cites
Statistics
Figures
Verification
Claims the paper makes
78 Own result · 21 Partly supported · 18 Own interpretation · 14 Own method · 9 Supported · 5 Sources not found · 3 No basis given · 2 No full text of the sources · 2 Not checked yet · 1 Supported so far · 1 Couldn’t confirm · accuracy not yet measured
The cited sources support only part of this claim — read each source’s verdict below.
In the paper
“Notably, cardiac injury is greater in patients with obesity-related HFpEF compared with those without obesity15.”
§ Effects of tirzepatide on circulatory overload and end-organ damage in heart failure with preserved ejection fraction and obesity: a secondary analysis of the SUMMIT trial > Main
What the sources say
- Partly supportedcites [15] Obokata, M. et al. Uncoupling between intravascular and distending pressures leads to underestimation of circulatory congestion in obesity. Eur. J. Heart Fail. 24, 353–361 (2022). sourceExperimental — accuracy not yet measured
The Subject characteristics section reports higher troponin T and GDF-15 levels in the higher-BMI group, consistent with greater biomarkers of myocardial injury or stress. But the Study population section describes patients with unexplained dyspnoea and preserved ejection fraction, not exclusively diagnosed HFpEF; the comparison was BMI ≥35 versus <35 kg/m², not obesity versus no obesity. The difference in the proportion meeting the paper’s myocardial-injury threshold was not statistically significant. (LLM, conf=0.90)
plaincorrelational- Asserted: passes — The authors put it forward as true.
- Checkable: passes — It can be checked against evidence.
- Load-bearing: unclear — It is unclear whether the paper’s conclusions depend on it.
- Based: passes — The paper gives a reason why it holds.
- Partly supported
The cited sources support only part of this claim — read each source’s verdict below.
In the paper
“Indeed, hypertension, CKD and BV expansion are the three features that best distinguish obesity-related HFpEF from asymptomatic individuals with obesity but no HF9.”
§ Effects of tirzepatide on circulatory overload and end-organ damage in heart failure with preserved ejection fraction and obesity: a secondary analysis of the SUMMIT trial > Main
What the sources say
- Partly supportedcites [9] Morgen, C. S. et al. Obesity, cardiorenal comorbidities, and risk of hospitalization in patients with heart failure with preserved ejection fraction. Mayo Clin. Proc. 98, 1458–1468 (2023). sourceExperimental — accuracy not yet measured
Tables 1 and 2 show more hypertension and CKD in the HFpEF group than in BMI-matched controls, and the Discussion reports greater volume expansion. The paper does not identify these as the three features that best distinguish the groups; it also reports differences in other cardiometabolic comorbidities. (LLM, conf=0.88)
plaincorrelational- Asserted: passes — The authors put it forward as true.
- Checkable: passes — It can be checked against evidence.
- Load-bearing: unclear — It is unclear whether the paper’s conclusions depend on it.
- Based: passes — The paper gives a reason why it holds.
- Partly supported
The cited sources support only part of this claim — read each source’s verdict below.
In the paper
“This may reflect the impact of reductions in renal perfusion pressure that have been associated with reduction in eGFR in both acute and chronic HF30,31.”
§ Effects of tirzepatide on circulatory overload and end-organ damage in heart failure with preserved ejection fraction and obesity: a secondary analysis of the SUMMIT trial > Discussion
What the sources say
- Partly supportedcites [30] Pellicori, P. et al. Impact of vasodilators on diuretic response in patients with congestive heart failure: a mechanistic trial of cimlanod (BMS-986231). Eur. J. Heart Fail. 26, 142–151 (2024). sourceExperimental — accuracy not yet measured
The Discussion (page unavailable) proposes reduced renal perfusion pressure as a possible explanation for the response to cimlanod, and the Intervention table (page unavailable) reports decreases in both systolic BP and eGFR. The paper does not establish a direct relationship between the two decreases or show that this mechanism is associated with reduced eGFR in both acute and chronic heart failure. (LLM, conf=0.82)
- Not checked — no full text of the sourcecites [31] Packer, M., Lee, W. H. & Kessler, P. D. Preservation of glomerular filtration rate in human heart failure by activation of the renin-angiotensin system. Circulation 74, 766–774 (1986). source
hedgedconditional- Asserted: passes — The authors put it forward as true.
- Checkable: passes — It can be checked against evidence.
- Load-bearing: passes — The paper’s conclusions depend on it.
- Based: passes — The paper gives a reason why it holds.
- Partly supported
The cited sources support only part of this claim — read each source’s verdict below.
In the paper
“It is noteworthy that adipocytes release factors that promote sodium retention and volume expansion, including leptin and aldosterone, and the reduction in adipocyte mass with tirzepatide may reduce these influences23.”
§ Effects of tirzepatide on circulatory overload and end-organ damage in heart failure with preserved ejection fraction and obesity: a secondary analysis of the SUMMIT trial > Discussion
What the sources say
- Partly supportedcites [23] Packer, M. Leptin–aldosterone–neprilysin axis: identification of its distinctive role in the pathogenesis of the three phenotypes of heart failure in people with obesity. Circulation 137, 1614–1631 (2018). sourceExperimental — accuracy not yet measured
The Conclusions (page not provided) say leptin may contribute to plasma volume expansion and that aldosterone is secreted by adipocytes. The section on renal leptin signaling also links leptin and aldosterone to sodium retention. The paper does not address tirzepatide or establish that reducing adipocyte mass with it reduces these influences. (LLM, conf=0.85)
hedgedconditional- Asserted: passes — The authors put it forward as true.
- Checkable: passes — It can be checked against evidence.
- Load-bearing: passes — The paper’s conclusions depend on it.
- Based: passes — The paper gives a reason why it holds.
- Partly supported
The cited sources support only part of this claim — read each source’s verdict below.
In the paper
“Pulse pressure is inversely correlated with arterial compliance, which is frequently impaired in patients with HFpEF, where increases in aortic stiffness contribute to elevation in cardiac filling pressures, especially during exercise24.”
§ Effects of tirzepatide on circulatory overload and end-organ damage in heart failure with preserved ejection fraction and obesity: a secondary analysis of the SUMMIT trial > Discussion
What the sources say
- Partly supportedcites [24] Reddy, Y. N. V. et al. Arterial stiffening with exercise in patients with heart failure and preserved ejection fraction. J. Am. Coll. Cardiol. 70, 136–148 (2017). sourceExperimental — accuracy not yet measured
The Methods (Arterial Waveform Analysis) define total arterial compliance as stroke volume index divided by central pulse pressure, supporting an inverse relationship when stroke volume is held constant. The Results (Arterial Reserve With Submaximal Exercise) report lower compliance in HFpEF and an association between lower compliance and higher filling pressures during exercise. The Discussion (Vascular Stiffening in HFpEF) explicitly says this study cannot prove causality, so the sentence's assertion that increased stiffness contributes to elevated filling pressures is stronger than the evidence establishes. (LLM, conf=0.85)
plaincorrelational- Asserted: passes — The authors put it forward as true.
- Checkable: passes — It can be checked against evidence.
- Load-bearing: passes — The paper’s conclusions depend on it.
- Based: passes — The paper gives a reason why it holds.
- Partly supported
Every source the paper cites for this claim was checked and supports it.
In the paper
“Volume expansion in obesity-related HFpEF exacerbates elevation in cardiac filling pressures that develop due to impairments in left ventricular distensibility3, and thus, reducing circulating volume may decrease cardiac filling pressures.”
§ Effects of tirzepatide on circulatory overload and end-organ damage in heart failure with preserved ejection fraction and obesity: a secondary analysis of the SUMMIT trial > Discussion
What the sources say
- Supportedcites [3] Borlaug, B. A. et al. Obesity and heart failure with preserved ejection fraction: new insights and pathophysiological targets. Cardiovasc. Res. 118, 3434–3450 (2023). source
Section 6.1.1 (Diuretics) says patients with obesity-related HFpEF often have volume expansion and that diuretics reduce their filling pressures. This directly supports the attributed claim that reducing circulating volume may decrease filling pressures. (LLM, conf=0.94)
hedgedconditional- Asserted: passes — The authors put it forward as true.
- Checkable: passes — It can be checked against evidence.
- Load-bearing: passes — The paper’s conclusions depend on it.
- Based: passes — The paper gives a reason why it holds.
- Supported
Every source the paper cites for this claim was checked and supports it.
In the paper
“Indeed, volume expansion, CKD and greater burden of hypertension best distinguish individuals from obesity-related HFpEF from age, sex and BMI-matched patients with obesity but no HF9.”
§ Effects of tirzepatide on circulatory overload and end-organ damage in heart failure with preserved ejection fraction and obesity: a secondary analysis of the SUMMIT trial > Discussion
What the sources say
- Supportedcites [9] Morgen, C. S. et al. Obesity, cardiorenal comorbidities, and risk of hospitalization in patients with heart failure with preserved ejection fraction. Mayo Clin. Proc. 98, 1458–1468 (2023). source
The Results report higher plasma volume and more CKD in patients with HFpEF than in controls matched on age, sex, and BMI. Tables 1 and 2 also show a higher prevalence of hypertension in the HFpEF group across BMI categories. The Discussion identifies volume expansion, kidney dysfunction, and cardiometabolic burden as distinguishing features; it does not formally rank them as the 'best' discriminators. (LLM, conf=0.90)
plaincorrelational- Asserted: passes — The authors put it forward as true.
- Checkable: passes — It can be checked against evidence.
- Load-bearing: passes — The paper’s conclusions depend on it.
- Based: passes — The paper gives a reason why it holds.
- Supported
Every source the paper cites for this claim was checked and supports it.
In the paper
“Volume expansion in obesity-related HFpEF exacerbates elevation in cardiac filling pressures that develop due to impairments in left ventricular distensibility3, and thus, reducing circulating volume may decrease cardiac filling pressures.”
§ Effects of tirzepatide on circulatory overload and end-organ damage in heart failure with preserved ejection fraction and obesity: a secondary analysis of the SUMMIT trial > Discussion
What the sources say
- Supportedcites [3] Borlaug, B. A. et al. Obesity and heart failure with preserved ejection fraction: new insights and pathophysiological targets. Cardiovasc. Res. 118, 3434–3450 (2023). source
Section 5.7.1 reports that cardiac filling pressures in obese HFpEF correlate directly with plasma volume. Section 5.1 links obesity to increased LV diastolic chamber stiffness, and section 6.1.1 states that diuretics reduce filling pressures in obesity-related HFpEF. Together, these passages support the attributed paraphrase. (LLM, conf=0.89)
plaindirect- Asserted: passes — The authors put it forward as true.
- Checkable: passes — It can be checked against evidence.
- Load-bearing: passes — The paper’s conclusions depend on it.
- Based: passes — The paper gives a reason why it holds.
- Supported
The cited sources support only part of this claim — read each source’s verdict below.
In the paper
“However, in the case of tirzepatide, it is noteworthy that glucagon-like peptide-1 receptor agonism produces a direct effect itself to promote urinary sodium excretion, independent of changes in adipose tissue volume38,39.”
§ Effects of tirzepatide on circulatory overload and end-organ damage in heart failure with preserved ejection fraction and obesity: a secondary analysis of the SUMMIT trial > Discussion
What the sources say
- Partly supportedcites [38] Asmar, A. et al. The renal extraction and the natriuretic action of GLP-1 in humans depend on interaction with the GLP-1 receptor. J. Clin. Endocrinol. Metab. 106, e11–e19 (2021). sourceExperimental — accuracy not yet measured
The Discussion (page not provided) reports that GLP-1 increased urinary sodium excretion during extracellular fluid volume expansion and that a GLP-1 receptor antagonist abolished this effect. It describes a direct tubular mechanism as likely, but does not examine changes in adipose tissue volume or establish independence from them. The observed effect is also qualified by fluid-volume expansion. (LLM, conf=0.86)
- Partly supportedcites [39] Asmar, A. et al. Extracellular fluid volume expansion uncovers a natriuretic action of GLP-1: a functional GLP-1–renal axis in man. J. Clin. Endocrinol. Metab. 104, 2509–2519 (2019). sourceExperimental — accuracy not yet measured
The Results (Renal function and hemodynamics; page not specified) report increased urinary sodium excretion during GLP-1 infusion compared with vehicle. The Discussion (page not specified) limits this finding to sodium-loaded participants and says the effect may be mediated by angiotensin II suppression; it does not establish a direct receptor effect or test independence from changes in adipose tissue volume. (LLM, conf=0.86)
plaindirect- Asserted: passes — The authors put it forward as true.
- Checkable: passes — It can be checked against evidence.
- Load-bearing: passes — The paper’s conclusions depend on it.
- Based: passes — The paper gives a reason why it holds.
- Partly supported
A result the paper reports from its own data — it cites no other source for it, so there is none to check. The quote shows it is in the paper.
In the paper
“In the SUMMIT trial, decreases in estimated BV at 52 weeks (potentially related to the suppression of adipocytokines) were associated with reduction in albuminuria, but we observed no relationship with the improvements in eGFR.”
§ Effects of tirzepatide on circulatory overload and end-organ damage in heart failure with preserved ejection fraction and obesity: a secondary analysis of the SUMMIT trial > Discussion
plain- Asserted: passes — The authors put it forward as true.
- Checkable: passes — It can be checked against evidence.
- Load-bearing: passes — The paper’s conclusions depend on it.
- Based: passes — The paper gives a reason why it holds.
- It may state two separate claims as one. 37
- Probably not a substantial claim. 32
The cited sources support only part of this claim — read each source’s verdict below.
In the paper
“Individuals with obesity-related HFpEF have a high burden of hypertension and chronic kidney disease (CKD), which develops in response to marked blood volume (BV) expansion and chronic systemic inflammation5–8.”
§ Effects of tirzepatide on circulatory overload and end-organ damage in heart failure with preserved ejection fraction and obesity: a secondary analysis of the SUMMIT trial > Main
What the sources say
- Partly supportedcites [5] Obokata, M., Reddy, Y. N., Pislaru, S. V., Melenovsky, V. & Borlaug, B. A. Evidence supporting the existence of a distinct obese phenotype of heart failure with preserved ejection fraction. Circulation 136, 6–19 (2017). sourceExperimental — accuracy not yet measured
The Results (Subject Characteristics; page unavailable) report more comorbidities and lower eGFR in HFpEF subjects than controls, while the Discussion reports greater plasma-volume expansion in obese HFpEF and describes systemic inflammation as part of obesity-related HFpEF pathophysiology. The paper does not establish that hypertension and CKD specifically develop in response to blood-volume expansion and chronic systemic inflammation. (LLM, conf=0.86)
- Not checked — no full text of the sourcecites [6] Reddy, Y. N. V. et al. Characterization of the obese phenotype of heart failure with preserved ejection fraction: a RELAX trial ancillary study. Mayo Clin. Proc. 94, 1199–1209 (2019). source
- Partly supportedcites [7] Alogna, A. et al. Interleukin-6 in patients with heart failure and preserved ejection fraction. JACC Heart Fail. 11, 1549–1561 (2023). sourceExperimental — accuracy not yet measured
The Discussion describes a greater burden of inflammation in obesity-related HFpEF and worse renal function in patients with higher IL-6. The Potential Mechanisms section mentions plasma volume expansion only as a possible explanation for lower hemoglobin. It does not establish a high burden of hypertension and CKD in this phenotype or show that those conditions develop in response to marked blood-volume expansion and inflammation (page numbers unavailable in our copy). (LLM, conf=0.86)
- Partly supportedcites [8] Litwin, S. E. et al. Obesity in heart failure with preserved ejection fraction: Insights from the REDUCE LAP-HF II trial. Eur. J. Heart Fail. 26, 177–189 (2024). sourceExperimental — accuracy not yet measured
The demographics and comorbidities table (section labelled Conclusions; page unavailable) reports high rates of hypertension and chronic kidney disease in the trial population, including patients with obesity. The Introduction lists increased blood volume and inflammation as proposed mechanisms linking obesity to HFpEF, but does not establish that hypertension or CKD develops in response to those mechanisms, or describe the blood-volume expansion as marked. (LLM, conf=0.88)
plaindirect- Asserted: passes — The authors put it forward as true.
- Checkable: passes — It can be checked against evidence.
- Load-bearing: passes — The paper’s conclusions depend on it.
- Based: passes — The paper gives a reason why it holds.
It may state two separate claims as one.
- Partly supported
The cited sources support only part of this claim — read each source’s verdict below.
In the paper
“Endothelial dysfunction, inflammation and CKD in HFpEF can underlie the development of microalbuminuria, which is correlated with greater cardiac dysfunction and congestion, along with higher risk for HF hospitalization or death10–12.”
§ Effects of tirzepatide on circulatory overload and end-organ damage in heart failure with preserved ejection fraction and obesity: a secondary analysis of the SUMMIT trial > Main
What the sources say
- Partly supportedcites [10] Katz, D. H., Burns, J. A., Aguilar, F. G., Beussink, L. & Shah, S. J. Albuminuria is independently associated with cardiac remodeling, abnormal right and left ventricular function, and worse outcomes in heart failure with preserved ejection fraction. JACC Heart Fail. 2, 586–596 (2014). sourceExperimental — accuracy not yet measured
The Discussion links albuminuria in HFpEF to possible inflammation and endothelial dysfunction, and the Results associate higher UACR with CKD, cardiac dysfunction, and higher BNP. The Results also associate higher UACR with cardiovascular hospitalization (including HF hospitalization) or death. They do not establish that CKD causes microalbuminuria, directly demonstrate greater congestion, or report HF hospitalization or death as a separate endpoint. (LLM, conf=0.84)
- Supportedcites [11] Selvaraj, S. et al. Prognostic value of albuminuria and influence of spironolactone in heart failure with preserved ejection fraction. Circ. Heart Fail. 11, e005288 (2018). source
The Discussion links albuminuria in HFpEF to chronic kidney disease, endothelial dysfunction and systemic inflammation, and reports associations with impaired cardiac function and possible renal venous congestion. The Results report higher risks of HF hospitalization and cardiovascular death in the microalbuminuria group. The source frames the proposed mechanisms and congestion link as possibilities, consistent with the claim's hedged wording. (LLM, conf=0.88)
- Partly supportedcites [12] Boorsma, E. M. et al. Albuminuria as a marker of systemic congestion in patients with heart failure. Eur. Heart J. 44, 368–380 (2023). sourceExperimental — accuracy not yet measured
The Discussion (Endothelial dysfunction; Congestion) proposes endothelial dysfunction as a possible cause of albuminuria and reports correlations with congestion, while cautioning that causality cannot be assessed. The Results (Cox regression analysis) associate albuminuria with mortality and heart-failure hospitalization and find no significant difference in that association between HFpEF and HFrEF. The copy does not establish inflammation or CKD as causes of microalbuminuria in HFpEF, or specifically demonstrate the claimed link with greater cardiac dysfunction in HFpEF. (LLM, conf=0.86)
hedgedconditional- Asserted: passes — The authors put it forward as true.
- Checkable: passes — It can be checked against evidence.
- Load-bearing: passes — The paper’s conclusions depend on it.
- Based: passes — The paper gives a reason why it holds.
Probably not a substantial claim. It may state two separate claims as one.
- Partly supported
The cited sources support only part of this claim — read each source’s verdict below.
In the paper
“Over half of patients with heart failure (HF) have a preserved ejection fraction (HF with preserved ejection fraction, HFpEF), and roughly two-thirds of these patients have obesity1–3.”
§ Effects of tirzepatide on circulatory overload and end-organ damage in heart failure with preserved ejection fraction and obesity: a secondary analysis of the SUMMIT trial > Main
What the sources say
- Not checked — no full text of the sourcecites [1] Redfield, M. M. & Borlaug, B. A. Heart failure with preserved ejection fraction: a review. JAMA 329, 827–838 (2023). source
- Partly supportedcites [2] Borlaug, B. A., Sharma, K., Shah, S. J. & Ho, J. E. Heart failure with preserved ejection fraction: JACC Scientific Statement. J. Am. Coll. Cardiol. 81, 1810–1834 (2023). sourceExperimental — accuracy not yet measured
The Epidemiology of HFpEF passage says HFpEF prevalence is expected to exceed that of heart failure with reduced ejection fraction in the near future; it does not say that over half of current heart-failure patients have HFpEF. The obesity passage says obesity is highly prevalent in HFpEF, but gives no two-thirds figure for obesity. Its two-thirds figure refers instead to epicardial coronary disease. (LLM, conf=0.84)
- Could not verifycites [3] Borlaug, B. A. et al. Obesity and heart failure with preserved ejection fraction: new insights and pathophysiological targets. Cardiovasc. Res. 118, 3434–3450 (2023). sourceExperimental — accuracy not yet measured
The passages from §4 (Diabetes, obesity, and HFpEF) give percentages for diabetes and prediabetes, not obesity. The supplied passages and searches for HFpEF prevalence and obesity prevalence found no statement that over half of patients with heart failure have HFpEF or that roughly two-thirds of those patients have obesity; the supplied references do not establish either figure. (LLM, conf=0.70)
plaincorrelational- Asserted: passes — The authors put it forward as true.
- Checkable: passes — It can be checked against evidence.
- Load-bearing: fails — The paper’s conclusions may not depend on it.
- Based: passes — The paper gives a reason why it holds.
Probably not a substantial claim. The paper’s conclusions may not depend on it. It may state two separate claims as one.
The cited sources support only part of this claim — read each source’s verdict below.
In the paper
“Obesity-related HFpEF represents the most advanced form of cardiovascular–kidney–metabolic disease, a syndrome recognized by the American Heart Association4.”
§ Effects of tirzepatide on circulatory overload and end-organ damage in heart failure with preserved ejection fraction and obesity: a secondary analysis of the SUMMIT trial > Main
What the sources say
- Partly supportedcites [4] Ndumele, C. E. et al. Cardiovascular–kidney–metabolic health: a presidential advisory from the American Heart Association. Circulation 148, 1606–1635 (2023). sourceExperimental — accuracy not yet measured
The advisory’s “Stage 4: CVD in CKM Syndrome With and Without Kidney Failure” section places clinical heart failure in stage 4 CKM syndrome and notes a disproportionate risk of HFpEF with obesity. It does not identify obesity-related HFpEF as the single most advanced form of CKM disease; stage 4 also includes other cardiovascular diseases and distinguishes cases with kidney failure (stage 4b). Page numbers are unavailable in our copy. (LLM, conf=0.88)
plain- Asserted: passes — The authors put it forward as true.
- Checkable: passes — It can be checked against evidence.
- Load-bearing: fails — The paper’s conclusions may not depend on it.
- Based: passes — The paper gives a reason why it holds.
Probably not a substantial claim. The paper’s conclusions may not depend on it.
- Partly supported
The cited sources support only part of this claim — read each source’s verdict below.
In the paper
“Patients with HFpEF also frequently display chronic low-grade myocardial injury as reflected by elevated levels of troponin13,14, and like albuminuria, this degree of myocardial injury in HFpEF is correlated with the severity of cardiac dysfunction, hemodynamic congestion, impairment in functional capacity and risk for HF hospitalization13,14.”
§ Effects of tirzepatide on circulatory overload and end-organ damage in heart failure with preserved ejection fraction and obesity: a secondary analysis of the SUMMIT trial > Main
What the sources say
- Partly supportedcites [13] Obokata, M. et al. Myocardial injury and cardiac reserve in patients with heart failure and preserved ejection fraction. J. Am. Coll. Cardiol. 72, 29–40 (2018). sourceExperimental — accuracy not yet measured
Split into 2 atoms — 1 confirmed, 1 partially supported, 0 disputed, 0 misattributed, 0 unverifiable. Expand the claim to see per-atom verdicts.
- Partly supportedcites [14] Fudim, M. et al. High-sensitivity troponin I in hospitalized and ambulatory patients with heart failure with preserved ejection fraction: insights from the Heart Failure Clinical Research Network. J. Am. Heart Assoc. 7, e010364 (2018). sourceExperimental — accuracy not yet measured
Split into 2 atoms — 0 confirmed, 2 partially supported, 0 disputed, 0 misattributed, 0 unverifiable. Expand the claim to see per-atom verdicts.
plaincorrelational- Asserted: passes — The authors put it forward as true.
- Checkable: passes — It can be checked against evidence.
- Load-bearing: fails — The paper’s conclusions may not depend on it.
- Based: passes — The paper gives a reason why it holds.
Probably not a substantial claim. The paper’s conclusions may not depend on it. It may state two separate claims as one.
- Partly supported
Every source the paper cites for this claim was checked and supports it.
In the paper
“The magnitude of improvement in arterial compliance with dapagliflozin was correlated with the magnitude of weight loss.”
§ Effects of tirzepatide on circulatory overload and end-organ damage in heart failure with preserved ejection fraction and obesity: a secondary analysis of the SUMMIT trial > Discussion
What the sources say
- Supportedcites [25] Tada, A. et al. Dapagliflozin enhances arterial and venous compliance during exercise in heart failure with preserved ejection fraction: insights from the CAMEO-DAPA trial. Circulation 150, 997–1009 (2024). source
The Results section (‘Relationships between Vascular Effects, Body Weight, and Hemodynamics’) reports that improvements in total arterial compliance during exercise were associated with decreases in body weight on treatment. The paper describes this as a correlation, not evidence that weight loss caused the improvement. (LLM, conf=0.94)
plaincorrelational- Asserted: passes — The authors put it forward as true.
- Checkable: passes — It can be checked against evidence.
- Load-bearing: fails — The paper’s conclusions may not depend on it.
- Based: passes — The paper gives a reason why it holds.
Probably not a substantial claim. The paper’s conclusions may not depend on it.
- Supported
The cited sources support only part of this claim — read each source’s verdict below.
In the paper
“Obesity can contribute to CKD through multiple mechanisms including volume expansion (leading to glomerular hyperfiltration) and the effect of adipocytokines (leptin and aldosterone) to cause renal injury and fibrosis23,26.”
§ Effects of tirzepatide on circulatory overload and end-organ damage in heart failure with preserved ejection fraction and obesity: a secondary analysis of the SUMMIT trial > Discussion
What the sources say
- Partly supportedcites [23] Packer, M. Leptin–aldosterone–neprilysin axis: identification of its distinctive role in the pathogenesis of the three phenotypes of heart failure in people with obesity. Circulation 137, 1614–1631 (2018). sourceExperimental — accuracy not yet measured
The section on renal leptin signaling says obesity-related leptin activity promotes renal sodium retention and plasma volume expansion. The section on epicardial fat says elevated leptin can promote kidney inflammation, helping explain renal fibrosis in experimental obesity-related HFpEF, and associates high leptin with declining renal function. The paper does not establish the claimed volume-expansion-to-glomerular-hyperfiltration pathway or say that aldosterone causes renal injury and fibrosis. (LLM, conf=0.88)
- Not checked — no full text of the sourcecites [26] Yau, K., Kuah, R., Cherney, D. Z. I. & Lam, T. K. T. Obesity and the kidney: mechanistic links and therapeutic advances. Nat. Rev. Endocrinol. 20, 321–335 (2024). source
plaindirect- Asserted: passes — The authors put it forward as true.
- Checkable: passes — It can be checked against evidence.
- Load-bearing: fails — The paper’s conclusions may not depend on it.
- Based: passes — The paper gives a reason why it holds.
Probably not a substantial claim. The paper’s conclusions may not depend on it. It may state two separate claims as one.
- Partly supported
Every source the paper cites for this claim was checked and supports it.
In the paper
“Pulse pressure is inversely correlated with arterial compliance, which is frequently impaired in patients with HFpEF, where increases in aortic stiffness contribute to elevation in cardiac filling pressures, especially during exercise24.”
§ Effects of tirzepatide on circulatory overload and end-organ damage in heart failure with preserved ejection fraction and obesity: a secondary analysis of the SUMMIT trial > Discussion
What the sources say
- Supportedcites [24] Reddy, Y. N. V. et al. Arterial stiffening with exercise in patients with heart failure and preserved ejection fraction. J. Am. Coll. Cardiol. 70, 136–148 (2017). source
The Conclusions state that people with HFpEF display impaired arterial compliance reserve during exercise. The Results (Arterial Reserve With Submaximal Exercise) report lower total arterial compliance in HFpEF subjects than in controls during exercise, supporting the claim while specifying when the impairment was observed. (LLM, conf=0.91)
plain- Asserted: passes — The authors put it forward as true.
- Checkable: passes — It can be checked against evidence.
- Load-bearing: fails — The paper’s conclusions may not depend on it.
- Based: passes — The paper gives a reason why it holds.
Probably not a substantial claim. The paper’s conclusions may not depend on it.
- Supported
The cited sources support only part of this claim — read each source’s verdict below.
In the paper
“Leptin is an important determinant of the decline in eGFR in the general population, and mineralocorticoid receptor antagonists ameliorate the progression of CKD23,27.”
§ Effects of tirzepatide on circulatory overload and end-organ damage in heart failure with preserved ejection fraction and obesity: a secondary analysis of the SUMMIT trial > Discussion
What the sources say
- Partly supportedcites [23] Packer, M. Leptin–aldosterone–neprilysin axis: identification of its distinctive role in the pathogenesis of the three phenotypes of heart failure in people with obesity. Circulation 137, 1614–1631 (2018). sourceExperimental — accuracy not yet measured
The section 'Role of Epicardial Fat in the Interplay of Adipokines and Heart Failure' (page unavailable) says higher leptin levels are accompanied by faster renal-function decline, particularly in women. It discusses this in the context of obesity-related heart failure; it does not establish leptin as a determinant of eGFR decline in the general population. (LLM, conf=0.85)
- Could not verifycites [27] Vaduganathan, M. et al. Finerenone in heart failure and chronic kidney disease with type 2 diabetes: FINE-HEART pooled analysis of cardiovascular, kidney and mortality outcomes. Nat. Med. https://doi.org/10.1038/s41591-024-03264-4 (2024). sourceExperimental — accuracy not yet measured
The quoted claim concerns leptin as a determinant of eGFR decline in the general population. Our copy’s Results and Methods discuss eGFR and kidney outcomes but do not address leptin; a search for leptin and general-population eGFR decline found no relevant passage. The Results do support the separate, citation-adjacent statement that finerenone reduced kidney outcomes. (LLM, conf=0.76)
plaindirect- Asserted: passes — The authors put it forward as true.
- Checkable: passes — It can be checked against evidence.
- Load-bearing: fails — The paper’s conclusions may not depend on it.
- Based: passes — The paper gives a reason why it holds.
Probably not a substantial claim. The paper’s conclusions may not depend on it.
- Partly supported
The cited sources support only part of this claim — read each source’s verdict below.
In the paper
“Circulating troponin levels are commonly elevated in HFpEF, where they are associated with greater risk for HF hospitalization or death14.”
§ Effects of tirzepatide on circulatory overload and end-organ damage in heart failure with preserved ejection fraction and obesity: a secondary analysis of the SUMMIT trial > Discussion
What the sources say
- Partly supportedcites [14] Fudim, M. et al. High-sensitivity troponin I in hospitalized and ambulatory patients with heart failure with preserved ejection fraction: insights from the Heart Failure Clinical Research Network. J. Am. Heart Assoc. 7, e010364 (2018). sourceExperimental — accuracy not yet measured
The Conclusions report that high-sensitivity troponin I was elevated in a large majority of hospitalized HFpEF patients and more than half of ambulatory patients. The Results (Outcomes in Initially Hospitalized HFpEF; page not provided) associate higher levels with a 60-day composite of emergency-room visits, readmissions, and death. That supports an association with adverse outcomes, but the paper does not establish a separate association with HF hospitalization or death, and it assessed clinical outcomes only in the initially hospitalized cohort. (LLM, conf=0.84)
plaincorrelational- Asserted: passes — The authors put it forward as true.
- Checkable: passes — It can be checked against evidence.
- Load-bearing: fails — The paper’s conclusions may not depend on it.
- Based: passes — The paper gives a reason why it holds.
Probably not a substantial claim. The paper’s conclusions may not depend on it. It may state two separate claims as one.
- Partly supported
The cited sources support only part of this claim — read each source’s verdict below.
In the paper
“Pulse pressure is inversely correlated with arterial compliance, which is frequently impaired in patients with HFpEF, where increases in aortic stiffness contribute to elevation in cardiac filling pressures, especially during exercise24.”
§ Effects of tirzepatide on circulatory overload and end-organ damage in heart failure with preserved ejection fraction and obesity: a secondary analysis of the SUMMIT trial > Discussion
What the sources say
- Partly supportedcites [24] Reddy, Y. N. V. et al. Arterial stiffening with exercise in patients with heart failure and preserved ejection fraction. J. Am. Coll. Cardiol. 70, 136–148 (2017). sourceExperimental — accuracy not yet measured
The Discussion section reports that arterial stiffening in HFpEF was associated with abnormal hemodynamics, including filling pressures measured during exercise, and argues that it likely plays an important role. It also explicitly says the study cannot prove causality, so the claim that stiffness contributes to elevated filling pressures is stronger than the evidence establishes. Page numbers were not provided in our copy. (LLM, conf=0.87)
plaindirect- Asserted: passes — The authors put it forward as true.
- Checkable: passes — It can be checked against evidence.
- Load-bearing: passes — The paper’s conclusions depend on it.
- Based: passes — The paper gives a reason why it holds.
Probably not a substantial claim.
- Partly supported
The cited sources support only part of this claim — read each source’s verdict below.
In the paper
“Obesity-related HFpEF is the most common phenotype of this disorder3,9, and its emergence is causally related to the growing burden of cardiovascular–kidney–metabolic disorders observed worldwide4.”
§ Effects of tirzepatide on circulatory overload and end-organ damage in heart failure with preserved ejection fraction and obesity: a secondary analysis of the SUMMIT trial > Discussion
What the sources say
- Partly supportedcites [3] Borlaug, B. A. et al. Obesity and heart failure with preserved ejection fraction: new insights and pathophysiological targets. Cardiovasc. Res. 118, 3434–3450 (2023). sourceExperimental — accuracy not yet measured
The citation to this source is attached to the first clause, not the later claim about cardiovascular–kidney–metabolic disorders. The Abstract says many patients with HFpEF are overweight or obese, and the Conclusion calls obesity one of the most important causes of HFpEF. Neither passage establishes that obesity-related HFpEF is the most common phenotype. (LLM, conf=0.81)
- Partly supportedcites [9] Morgen, C. S. et al. Obesity, cardiorenal comorbidities, and risk of hospitalization in patients with heart failure with preserved ejection fraction. Mayo Clin. Proc. 98, 1458–1468 (2023). sourceExperimental — accuracy not yet measured
The Results report obesity in 57.8% of patients with HFpEF who had BMI data, supporting that obesity-related HFpEF was common in this US dataset. The paper does not establish that it is the most common phenotype worldwide. The causal claim is attached to a different citation in the citing sentence and is not judged here. (LLM, conf=0.82)
- Partly supportedcites [4] Ndumele, C. E. et al. Cardiovascular–kidney–metabolic health: a presidential advisory from the American Heart Association. Circulation 148, 1606–1635 (2023). sourceExperimental — accuracy not yet measured
The Stage 4 CKM section says obesity and physical inactivity are associated with a disproportionate risk of HFpEF, and the CKM overview links CKM syndrome to heart failure. Those passages support a relationship, but do not establish that the emergence of obesity-related HFpEF is caused by a growing worldwide burden of CKM disorders. The separate 'most common phenotype' clause is attached to other citations, not this source. (LLM, conf=0.82)
plaindirect- Asserted: passes — The authors put it forward as true.
- Checkable: passes — It can be checked against evidence.
- Load-bearing: unclear — It is unclear whether the paper’s conclusions depend on it.
- Based: passes — The paper gives a reason why it holds.
It may state two separate claims as one.
- Partly supported
The sources with a verdict support this claim; the rest weren’t checked yet, have no full text we could read, or their verdicts aren’t rated yet.
In the paper
“The latter is notable because weight loss in the absence of HF leads to increases in NT-proBNP32,33.”
§ Effects of tirzepatide on circulatory overload and end-organ damage in heart failure with preserved ejection fraction and obesity: a secondary analysis of the SUMMIT trial > Discussion
What the sources say
- Not checked — no full text of the sourcecites [32] Abrahamsson, N., Engstrom, B. E., Sundbom, M. & Karlsson, F. A. Gastric bypass surgery elevates NT-ProBNP levels. Obes. Surg. 23, 1421–1426 (2013). source
- Supportedcites [33] Kistorp, C., Bliddal, H., Goetze, J. P., Christensen, R. & Faber, J. Cardiac natriuretic peptides in plasma increase after dietary induced weight loss in obesity. BMC Obes. 1, 24 (2014). source
The Discussion reports that NT-proBNP increased after substantial diet-induced weight loss in obese subjects without heart disease. It also states that participants had no heart-disease symptoms and their baseline NT-proBNP levels were below the recommended heart-failure cutoff. (LLM, conf=0.92)
plaindirect- Asserted: passes — The authors put it forward as true.
- Checkable: passes — It can be checked against evidence.
- Load-bearing: passes — The paper’s conclusions depend on it.
- Based: passes — The paper gives a reason why it holds.
Probably not a substantial claim.
The cited sources support only part of this claim — read each source’s verdict below.
In the paper
“Treatment with the sodium–glucose cotransporter 2 inhibitor dapagliflozin was recently shown to reduce aortic stiffness, systolic BP and pulse pressure during exercise after just 24 weeks, and these changes were correlated with reductions in left ventricular filling pressures25.”
§ Effects of tirzepatide on circulatory overload and end-organ damage in heart failure with preserved ejection fraction and obesity: a secondary analysis of the SUMMIT trial > Discussion
What the sources say
- Partly supportedcites [25] Tada, A. et al. Dapagliflozin enhances arterial and venous compliance during exercise in heart failure with preserved ejection fraction: insights from the CAMEO-DAPA trial. Circulation 150, 997–1009 (2024). sourceExperimental — accuracy not yet measured
The Results report lower exercise systolic BP, pulse pressure, and proximal aortic characteristic impedance after dapagliflozin treatment; the Discussion interprets the impedance change as likely reduced aortic wall stiffness. The Discussion and Abstract report that the reduction in exercise systolic BP correlated with reduced pulmonary capillary wedge pressure, a measure of left ventricular filling pressure. Our copy does not report that the stiffness and pulse-pressure changes themselves correlated with filling-pressure reductions, as “these changes” suggests. (LLM, conf=0.84)
plaindirect- Asserted: passes — The authors put it forward as true.
- Checkable: passes — It can be checked against evidence.
- Load-bearing: fails — The paper’s conclusions may not depend on it.
- Based: passes — The paper gives a reason why it holds.
Probably not a substantial claim. The paper’s conclusions may not depend on it. It may state two separate claims as one.
- Partly supported
The cited sources support only part of this claim — read each source’s verdict below.
In the paper
“Leptin is an important determinant of the decline in eGFR in the general population, and mineralocorticoid receptor antagonists ameliorate the progression of CKD23,27.”
§ Effects of tirzepatide on circulatory overload and end-organ damage in heart failure with preserved ejection fraction and obesity: a secondary analysis of the SUMMIT trial > Discussion
What the sources say
- Could not verifycites [23] Packer, M. Leptin–aldosterone–neprilysin axis: identification of its distinctive role in the pathogenesis of the three phenotypes of heart failure in people with obesity. Circulation 137, 1614–1631 (2018). sourceExperimental — accuracy not yet measured
The References section lists mineralocorticoid receptor antagonism for cardiac diastolic dysfunction and spironolactone studies in heart failure, but those entries do not address CKD progression. Searches for CKD progression, chronic kidney disease, and renal effects of mineralocorticoid receptor antagonists found no passage stating that these drugs ameliorate CKD progression. (LLM, conf=0.72)
- Partly supportedcites [27] Vaduganathan, M. et al. Finerenone in heart failure and chronic kidney disease with type 2 diabetes: FINE-HEART pooled analysis of cardiovascular, kidney and mortality outcomes. Nat. Med. https://doi.org/10.1038/s41591-024-03264-4 (2024). sourceExperimental — accuracy not yet measured
The Results and Discussion (page unavailable) report that finerenone, a mineralocorticoid receptor antagonist, reduced a kidney composite outcome by about 20%, with benefits driven by trials in people with CKD and type 2 diabetes. This supports a benefit for finerenone in that population, but the paper does not establish that mineralocorticoid receptor antagonists as a class slow CKD progression generally. (LLM, conf=0.87)
plaindirect- Asserted: passes — The authors put it forward as true.
- Checkable: passes — It can be checked against evidence.
- Load-bearing: fails — The paper’s conclusions may not depend on it.
- Based: passes — The paper gives a reason why it holds.
Probably not a substantial claim. The paper’s conclusions may not depend on it.
- Could not verify
The cited sources support only part of this claim — read each source’s verdict below.
In the paper
“As compared with nonobese HFpEF, patients with obesity-related HFpEF display distinct pathophysiologic features, including greater volume expansion5,17, more severe inflammation6,7, increases in visceral and paracardiac adipose tissue5,15,18,19 and more severe myocardial injury15.”
§ Effects of tirzepatide on circulatory overload and end-organ damage in heart failure with preserved ejection fraction and obesity: a secondary analysis of the SUMMIT trial > Discussion
What the sources say
- Partly supportedcites [5] Obokata, M., Reddy, Y. N., Pislaru, S. V., Melenovsky, V. & Borlaug, B. A. Evidence supporting the existence of a distinct obese phenotype of heart failure with preserved ejection fraction. Circulation 136, 6–19 (2017). sourceExperimental — accuracy not yet measured
The Discussion reports greater estimated plasma volume in obese than nonobese HFpEF, and the Results report greater epicardial fat thickness, supporting volume expansion and increased fat around the heart. This paper does not establish an increase in visceral adipose tissue. In the printed sentence, the inflammation and myocardial-injury assertions are attached to other citations, not this one. (LLM, conf=0.85)
- Not checked — no full text of the sourcecites [17] Miller, W. L. & Borlaug, B. A. Impact of obesity on volume status in patients with ambulatory chronic heart failure. J. Card. Fail. 26, 112–117 (2020). source
- Not checked — no full text of the sourcecites [6] Reddy, Y. N. V. et al. Characterization of the obese phenotype of heart failure with preserved ejection fraction: a RELAX trial ancillary study. Mayo Clin. Proc. 94, 1199–1209 (2019). source
- Supportedcites [7] Alogna, A. et al. Interleukin-6 in patients with heart failure and preserved ejection fraction. JACC Heart Fail. 11, 1549–1561 (2023). source
The source describes obesity-related HFpEF as a distinct phenotype with greater inflammation, qualified as reflected by CRP levels (introductory passage under Abstract > Conclusions; page not provided). Its Discussion section, “IL-6 and Obesity in HFpEF,” also reports higher IL-6 levels in patients with greater body fat. This supports the inflammation portion of the citing sentence, to which this citation is attached. (LLM, conf=0.91)
- Partly supportedcites [15] Obokata, M. et al. Uncoupling between intravascular and distending pressures leads to underestimation of circulatory congestion in obesity. Eur. J. Heart Fail. 24, 353–361 (2022). sourceExperimental — accuracy not yet measured
The “Mechanism for underestimation of filling pressures in obesity” section says obesity may increase external cardiac pressure partly through plasma volume retention, which supports the volume-expansion point attached to this citation. It does not directly establish greater blood volume in obesity-related versus nonobese HFpEF: the study compared patients with and without severe obesity who had unexplained dyspnoea, not exclusively patients with HFpEF. The other listed features have separate citations in the citing sentence. (LLM, conf=0.82)
- Partly supportedcites [18] Koepp, K. E., Obokata, M., Reddy, Y. N. V., Olson, T. P. & Borlaug, B. A. Hemodynamic and functional impact of epicardial adipose tissue in heart failure with preserved ejection fraction. JACC Heart Fail. 8, 657–666 (2020). sourceExperimental — accuracy not yet measured
In the Discussion section “Obesity, Epicardial Fat, and HFpEF” (page not provided), the paper reports increased epicardial adipose tissue in obesity-related HFpEF compared with nonobese HFpEF and links epicardial fat to visceral fat content. It does not establish the cited increase in paracardiac adipose tissue, which is distinct from the epicardial tissue studied here. (LLM, conf=0.84)
- Partly supportedcites [19] Sorimachi, H. et al. Pathophysiologic importance of visceral adipose tissue in women with heart failure and preserved ejection fraction. Eur. Heart J. 42, 1595–1605 (2021). sourceExperimental — accuracy not yet measured
The Sex-stratified differences in fat distribution section reports greater visceral adipose tissue in women with HFpEF than in BMI-matched women without heart failure. That is not a comparison of obesity-related with nonobese HFpEF. The Subject characteristics section says epicardial fat thickness was similar between groups, and the passages found do not establish more severe myocardial injury. (LLM, conf=0.87)
plaincorrelational- Asserted: passes — The authors put it forward as true.
- Checkable: passes — It can be checked against evidence.
- Load-bearing: passes — The paper’s conclusions depend on it.
- Based: passes — The paper gives a reason why it holds.
It may state two separate claims as one.
- Partly supported
Every source the paper cites for this claim was checked and supports it.
In the paper
“This may relate in part to myocardial benefits, as noted above, or potentially improvements in skeletal muscle function and peripheral oxygen uptake, which are more dramatically impaired in patients with HFpEF and more severe inflammation35.”
§ Effects of tirzepatide on circulatory overload and end-organ damage in heart failure with preserved ejection fraction and obesity: a secondary analysis of the SUMMIT trial > Discussion
What the sources say
- Supportedcites [35] Tada, A. et al. Autoimmune disorders in heart failure with preserved ejection fraction. JACC Heart Fail. 12, 1257–1269 (2024). source
Split into 2 atoms — 2 confirmed, 0 partially supported, 0 disputed, 0 misattributed, 0 unverifiable. Expand the claim to see per-atom verdicts.
hedgedconditional- Asserted: passes — The authors put it forward as true.
- Checkable: passes — It can be checked against evidence.
- Load-bearing: fails — The paper’s conclusions may not depend on it.
- Based: passes — The paper gives a reason why it holds.
Probably not a substantial claim. The paper’s conclusions may not depend on it. It may state two separate claims as one.
- Supported
The cited sources that could be checked couldn’t confirm or dispute this claim.
In the paper
“The major limitation of this analysis centers on the fact that we estimated PV using a weight-based formula (the Kaplan–Hakim equation)36, and according to this formula, the weight loss produced by tirzepatide would be mathematically expected to reduce PV.”
§ Effects of tirzepatide on circulatory overload and end-organ damage in heart failure with preserved ejection fraction and obesity: a secondary analysis of the SUMMIT trial > Discussion
What the sources say
- Could not verifycites [36] Ling, H. Z. et al. Calculated plasma volume status and prognosis in chronic heart failure. Eur. J. Heart Fail. 17, 35–43 (2015). sourceExperimental — accuracy not yet measured
The available passage labelled Abstract says plasma volume status was calculated from clinical indices, but it does not identify a weight-based Kaplan–Hakim equation. Searches for Kaplan–Hakim, body weight, and the formula found no passage establishing that detail. The tirzepatide inference is the citing authors’ own, rather than a finding attributed to this source. (LLM, conf=0.72)
hedgeddirect- Asserted: passes — The authors put it forward as true.
- Checkable: passes — It can be checked against evidence.
- Load-bearing: passes — The paper’s conclusions depend on it.
- Based: passes — The paper gives a reason why it holds.
It may state two separate claims as one.
- Could not verify
The cited sources support only part of this claim — read each source’s verdict below.
In the paper
“Sensitivity analyses were also performed using eGFR calculated determined using the 2021 creatinine-based CKD-EPI formula43, and separately using the combined creatinine-cystatin C CKD-EPI formula (Supplementary Appendix 2)19.”
§ Effects of tirzepatide on circulatory overload and end-organ damage in heart failure with preserved ejection fraction and obesity: a secondary analysis of the SUMMIT trial > Methods > Study procedures
What the sources say
- Supportedcites [43] Inker, L. A. et al. New creatinine- and cystatin C-based equations to estimate GFR without race. N. Engl. J. Med 385, 1737–1749 (2021). source
The citation to this paper is attached to the combined creatinine–cystatin C CKD-EPI formula, not to the citing authors’ sensitivity analyses. The Methods and Discussion (page not available in our copy) identify and evaluate the paper’s new eGFRcr-cys equations, supporting that identification. (LLM, conf=0.92)
- Could not verifycites [19] Sorimachi, H. et al. Pathophysiologic importance of visceral adipose tissue in women with heart failure and preserved ejection fraction. Eur. Heart J. 42, 1595–1605 (2021). sourceExperimental — accuracy not yet measured
The cited paper’s baseline-characteristics table (labeled Conclusions; page unavailable) reports estimated GFR, but does not identify the formula used. Searches for the combined creatinine–cystatin C CKD-EPI formula and cystatin C sensitivity analyses found no passage addressing them. The 2021 creatinine-based formula has a separate citation in the citing sentence. (LLM, conf=0.74)
plain- Asserted: passes — The authors put it forward as true.
- Checkable: passes — It can be checked against evidence.
- Load-bearing: fails — The paper’s conclusions may not depend on it.
- Based: passes — The paper gives a reason why it holds.
Probably not a substantial claim. The paper’s conclusions may not depend on it.
- Supported
Every source the paper cites for this claim was checked and supports it.
In the paper
“Patients with HFpEF and elevated troponin have more severe elevation in filling pressures, reduced myocardial stress reserve and poorer exercise capacity compared with those without injury13, and individuals with the obesity phenotype have higher troponin levels than those without obesity15.”
§ Effects of tirzepatide on circulatory overload and end-organ damage in heart failure with preserved ejection fraction and obesity: a secondary analysis of the SUMMIT trial > Discussion
What the sources say
- Supportedcites [15] Obokata, M. et al. Uncoupling between intravascular and distending pressures leads to underestimation of circulatory congestion in obesity. Eur. J. Heart Fail. 24, 353–361 (2022). source
The Subject characteristics section reports higher troponin T levels in Group B. Table 2 identifies Group B as BMI ≥35 kg/m² and Group A as BMI <35 kg/m², with high-sensitivity troponin T levels of 12.4 versus 7.9 ng/L (p=0.04). Biomarkers were measured in a subset of 58 participants. (LLM, conf=0.94)
plaincorrelational- Asserted: passes — The authors put it forward as true.
- Checkable: passes — It can be checked against evidence.
- Load-bearing: fails — The paper’s conclusions may not depend on it.
- Based: passes — The paper gives a reason why it holds.
Probably not a substantial claim. The paper’s conclusions may not depend on it.
- Supported
The cited sources support only part of this claim — read each source’s verdict below.
In the paper
“The low-grade myocardial injury in HFpEF as observed at baseline in SUMMIT is believed to be related to cardiomyocyte loss due to repetitive elevations in cardiac filling pressures during stress, along with adverse loading conditions caused by ventricular–vascular stiffening13,34.”
§ Effects of tirzepatide on circulatory overload and end-organ damage in heart failure with preserved ejection fraction and obesity: a secondary analysis of the SUMMIT trial > Discussion
What the sources say
- Partly supportedcites [13] Obokata, M. et al. Myocardial injury and cardiac reserve in patients with heart failure and preserved ejection fraction. J. Am. Coll. Cardiol. 72, 29–40 (2018). sourceExperimental — accuracy not yet measured
Split into 2 atoms — 0 confirmed, 2 partially supported, 0 disputed, 0 misattributed, 0 unverifiable. Expand the claim to see per-atom verdicts.
- Partly supportedcites [34] Canty, J. M. Jr. Myocardial injury, troponin release, and cardiomyocyte death in brief ischemia, failure, and ventricular remodeling. Am. J. Physiol. Heart Circ. Physiol. 323, H1–H15 (2022). sourceExperimental — accuracy not yet measured
Split into 2 atoms — 0 confirmed, 2 partially supported, 0 disputed, 0 misattributed, 0 unverifiable. Expand the claim to see per-atom verdicts.
hedgedconditional- Asserted: passes — The authors put it forward as true.
- Checkable: passes — It can be checked against evidence.
- Load-bearing: fails — The paper’s conclusions may not depend on it.
- Based: passes — The paper gives a reason why it holds.
Probably not a substantial claim. The paper’s conclusions may not depend on it.
- Partly supported
Every source the paper cites for this claim was checked and supports it.
In the paper
“Reductions in body weight with tirzepatide would be expected to reduce skeletal muscle to some extent, which could influence creatinine dependent of changes in kidney function, and for this reason, we calculated eGFR using cystatin C in place of creatinine.”
- Also stated in: § Study procedures · hedged
“Because weight loss with tirzepatide is expected to reduce both fat and skeletal muscle mass, creatinine could be less accurate as a measure of kidney function. Therefore, for the primary analysis, eGFR was calculated from cystatin C level alone, using the 2012 chronic kidney disease-epidemiology (CKD-EPI) cystatin C formula, at baseline and 12, 24 and 52 weeks42.”
§ Effects of tirzepatide on circulatory overload and end-organ damage in heart failure with preserved ejection fraction and obesity: a secondary analysis of the SUMMIT trial > Discussion
What the sources say
- Supportedcites [42] Inker, L. A. et al. Estimating glomerular filtration rate from serum creatinine and cystatin C. N. Engl. J. Med. 367, 20–29 (2012). source
The Discussion states that cystatin C is less affected by muscle mass than creatinine and discusses its use for estimating GFR in patients with muscle wasting. That supports the cited rationale for using cystatin C when a change in skeletal muscle could affect creatinine independently of kidney function. (LLM, conf=0.88)
hedgedconditional- Asserted: passes — The authors put it forward as true.
- Checkable: passes — It can be checked against evidence.
- Load-bearing: passes — The paper’s conclusions depend on it.
- Based: passes — The paper gives a reason why it holds.
It may state two separate claims as one.
- Also stated in: § Study procedures · hedged
Every source the paper cites for this claim was checked and supports it.
In the paper
“Patients with HFpEF and elevated troponin have more severe elevation in filling pressures, reduced myocardial stress reserve and poorer exercise capacity compared with those without injury13, and individuals with the obesity phenotype have higher troponin levels than those without obesity15.”
§ Effects of tirzepatide on circulatory overload and end-organ damage in heart failure with preserved ejection fraction and obesity: a secondary analysis of the SUMMIT trial > Discussion
What the sources say
- Supportedcites [13] Obokata, M. et al. Myocardial injury and cardiac reserve in patients with heart failure and preserved ejection fraction. J. Am. Coll. Cardiol. 72, 29–40 (2018). source
The Results section reports that HFpEF patients with abnormal troponin had poorer exercise measures of myocardial reserve than those with normal troponin. It also reports associations between higher troponin, higher filling pressures, and reduced peak aerobic capacity. Page numbers are unavailable in our copy. (LLM, conf=0.91)
plaincorrelational- Asserted: passes — The authors put it forward as true.
- Checkable: passes — It can be checked against evidence.
- Load-bearing: fails — The paper’s conclusions may not depend on it.
- Based: passes — The paper gives a reason why it holds.
Probably not a substantial claim. The paper’s conclusions may not depend on it. It may state two separate claims as one.
- Supported
A result the paper reports from its own data — it cites no other source for it, so there is none to check. The quote shows it is in the paper.
In the paper
“Tirzepatide reduced systemic inflammation as measured by high-sensitivity CRP at 24 weeks and to greater extent at 52 weeks, but with no significant effect at 12 weeks (Table 3 and Fig. 2a).”
§ Effects of tirzepatide on circulatory overload and end-organ damage in heart failure with preserved ejection fraction and obesity: a secondary analysis of the SUMMIT trial > Results > Tirzepatide effects on hemodynamic load and inflammation
plaindirect- Asserted: passes — The authors put it forward as true.
- Checkable: passes — It can be checked against evidence.
- Load-bearing: unclear — It is unclear whether the paper’s conclusions depend on it.
- Based: passes — The paper gives a reason why it holds.
It may state two separate claims as one.
A result the paper reports from its own data — it cites no other source for it, so there is none to check. The quote shows it is in the paper.
In the paper
“As compared with placebo, treatment with tirzepatide reduced systolic blood pressure (BP), an effect that was evident after 4 weeks, with a progressive decline up to 24 weeks, which was maintained after 52 weeks (Table 3 and Fig. 1a).”
§ Effects of tirzepatide on circulatory overload and end-organ damage in heart failure with preserved ejection fraction and obesity: a secondary analysis of the SUMMIT trial > Results > Tirzepatide effects on hemodynamic load and inflammation
plaindirect- Asserted: passes — The authors put it forward as true.
- Checkable: passes — It can be checked against evidence.
- Load-bearing: passes — The paper’s conclusions depend on it.
- Based: passes — The paper gives a reason why it holds.
It may state two separate claims as one.
A result the paper reports from its own data — it cites no other source for it, so there is none to check. The quote shows it is in the paper.
In the paper
“Participants displayed typical characteristics of obesity-related HFpEF, with mean body mass index (BMI) exceeding 38 kg m−2, increased waist circumference and high prevalence of comorbidities including coronary disease and atrial fibrillation, with no baseline differences in those randomized to tirzepatide or placebo (Table 1).”
§ Effects of tirzepatide on circulatory overload and end-organ damage in heart failure with preserved ejection fraction and obesity: a secondary analysis of the SUMMIT trial > Results > Patient characteristics
plainn = 731- Asserted: passes — The authors put it forward as true.
- Checkable: passes — It can be checked against evidence.
- Load-bearing: unclear — It is unclear whether the paper’s conclusions depend on it.
- Based: passes — The paper gives a reason why it holds.
It may state two separate claims as one.
A result the paper reports from its own data — it cites no other source for it, so there is none to check. The quote shows it is in the paper.
In the paper
“In contrast, the effects on diastolic BP were minimal and not statistically significant at 24 or 52 weeks of treatment.”
§ Effects of tirzepatide on circulatory overload and end-organ damage in heart failure with preserved ejection fraction and obesity: a secondary analysis of the SUMMIT trial > Results > Tirzepatide effects on hemodynamic load and inflammation
plain- Asserted: passes — The authors put it forward as true.
- Checkable: passes — It can be checked against evidence.
- Load-bearing: unclear — It is unclear whether the paper’s conclusions depend on it.
- Based: passes — The paper gives a reason why it holds.
It may state two separate claims as one.
A result the paper reports from its own data — it cites no other source for it, so there is none to check. The quote shows it is in the paper.
In the paper
“and nearly half the participants had experienced a hospitalization or urgent care visit for worsening HF in the preceding 12 months.”
§ Effects of tirzepatide on circulatory overload and end-organ damage in heart failure with preserved ejection fraction and obesity: a secondary analysis of the SUMMIT trial > Results > Patient characteristics
plainn = 731- Asserted: passes — The authors put it forward as true.
- Checkable: passes — It can be checked against evidence.
- Load-bearing: fails — The paper’s conclusions may not depend on it.
- Based: passes — The paper gives a reason why it holds.
Probably not a substantial claim. The paper’s conclusions may not depend on it.
A result the paper reports from its own data — it cites no other source for it, so there is none to check. The quote shows it is in the paper.
In the paper
“Patients with HFpEF also displayed systemic inflammation, with median C-reactive protein (CRP) of 3.2 mg l−1, and 66% had elevated CRP (>2.0 mg l−1).”
§ Effects of tirzepatide on circulatory overload and end-organ damage in heart failure with preserved ejection fraction and obesity: a secondary analysis of the SUMMIT trial > Results > Patient characteristics
plain- Asserted: passes — The authors put it forward as true.
- Checkable: passes — It can be checked against evidence.
- Load-bearing: unclear — It is unclear whether the paper’s conclusions depend on it.
- Based: passes — The paper gives a reason why it holds.
It may state two separate claims as one.
A result the paper reports from its own data — it cites no other source for it, so there is none to check. The quote shows it is in the paper.
In the paper
“Participants displayed borderline hypertension at baseline, with increased estimated BV and plasma volume (PV) in keeping with the diagnosis of obesity-related HFpEF (Table 2).”
§ Effects of tirzepatide on circulatory overload and end-organ damage in heart failure with preserved ejection fraction and obesity: a secondary analysis of the SUMMIT trial > Results > Patient characteristics
plaincorrelational- Asserted: passes — The authors put it forward as true.
- Checkable: passes — It can be checked against evidence.
- Load-bearing: unclear — It is unclear whether the paper’s conclusions depend on it.
- Based: passes — The paper gives a reason why it holds.
It may state two separate claims as one.
A result the paper reports from its own data — it cites no other source for it, so there is none to check. The quote shows it is in the paper.
In the paper
“but using the creatinine-based formulas, there was a statistically significant decrease in eGFR versus placebo at 12 weeks, which again reversed by 52 weeks, showing an improvement in eGFR with tirzepatide across all estimates (Extended Data Table 1).”
§ Effects of tirzepatide on circulatory overload and end-organ damage in heart failure with preserved ejection fraction and obesity: a secondary analysis of the SUMMIT trial > Results > Effects of tirzepatide on cardiac injury and kidney function
plaindirect- Asserted: passes — The authors put it forward as true.
- Checkable: passes — It can be checked against evidence.
- Load-bearing: unclear — It is unclear whether the paper’s conclusions depend on it.
- Based: passes — The paper gives a reason why it holds.
It may state two separate claims as one.
A result the paper reports from its own data — it cites no other source for it, so there is none to check. The quote shows it is in the paper.
In the paper
“Kidney dysfunction was common, with a baseline mean estimated glomerular filtration rate (eGFR) of 55.3 ml min−1 1.73 m−2.”
§ Effects of tirzepatide on circulatory overload and end-organ damage in heart failure with preserved ejection fraction and obesity: a secondary analysis of the SUMMIT trial > Results > Patient characteristics
plain- Asserted: passes — The authors put it forward as true.
- Checkable: passes — It can be checked against evidence.
- Load-bearing: fails — The paper’s conclusions may not depend on it.
- Based: passes — The paper gives a reason why it holds.
Probably not a substantial claim. The paper’s conclusions may not depend on it. It may state two separate claims as one.
A result the paper reports from its own data — it cites no other source for it, so there is none to check. The quote shows it is in the paper.
In the paper
“Here, we show that tirzepatide reduced circulatory volume expansion using estimates of BV and PV, an effect that was evident after just 12 weeks of treatment and that further increased at 24 and 52 weeks.”
§ Effects of tirzepatide on circulatory overload and end-organ damage in heart failure with preserved ejection fraction and obesity: a secondary analysis of the SUMMIT trial > Discussion
boosteddirect- Asserted: passes — The authors put it forward as true.
- Checkable: passes — It can be checked against evidence.
- Load-bearing: passes — The paper’s conclusions depend on it.
- Based: passes — The paper gives a reason why it holds.
It may state two separate claims as one.
A result the paper reports from its own data — it cites no other source for it, so there is none to check. The quote shows it is in the paper.
In the paper
“Over half of the participants had stage 3 or greater CKD, over one-quarter had microalbuminuria and a smaller proportion had macroalbuminuria.”
§ Effects of tirzepatide on circulatory overload and end-organ damage in heart failure with preserved ejection fraction and obesity: a secondary analysis of the SUMMIT trial > Results > Patient characteristics
plain- Asserted: passes — The authors put it forward as true.
- Checkable: passes — It can be checked against evidence.
- Load-bearing: fails — The paper’s conclusions may not depend on it.
- Based: passes — The paper gives a reason why it holds.
Probably not a substantial claim. The paper’s conclusions may not depend on it. It may state two separate claims as one.
A conclusion the paper draws from its own results — it cites no other source for it, so there is none to check. The quote shows it is in the paper.
In the paper
“These effects were observed early and were sustained with longer duration of treatment.”
§ Effects of tirzepatide on circulatory overload and end-organ damage in heart failure with preserved ejection fraction and obesity: a secondary analysis of the SUMMIT trial > Discussion
plaindirect- Asserted: passes — The authors put it forward as true.
- Checkable: passes — It can be checked against evidence.
- Load-bearing: passes — The paper’s conclusions depend on it.
- Based: passes — The paper gives a reason why it holds.
It may state two separate claims as one.
In the paper
“In the SUMMIT trial, tirzepatide reduced the combined risk of cardiovascular death or worsening HF, and improved health status and exercise tolerance in patients with obesity-related HFpEF16.”
§ Effects of tirzepatide on circulatory overload and end-organ damage in heart failure with preserved ejection fraction and obesity: a secondary analysis of the SUMMIT trial > Discussion
What the sources say
- Not matchedcites [16] Packer, M. et al. Tirzepatide for heart failure with preserved ejection fraction and obesity. N. Engl. J. Med. (in the press).
Couldn’t be matched to a paper in Crossref, so it can’t be checked.
plaindirect- Asserted: passes — The authors put it forward as true.
- Checkable: passes — It can be checked against evidence.
- Load-bearing: passes — The paper’s conclusions depend on it.
- Based: passes — The paper gives a reason why it holds.
It may state two separate claims as one.
- Not matched
What the paper did — it cites no source for this, so there is none to check. The quote shows it is in the paper.
In the paper
“P values are two-sided for each time point comparison based upon comparing the least-squares means calculated from a mixed-model repeated-measures model incorporating baseline value, history of HF decompensation within 12 months, diabetes status, baseline BMI group (<35, ≥35 kg m−2), treatment assignment, time, and treatment × time interaction.”
§ Effects of tirzepatide on circulatory overload and end-organ damage in heart failure with preserved ejection fraction and obesity: a secondary analysis of the SUMMIT trial > Results > Tirzepatide effects on hemodynamic load and inflammation
plain- Asserted: passes — The authors put it forward as true.
- Checkable: passes — It can be checked against evidence.
- Load-bearing: fails — The paper’s conclusions may not depend on it.
- Based: passes — The paper gives a reason why it holds.
Probably not a substantial claim. The paper’s conclusions may not depend on it.
What the paper did — it cites no source for this, so there is none to check. The quote shows it is in the paper.
In the paper
“No correction was made for multiple hypothesis testing.”
§ Effects of tirzepatide on circulatory overload and end-organ damage in heart failure with preserved ejection fraction and obesity: a secondary analysis of the SUMMIT trial > Results > Tirzepatide effects on hemodynamic load and inflammation
plain- Asserted: passes — The authors put it forward as true.
- Checkable: passes — It can be checked against evidence.
- Load-bearing: fails — The paper’s conclusions may not depend on it.
- Based: passes — The paper gives a reason why it holds.
Probably not a substantial claim. The paper’s conclusions may not depend on it.
A conclusion the paper draws from its own results — it cites no other source for it, so there is none to check. The quote shows it is in the paper.
In the paper
“Tirzepatide reduced myocardial injury compared with placebo, reflected by a significant decrease in troponin T, along with a reduction in NT-proBNP.”
§ Effects of tirzepatide on circulatory overload and end-organ damage in heart failure with preserved ejection fraction and obesity: a secondary analysis of the SUMMIT trial > Discussion
plaindirect- Asserted: passes — The authors put it forward as true.
- Checkable: passes — It can be checked against evidence.
- Load-bearing: passes — The paper’s conclusions depend on it.
- Based: passes — The paper gives a reason why it holds.
It may state two separate claims as one.
A conclusion the paper draws from its own results — it cites no other source for it, so there is none to check. The quote shows it is in the paper.
In the paper
“In this mechanistic analysis of the SUMMIT trial, we found that, compared with placebo, treatment with the long-acting glucose-dependent insulinotropic polypeptide receptor and glucagon-like peptide-1 receptor agonist tirzepatide reduced BP and estimates of circulatory volume expansion in patients with obesity-related HFpEF.”
§ Effects of tirzepatide on circulatory overload and end-organ damage in heart failure with preserved ejection fraction and obesity: a secondary analysis of the SUMMIT trial > Discussion
plaindirect- Asserted: passes — The authors put it forward as true.
- Checkable: passes — It can be checked against evidence.
- Load-bearing: passes — The paper’s conclusions depend on it.
- Based: passes — The paper gives a reason why it holds.
It may state two separate claims as one.
A conclusion the paper draws from its own results — it cites no other source for it, so there is none to check. The quote shows it is in the paper.
In the paper
“Tirzepatide reduced systemic inflammation, but this effect was observed later than the hemodynamic effects.”
§ Effects of tirzepatide on circulatory overload and end-organ damage in heart failure with preserved ejection fraction and obesity: a secondary analysis of the SUMMIT trial > Discussion
plaindirect- Asserted: passes — The authors put it forward as true.
- Checkable: passes — It can be checked against evidence.
- Load-bearing: passes — The paper’s conclusions depend on it.
- Based: passes — The paper gives a reason why it holds.
It may state two separate claims as one.
A conclusion the paper draws from its own results — it cites no other source for it, so there is none to check. The quote shows it is in the paper.
In the paper
“Conversely, decreases in systemic inflammation with tirzepatide were correlated with reductions in cardiac injury with tirzepatide, along with a modest correlation with improvements in 6MWD.”
§ Effects of tirzepatide on circulatory overload and end-organ damage in heart failure with preserved ejection fraction and obesity: a secondary analysis of the SUMMIT trial > Discussion
plaincorrelational- Asserted: passes — The authors put it forward as true.
- Checkable: passes — It can be checked against evidence.
- Load-bearing: passes — The paper’s conclusions depend on it.
- Based: passes — The paper gives a reason why it holds.
It may state two separate claims as one.
A conclusion the paper draws from its own results — it cites no other source for it, so there is none to check. The quote shows it is in the paper.
In the paper
“Tirzepatide resulted in an early trend to reduction in eGFR at 12 weeks, but this was followed by an improvement in eGFR compared with placebo with longer duration treatment, and reduction in microalbuminuria.”
§ Effects of tirzepatide on circulatory overload and end-organ damage in heart failure with preserved ejection fraction and obesity: a secondary analysis of the SUMMIT trial > Discussion
plaindirect- Asserted: passes — The authors put it forward as true.
- Checkable: passes — It can be checked against evidence.
- Load-bearing: passes — The paper’s conclusions depend on it.
- Based: passes — The paper gives a reason why it holds.
It may state two separate claims as one.
A conclusion the paper draws from its own results — it cites no other source for it, so there is none to check. The quote shows it is in the paper.
In the paper
“In conclusion, tirzepatide reduced circulatory volume–pressure overload and systemic inflammation and mitigated cardiovascular–kidney end-organ injury in patients with HFpEF and obesity, providing new insights into the mechanisms of benefit from tirzepatide.”
§ Effects of tirzepatide on circulatory overload and end-organ damage in heart failure with preserved ejection fraction and obesity: a secondary analysis of the SUMMIT trial > Abstract
plaindirect- Asserted: passes — The authors put it forward as true.
- Checkable: passes — It can be checked against evidence.
- Load-bearing: passes — The paper’s conclusions depend on it.
- Based: passes — The paper gives a reason why it holds.
It may state two separate claims as one.
- Rests on an assumption: The mechanisms underlying the favorable effects of tirzepatide in obesity-related HFpEF remain unclear.
A conclusion the paper draws from its own results — it cites no other source for it, so there is none to check. The quote shows it is in the paper.
In the paper
“These findings provide new insights into the mechanisms by which tirzepatide leads to clinical improvement in HFpEF.”
§ Effects of tirzepatide on circulatory overload and end-organ damage in heart failure with preserved ejection fraction and obesity: a secondary analysis of the SUMMIT trial > Discussion
plaindirect- Asserted: passes — The authors put it forward as true.
- Checkable: fails — It may be too vague to check against evidence.
- Load-bearing: passes — The paper’s conclusions depend on it.
- Based: passes — The paper gives a reason why it holds.
Probably not a substantial claim. It may be too vague to check against evidence.
- Rests on an assumption: The mechanisms underlying the favorable effects of tirzepatide in obesity-related HFpEF remain unclear.
In the paper
“Systemic hypertension has been linked to the development of obesity-related CKD26, but we observed a direct relationship between decreases in systolic BP and decreases in eGFR at multiple time points.”
§ Effects of tirzepatide on circulatory overload and end-organ damage in heart failure with preserved ejection fraction and obesity: a secondary analysis of the SUMMIT trial > Discussion
What the sources say
- Not checked — no full text of the sourcecites [26] Yau, K., Kuah, R., Cherney, D. Z. I. & Lam, T. K. T. Obesity and the kidney: mechanistic links and therapeutic advances. Nat. Rev. Endocrinol. 20, 321–335 (2024). source
plaincorrelational- Asserted: passes — The authors put it forward as true.
- Checkable: passes — It can be checked against evidence.
- Load-bearing: fails — The paper’s conclusions may not depend on it.
- Based: passes — The paper gives a reason why it holds.
Probably not a substantial claim. The paper’s conclusions may not depend on it.
A conclusion the paper draws from its own results — it cites no other source for it, so there is none to check. The quote shows it is in the paper.
In the paper
“Collectively, these observations suggest that novel treatments that reduce circulatory volume–pressure overload (or its determinants), improve kidney function, reduce inflammation and mitigate cardiac injury may improve clinical status in people with obesity-related HFpEF.”
§ Effects of tirzepatide on circulatory overload and end-organ damage in heart failure with preserved ejection fraction and obesity: a secondary analysis of the SUMMIT trial > Discussion
hedgedconditional- Asserted: passes — The authors put it forward as true.
- Checkable: passes — It can be checked against evidence.
- Load-bearing: passes — The paper’s conclusions depend on it.
- Based: passes — The paper gives a reason why it holds.
It may state two separate claims as one.
What the paper did — it cites no source for this, so there is none to check. The quote shows it is in the paper.
In the paper
“In post hoc exploratory analyses”
§ Effects of tirzepatide on circulatory overload and end-organ damage in heart failure with preserved ejection fraction and obesity: a secondary analysis of the SUMMIT trial > Abstract
plain- Asserted: passes — The authors put it forward as true.
- Checkable: passes — It can be checked against evidence.
- Load-bearing: fails — The paper’s conclusions may not depend on it.
- Based: passes — The paper gives a reason why it holds.
Probably not a substantial claim. The paper’s conclusions may not depend on it.
A conclusion the paper draws from its own results — it cites no other source for it, so there is none to check. The quote shows it is in the paper.
In the paper
“Reductions in estimated BV with tirzepatide were correlated with decreases in systolic BP, reduction in UACR and improvements in both KCCQ-CSS score and 6MWD, suggesting that mitigation of circulatory volume expansion (or factors responsible for volume expansion) may play a central role in mediating the benefits of tirzepatide.”
§ Effects of tirzepatide on circulatory overload and end-organ damage in heart failure with preserved ejection fraction and obesity: a secondary analysis of the SUMMIT trial > Discussion
hedgedconditional- Asserted: passes — The authors put it forward as true.
- Checkable: passes — It can be checked against evidence.
- Load-bearing: passes — The paper’s conclusions depend on it.
- Based: passes — The paper gives a reason why it holds.
It may state two separate claims as one.
What the paper did — it cites no source for this, so there is none to check. The quote shows it is in the paper.
In the paper
“The ethics committee at each investigative site approved the trial, and all patients provided written informed consent.”
§ Effects of tirzepatide on circulatory overload and end-organ damage in heart failure with preserved ejection fraction and obesity: a secondary analysis of the SUMMIT trial > Methods
plain- Asserted: passes — The authors put it forward as true.
- Checkable: passes — It can be checked against evidence.
- Load-bearing: fails — The paper’s conclusions may not depend on it.
- Based: passes — The paper gives a reason why it holds.
Probably not a substantial claim. The paper’s conclusions may not depend on it. It may state two separate claims as one.
What the paper did — it cites no source for this, so there is none to check. The quote shows it is in the paper.
In the paper
“However, patients with significant musculoskeletal disease were excluded from SUMMIT by protocol.”
§ Effects of tirzepatide on circulatory overload and end-organ damage in heart failure with preserved ejection fraction and obesity: a secondary analysis of the SUMMIT trial > Discussion
plain- Asserted: passes — The authors put it forward as true.
- Checkable: passes — It can be checked against evidence.
- Load-bearing: fails — The paper’s conclusions may not depend on it.
- Based: passes — The paper gives a reason why it holds.
Probably not a substantial claim. The paper’s conclusions may not depend on it.
None of the sources cited for this claim have been checked yet.
In the paper
“Patients with active chronic noninflammatory myopathy and myositis may have mild elevation in troponin T independent of myocardial injury41.”
§ Effects of tirzepatide on circulatory overload and end-organ damage in heart failure with preserved ejection fraction and obesity: a secondary analysis of the SUMMIT trial > Discussion
What the sources say
- Not checked yetcites [41] du Fay de Lavallaz, J. et al. Skeletal muscle disorders: a noncardiac source of cardiac troponin T. Circulation 145, 1764–1779 (2022). source
Checked before — its earlier verdict is held back until a new check runs.
hedgedconditional- Asserted: passes — The authors put it forward as true.
- Checkable: passes — It can be checked against evidence.
- Load-bearing: fails — The paper’s conclusions may not depend on it.
- Based: passes — The paper gives a reason why it holds.
Probably not a substantial claim. The paper’s conclusions may not depend on it.
- Not checked yet
In the paper
“However, such an effect is physiologically inescapable, since PV/BV is inherently linked to body weight37, and thus, PV/BV necessarily declines as weight is lost.”
§ Effects of tirzepatide on circulatory overload and end-organ damage in heart failure with preserved ejection fraction and obesity: a secondary analysis of the SUMMIT trial > Discussion
What the sources say
- Not checked — no full text of the sourcecites [37] Feldschuh, J. & Enson, Y. Prediction of the normal blood volume. Relation of blood volume to body habitus. Circulation 56, 605–612 (1977). source
boosteddirect- Asserted: passes — The authors put it forward as true.
- Checkable: passes — It can be checked against evidence.
- Load-bearing: passes — The paper’s conclusions depend on it.
- Based: passes — The paper gives a reason why it holds.
It may state two separate claims as one.
What the paper did — it cites no source for this, so there is none to check. The quote shows it is in the paper.
In the paper
“Following screening, eligible patients were randomized double blind (1:1) to receive placebo or tirzepatide 2.5 mg per week subcutaneously, in addition to usual therapy.”
§ Effects of tirzepatide on circulatory overload and end-organ damage in heart failure with preserved ejection fraction and obesity: a secondary analysis of the SUMMIT trial > Methods > Study procedures
plain- Asserted: passes — The authors put it forward as true.
- Checkable: passes — It can be checked against evidence.
- Load-bearing: passes — The paper’s conclusions depend on it.
- Based: passes — The paper gives a reason why it holds.
Probably not a substantial claim. It may state two separate claims as one.
What the paper did — it cites no source for this, so there is none to check. The quote shows it is in the paper.
In the paper
“Given that the focus was on mechanistic understanding rather than clinical indications, adjustment for multiple hypothesis testing was not performed.”
§ Effects of tirzepatide on circulatory overload and end-organ damage in heart failure with preserved ejection fraction and obesity: a secondary analysis of the SUMMIT trial > Methods > Statistical methods
plain- Asserted: passes — The authors put it forward as true.
- Checkable: passes — It can be checked against evidence.
- Load-bearing: passes — The paper’s conclusions depend on it.
- Based: passes — The paper gives a reason why it holds.
Probably not a substantial claim.
None of the sources cited for this claim have been checked yet.
In the paper
“We understand that weight-independent formulas to estimate changes in PV have been proposed40, but these are relevant only for short-term interventions and are not applicable when there are meaningful changes in weight over months.”
§ Effects of tirzepatide on circulatory overload and end-organ damage in heart failure with preserved ejection fraction and obesity: a secondary analysis of the SUMMIT trial > Discussion
What the sources say
- Not checked yetcites [40] Strauss, M. B., Davis, R. K., Rosenbaum, J. D. & Rossmeisl, E. C. Water diuresis produced during recumbency by the intravenous infusion of isotonic saline solution. J. Clin. Invest. 30, 862–868 (1951). source
Checked before — its earlier verdict is held back until a new check runs.
plain- Asserted: passes — The authors put it forward as true.
- Checkable: passes — It can be checked against evidence.
- Load-bearing: passes — The paper’s conclusions depend on it.
- Based: passes — The paper gives a reason why it holds.
It may state two separate claims as one.
- Not checked yet
What the paper did — it cites no source for this, so there is none to check. The quote shows it is in the paper.
In the paper
“Randomization was stratified by (1) HF decompensation within 12 months; (2) type 2 diabetes; (3) BMI ≥35 kg m−2 or <35 kg m−2.”
§ Effects of tirzepatide on circulatory overload and end-organ damage in heart failure with preserved ejection fraction and obesity: a secondary analysis of the SUMMIT trial > Methods > Study procedures
plain- Asserted: passes — The authors put it forward as true.
- Checkable: passes — It can be checked against evidence.
- Load-bearing: fails — The paper’s conclusions may not depend on it.
- Based: passes — The paper gives a reason why it holds.
Probably not a substantial claim. The paper’s conclusions may not depend on it.
The paper relies on this without support.
The mechanisms underlying the favorable effects of tirzepatide in obesity-related HFpEF remain unclear.
“The mechanisms underlying these favorable effects of tirzepatide remain unclear.”
The paper relies on this without support.
The mechanisms underlying clinical improvement with incretins such as tirzepatide and semaglutide in patients with obesity-related HFpEF have remained unclear.
“but the mechanisms underlying clinical improvement with incretins such as tirzepatide and semaglutide in patients with obesity-related HFpEF have remained unclear.”
Claims other papers make about this one
Each is checked against this paper’s own text: does it say what the citing paper says it does?
The source backs part of the claim, not all of it — or backs it for a different population, condition or comparison.
In the citing paper
“However, because changes in eGFR-creatinine may be skewed in patients receiving GLP-1 receptor agonists due to the effect of these drugs to reduce muscle mass (and thereby serum creatinine), in the current report, we focused (in a post hoc analysis) on eGFR based on cystatin C (eGFR-cystatin C),51 although we also report all results based on eGFR-creatinine.”
From Interplay of Chronic Kidney Disease and the Effects of Tirzepatide in Patients With Heart Failure, Preserved Ejection Fraction, and Obesity (2025) · cites this paper as [51]
Experimental — accuracy not yet measuredThe source backs part of the claim, not all of it — or backs it for a different population, condition or comparison.
In the citing paper
“These observations suggest that semaglutide may rapidly improve disease trajectory through cardiometabolic mechanisms independent of weight loss, although the underlying pathophysiology requires further investigation.48-52”
From Semaglutide and Tirzepatide in Patients With Heart Failure With Preserved Ejection Fraction (2025) · cites this paper as [50]
Experimental — accuracy not yet measured
Self-check
Percentages, sums and reported differences re-computed from the paper’s own numbers.
Each contradiction between two passages listed here was confirmed by an independent check.
Rated minor: it would not touch a result — a value no result rests on, a p-value that stays on the same side of the significance level, or a conflict that is clerical, resolved elsewhere in the paper, or outside its own findings.
In the paper
§ Effects of tirzepatide on circulatory overload and end-organ damage in heart failure with preserved ejection fraction and obesity: a secondary analysis of the SUMMIT trial > Methods > Study procedures
“Hematocrit was measured at baseline, 24 weeks and 52 weeks. Estimated PV was calculated from these variables as (1 − hematocrit) × (a + (b × weight in kg))”
§ Effects of tirzepatide on circulatory overload and end-organ damage in heart failure with preserved ejection fraction and obesity: a secondary analysis of the SUMMIT trial > Results > Tirzepatide effects on hemodynamic load and inflammation
“| Estimated PV (l) | Estimated PV (l) | Estimated PV (l) | Estimated PV (l) | Estimated PV (l) | Estimated PV (l) | | 12 weeks | −0.17 | −0.03 | −0.13 | −0.16 to −0.11 | <0.001 |”
Rated minor: it would not touch a result — a value no result rests on, a p-value that stays on the same side of the significance level, or a conflict that is clerical, resolved elsewhere in the paper, or outside its own findings.
In the paper
§ Effects of tirzepatide on circulatory overload and end-organ damage in heart failure with preserved ejection fraction and obesity: a secondary analysis of the SUMMIT trial > Results > Correlations with clinical outcomes
“reduced body weight (ETD 11.6%, 95% CI −12.9% to −10.4%; P < 0.001)”
§ Effects of tirzepatide on circulatory overload and end-organ damage in heart failure with preserved ejection fraction and obesity: a secondary analysis of the SUMMIT trial > Results > Correlations with clinical outcomes
“95% CI −12.9% to −10.4%”
Citations
Cites
New creatinine- and cystatin C-based equations to estimate GFR without race
Inker, L. A., Eneanya, N. D., Coresh, J., Tighiouart, H., Wang, D., Sang, Y., Crews, D. C., Doria, A., Estrella, M. M., Froissart, M., et al. (2021) · New England Journal of Medicine · doi:10.1056/nejmoa2102953 · Cited by 4,695
Estimating glomerular filtration rate from serum creatinine and cystatin C
Inker, L. A., Schmid, C. H., Tighiouart, H., Eckfeldt, J. H., Feldman, H. I., Greene, T., Kusek, J. W., Manzi, J., Van Lente, F., Zhang, Y. L., et al. (2012) · New England Journal of Medicine · doi:10.1056/nejmoa1114248 · Cited by 4,102
Cardiovascular-kidney-metabolic health: a presidential advisory from the American Heart Association
Ndumele, C. E., Rangaswami, J., Chow, S. L., Neeland, I. J., Tuttle, K. R., Khan, S. S., Coresh, J., Mathew, R. O., Baker-Smith, C. M., Carnethon, M. R., et al. (2023) · Circulation · doi:10.1161/cir.0000000000001184 · Cited by 2,208
Effects of Semaglutide on Chronic Kidney Disease in Patients with Type 2 Diabetes.
Perkovic, V., Tuttle, K. R., Rossing, P., Mahaffey, K. W., Mann, J. F. E., Bakris, G., Baeres, F. M. M., Idorn, T., Bosch-Traberg, H., Lausvig, N. L., et al. (2024) · New England Journal of Medicine · doi:10.1056/nejmoa2403347 · Cited by 2,099 · cited 1×
“…insulin glargine in type 2 diabetes and increased cardiovascular risk (SURPASS-4) trial with tirzepatide 28 and the Evaluate Renal Function with Semaglutide Once Weekly (FLOW) trial with semaglutide 29 , as well as other reno-protective drugs such as sodium–glucose cotransporter 2 inhibitors 30 .”
Semaglutide in Patients with Heart Failure with Preserved Ejection Fraction and Obesity
Kosiborod, M. N., Abildstrøm, S. Z., Borlaug, B. A., Butler, J., Rasmussen, S., Davies, M., Hovingh, G. K., Kitzman, D. W., Lindegaard, M. L., Møller, D. V., et al. (2023) · New England Journal of Medicine · doi:10.1056/nejmoa2306963 · Cited by 1,669 · cited 1×
“These results are consistent with findings observed in the STEP-HFpEF program, where the glucagon-like peptide receptor-1 agonist semaglutide was also shown to improve health status and exercise capacity 20,21 .”
Self-citationObokata, M., Reddy, Y. N. V., Pislaru, S. V., Melenovsky, V., & Borlaug, B. A. (2017) · Circulation · doi:10.1161/circulationaha.116.026807 · Cited by 1,179
Self-citationTirzepatide for Heart Failure with Preserved Ejection Fraction and Obesity
Packer, M., Zile, M. R., Kramer, C. M., Baum, S. J., Litwin, S. E., Menon, V., Ge, J., Weerakkody, G. J., Ou, Y., Bunck, M. C., et al. (2025) · New England Journal of Medicine · doi:10.1056/nejmoa2410027 · Cited by 1,009
Self-citationSemaglutide in Patients with Obesity-Related Heart Failure and Type 2 Diabetes
Kosiborod, M. N., Petrie, M. C., Borlaug, B. A., Butler, J., Davies, M. J., Hovingh, G. K., Kitzman, D. W., Møller, D. V., Treppendahl, M. B., Verma, S., et al. (2024) · New England Journal of Medicine · doi:10.1056/nejmoa2313917 · Cited by 758 · cited 1×
“These results are consistent with findings observed in the STEP-HFpEF program, where the glucagon-like peptide receptor-1 agonist semaglutide was also shown to improve health status and exercise capacity 20,21 .”
Self-citationHeart Failure With Preserved Ejection Fraction
Borlaug, B. A., Sharma, K., Shah, S. J., & Ho, J. E. (2023) · Journal of the American College of Cardiology · doi:10.1016/j.jacc.2023.01.049 · Cited by 742
Self-citationHeart Failure With Preserved Ejection Fraction: A Review
Redfield, M. M., & Borlaug, B. A. (2023) · JAMA · doi:10.1001/jama.2023.2020 · Cited by 662
Self-citation
Cited by
Sorted by citations
The Adipokine Hypothesis of Heart Failure With a Preserved Ejection Fraction
Packer, M. (2025) · Journal of the American College of Cardiology · doi:10.1016/j.jacc.2025.06.055 · Cited by 213
Self-citationNauck, M. A., Tuttle, K. R., Tschöp, M. H., & Blüher, M. (2026) · The Lancet · doi:10.1016/s0140-6736(25)02105-1 · Cited by 123
2026 ESC Guidelines for the management of heart failure
Køber, L., Adamo, M., Ruwald, A., Tomasoni, D., Anderson, L., Andersson, C., Brugts, J. J., Chioncel, O. D., Donal, E., Ferdinandy, P., et al. (2026) · European Heart Journal · doi:10.1093/eurheartj/ehag100 · Cited by 109
2025 ACC Scientific Statement on the Management of Obesity in Adults With Heart Failure
Kittleson, M. M., Benjamin, E. J., Blumer, V., Harrington, J., Januzzi, J. L., McMurray, J. J. V., & Vest, A. R. (2025) · JACC · doi:10.1016/j.jacc.2025.05.008 · Cited by 79
Semaglutide and Tirzepatide in Patients With Heart Failure With Preserved Ejection Fraction
Krüger, N., Schneeweiss, S., Fuse, K., Matseyko, S., Sreedhara, S. K., Hahn, G., Schunkert, H., & Wang, S. V. (2025) · JAMA · doi:10.1001/jama.2025.14092 · Cited by 66
Mechano-energetic uncoupling in heart failure
Aksentijević, D., Sedej, S., Fauconnier, J., Paillard, M., Abdellatif, M., Streckfuß‐Bömeke, K., Ventura‐Clapier, R., van der Velden, J., de Boer, R. A., Bertero, E., et al. (2025) · Nature Reviews Cardiology · doi:10.1038/s41569-025-01167-6 · Cited by 55
Antifibrotic therapies for metabolic dysfunction-associated steatotic liver disease
Schwabe, R. F., Tacke, F., Sugimoto, A., & Friedman, S. L. (2025) · JHEP Reports · doi:10.1016/j.jhepr.2025.101421 · Cited by 52
Savarese, G., Schiattarella, G. G., Lindberg, F., Anker, M. S., Bayés‐Genís, A., Bäck, M., Braunschweig, F., Bucciarelli‐Ducci, C., Butler, J., Cannata, A. N., et al. (2025) · European Journal of Heart Failure · doi:10.1002/ejhf.3676 · Cited by 52
Packer, M., Zile, M. R., Kramer, C. M., Murakami, M., Ou, Y., & Borlaug, B. A. (2025) · Journal of the American College of Cardiology · doi:10.1016/j.jacc.2025.03.009 · Cited by 49
Self-citationKarakasis, P., Vlachos, K. G., Antoniadis, A. P., Siontis, K. C., Patoulias, D., Fragakis, N., & Mantzoros, C. S. (2025) · Metabolism · doi:10.1016/j.metabol.2025.156463 · Cited by 48
Borlaug, B. A., Zile, M. R., Kramer, C. M., Ye, W., Ou, Y., Hurt, K. C., Murakami, M., & Packer, M. (2025) · Journal of the American College of Cardiology · doi:10.1016/j.jacc.2025.04.059 · Cited by 46
Self-citationReddy, Y. N. V., Frantz, R. P., Hemnes, A. R., Hassoun, P. M., Horn, E. M., Leopold, J. A., Rischard, F. P., Rosenzweig, E. B., Hill, N. S., ERZURUM, S. C., et al. (2025) · Journal of the American College of Cardiology · doi:10.1016/j.jacc.2025.03.530 · Cited by 44
Self-citationO'Keefe, J. H., Franco, W. G., & O'Keefe, E. L. (2025) · Progress in Cardiovascular Diseases · doi:10.1016/j.pcad.2024.12.010 · Cited by 42
Ros-Madrid, I., Cano-Mármol, R. P., Ferrer-Gomez, M., & Ramos-Molina, B. (2025) · Canadian Journal of Physiology and Pharmacology · doi:10.1139/cjpp-2025-0148 · Cited by 31
Central Adiposity or Hypertension
Packer, M., Butler, J., Lam, C. S. P., Zannad, F. M., Vaduganathan, M., & Borlaug, B. A. (2025) · Journal of the American College of Cardiology · doi:10.1016/j.jacc.2025.08.036 · Cited by 30
Self-citationZhang, X., Cao, C., Zheng, F., Liu, C., & Tian, X. (2026) · Cardiovascular Drugs and Therapy · doi:10.1007/s10557-025-07670-9 · Cited by 27
“Additionally, it is demonstrated that it can improve multiple biomarkers (such as C-reactive protein, N-terminal prohormone B-type natriuretic peptide, and troponin T, among others), relieve systemic inflammation, and curtail myocardial injury [69].”
Clinical Impact of Tirzepatide on Patients With OSA and Obesity
Wu, J., Chen, C., Tu, W.-L., Hsu, W., Liu, T., Tsai, Y., Huang, P., Chuang, M., Hung, K., Yu, T., et al. (2025) · CHEST Journal · doi:10.1016/j.chest.2025.03.030 · Cited by 24
Insights into the Mechanism of Action of Tirzepatide: A Narrative Review
Galindo, R. J., CHENG, A. Y. Y., Longuet, C., Ai, M., Coşkun, T., Malik, R., Peleshok, J. C., Levine, J. A., & Dunn, J. P. (2025) · Diabetes Therapy · doi:10.1007/s13300-025-01804-w · Cited by 23
Bae, J. H., Haam, J.-H., Jeon, E. J., Kang, S. Y., Song, S., Park, C., & Kwon, H. (2025) · Journal of Obesity & Metabolic Syndrome · doi:10.7570/jomes25042 · Cited by 22
Borlaug, B. A., Holse, C., Jung, M. H., Lincoff, A. M., Mulvagh, S. L., Stærk‐Østergaard, J., Tuttle, K. R., & Petrie, M. C. (2025) · JACC Heart Failure · doi:10.1016/j.jchf.2025.102712 · Cited by 19
Self-citationBorlaug, B. A., Testani, J. M., Petrie, M. C., Wang, Z., Cunningham, J. W., Adams, K. F., Amir, O., Bělohlávek, J., Bocchi, E. A., Freitas, A. F., et al. (2025) · Nature Medicine · doi:10.1038/s41591-025-03939-6 · Cited by 18
Self-citationZheng, W., Qi, Q., Li, J., He, C., & Fan, H. (2025) · Diabetology & Metabolic Syndrome · doi:10.1186/s13098-025-01917-z · Cited by 17
Heart failure and obesity: novel insights leading to new treatment paradigms
Meems, L. M. G., van Veldhuisen, D. J., Sattar, N. A., & Lee, M. M. Y. (2025) · Nature Reviews Cardiology · doi:10.1038/s41569-025-01190-7 · Cited by 16
Mendieta, G., Ridker, P. M., Borlaug, B. A., Ducharme, A., Lam, C. S. P., Voors, A. A., Auerbach, P., Čikeš, M., Fudim, M., Hvelplund, A., et al. (2026) · European Journal of Heart Failure · doi:10.1093/ejhf/xuag153 · Cited by 15
Self-citationPhysiologic Phenotyping of Responses to Exercise and Activity in Heart Failure
Lewis, G. D., Tada, A., Landsteiner, I., & Borlaug, B. A. (2025) · Circulation Research · doi:10.1161/circresaha.125.325534 · Cited by 15
Self-citationForst, T. M., Block, C. E. M. D., Prato, S. D., Frías, J. P., Lautenbach, A., Ludvik, B. H., Marinez, M., Mathieu, C., Müller, T. D., & Schnell, O. (2025) · Diabetes Obesity and Metabolism · doi:10.1111/dom.16247 · Cited by 15
Parizad, R., Hatwal, J., Sadeghi, M. T., Brar, A. S., Desai, R., Batta, A., & Mohan, B. (2026) · Vascular Health and Risk Management · doi:10.2147/vhrm.s578698 · Cited by 13
Visceral obesity and HFpEF: targets and therapeutic opportunities
Li, Y., Lin, Z., & Li, Y. (2025) · Trends in Pharmacological Sciences · doi:10.1016/j.tips.2025.02.005 · Cited by 13
Current Treatment of Heart Failure with Preserved Ejection Fraction
Riccardi, M., D’Elia, E., Lombardi, C., Savarese, G., Gori, M., Oliva, F. G., Volterrani, M., Senni, M., Metra, M., & Inciardi, R. M. (2025) · Journal of Clinical Medicine · doi:10.3390/jcm14155406 · Cited by 13
Chronic Kidney Disease in Patients With Heart Failure With a Preserved Ejection Fraction
Packer, M., Testani, J. M., Butler, J., Zannad, F. M., Lam, C. S. P., Vaduganathan, M., Fang, J. C., & Borlaug, B. A. (2025) · Journal of the American College of Cardiology · doi:10.1016/j.jacc.2025.08.086 · Cited by 12
Self-citationGlucagon-like peptide-1 receptor agonists to improve cardiorenal outcomes: data from FLOW and beyond
Faruque, L. I., Yau, K., & Cherney, D. Z. I. (2025) · Current Opinion in Nephrology & Hypertension · doi:10.1097/mnh.0000000000001066 · Cited by 11
Ahmed, M., Burhan, M., Shafiq, A., Hashmi, T. M., Ahmed, R., Fudim, M., Mentz, R. J., & Fonarow, G. C. (2025) · Clinical Cardiology · doi:10.1002/clc.70234 · Cited by 11
Fármacos basados en GLP-1: mecanismos implicados en el tratamiento de la obesidad
Salvador, J. (2025) · Medicina Clínica (English Edition) · doi:10.1016/j.medcli.2025.107035 · Cited by 10
Tirzepatide for adults living with obesity
Franco, J. V. A., Guo, Y., Varela, L. B., Aqra, Z., Alhalahla, M., Rodriguez, M. M., Salvador-Oscco, E., Araujo, B. P., Banda, S., Liquitay, C. M. E., et al. (2025) · Cochrane Database of Systematic Reviews · doi:10.1002/14651858.cd016018 · Cited by 10
Diuretic De-Escalation in Response to HF Therapy
Biegus, J., Cotter, G., Davison, B. A., Metra, M., Pagnesi, M., & Ponikowski, P. P. (2025) · JACC Heart Failure · doi:10.1016/j.jchf.2025.03.010 · Cited by 10
Obesity and inflammation in chronic and acute heart failure
Cotter, G., Petrie, M. C., Butler, J., Davison, B. A., Chioncel, O. D., Biegus, J., Pagnesi, M., Voors, A. A., Metra, M., Ponikowski, P. P., et al. (2025) · Heart Failure Reviews · doi:10.1007/s10741-025-10518-x · Cited by 9
Hydrogen Sulfide Deficiency and Therapeutic Targeting in Cardiometabolic HFpEF
Doiron, J. E., Elbatreek, M. H., Xia, H., Yu, X., Gehred, N., Gromova, T., Chen, J., Driver, I. H., Muraoka, N., Jensen, M. B., et al. (2025) · JACC Basic to Translational Science · doi:10.1016/j.jacbts.2025.04.011 · Cited by 9
Real-world efficacy of tirzepatide in patients with heart failure without diabetes
Augusto, S. N., Kaelber, D. C., & Tang, W. H. W. (2025) · Current Problems in Cardiology · doi:10.1016/j.cpcardiol.2025.102998 · Cited by 8
Modulating the Secretome of Fat to Treat Heart Failure
Salyer, L. G., Wang, Y., Ma, X., Foryst‐Ludwig, A., Kintscher, U., Chennappan, S., Kontaridis, M. I., & McKinsey, T. A. (2025) · Circulation Research · doi:10.1161/circresaha.125.325593 · Cited by 8
Hullon, D., Janiec, K., Florova, V., Trach, A., Volkova, Y., & Mnevets, R. O. (2025) · Cardiovascular Endocrinology & Metabolism · doi:10.1097/xce.0000000000000344 · Cited by 8
Aletras, G., Bachlitzanaki, M., Stratinaki, M., Foukarakis, E. G., Petrakis, I., Pantazis, Y., Hamilos, M. I., & Stylianou, K. (2026) · Frontiers in Cardiovascular Medicine · doi:10.3389/fcvm.2025.1731305 · Cited by 8
Costa, T. A., Felix, N. S., Chagas, G. C. L., Terán, S., Boslough, M., Shelar, V., Lee, M. M. Y., Pandey, A., Abreu, M., McGuire, D. K., et al. (2025) · Diabetes Obesity and Metabolism · doi:10.1111/dom.16512 · Cited by 7
Abdul‐Hafez, H. A., Awashra, A., Bdir, S., Saife, S., Salah, Q., Barbarawi, M., Swaileh, T., Emara, A., Elgendy, M. S., & Shubietah, A. R. M. (2026) · Endocrinology Diabetes & Metabolism · doi:10.1002/edm2.70152 · Cited by 7
Thomas, J., Dagan, M., Wang, B. H., Gutman, S., & Kaye, D. M. (2026) · Circulation Heart Failure · doi:10.1161/circheartfailure.125.013279 · Cited by 8
Lam, C. S. P., Contreras, J., Darwesh, R., Freitas, A. F., Kristensen, S. L., Kuwahara, K., Ludman, A. J., Ma, C., Marx, N., Mathisen, J., et al. (2026) · European Journal of Heart Failure · doi:10.1093/ejhf/xuag155 · Cited by 7
Advances in the management of obesity and heart failure: latest evidence from clinical trials
Costa, T. A., & Harrington, J. (2025) · Current Opinion in Cardiology · doi:10.1097/hco.0000000000001214 · Cited by 7
Crispino, S. P., Nusca, A., Ferro, A., Cricco, R., Ciancio, M., Segreti, A., Cavallari, I., Sabatino, M., Potena, L., Ussia, G. P., et al. (2025) · Biomolecules · doi:10.3390/biom15111574 · Cited by 6
Elevated Pulmonary Artery Wedge Pressure in Group 1 Pulmonary Hypertension
Reddy, Y. N. V., Frantz, R. P., Miranda, W. R., Asokan, A. K., Varma, R., Rischard, F. P., Hassoun, P. M., Hemnes, A. R., Horn, E. M., Leopold, J. A., et al. (2026) · Circulation · doi:10.1161/circulationaha.125.077606 · Cited by 6
Self-citationOdoardo, L. A. F. D., Zucchetti, O., Sciatti, E., D’Isa, S., D’Elia, E., & Senni, M. (2025) · European Heart Journal Supplements · doi:10.1093/eurheartjsupp/suaf032 · Cited by 6
Acute Heart Failure: Transitioning From Symptom-Based Care to Remission
Cotter, G., Davison, B. A., Mann, D. L., Biegus, J., ter Maaten, J. M., Pagnesi, M., Freund, Y., Voors, A. A., Ponikowski, P. P., Metra, M., et al. (2025) · Journal of Cardiac Failure · doi:10.1016/j.cardfail.2024.12.016 · Cited by 5
A narrative review on tirzepatide’s therapeutic potential in glycemic control and cardioprotection
Thiriveedi, M., Domingo, F. S., Yates, H., Baddam, S., Beblawy, R. E., Nimmana, B., & Patel, S. (2025) · Annals of Medicine and Surgery · doi:10.1097/ms9.0000000000004055 · Cited by 5
Prevalence and Clinical Implications of Excess Adiposity in Group 1 Pulmonary Hypertension
Reddy, Y. N. V., Frantz, R. P., Hemnes, A. R., Hassoun, P. M., Horn, E. M., Leopold, J. A., Rischard, F. P., Rosenzweig, E. B., Hill, N. S., ERZURUM, S. C., et al. (2025) · Circulation Heart Failure · doi:10.1161/circheartfailure.125.013591 · Cited by 5
Self-citationBeyond Glycemic Control: GLP-1RA–Based Therapies and Emerging Targets Beyond the Metabolic Axis
Matuszewski, W., Wołos-Kłosowicz, K., Włodarczyk, P., Waśniewska, P., Modzelewski, R., Górny, J. M., Szklarz, M., Madeksza, M., & Juranek, J. K. (2026) · Journal of Clinical Medicine · doi:10.3390/jcm15072786 · Cited by 5
Al-Ameri, L. T., Hameed, E. K., Dulaimi, Z., Abdalgbar, A., Wahdan, M. Y., Joboory, A. A., Mahmoud, S., Abdulla, M., Alshara, L., & Al-Dulaimi, N. F. (2024) · AL-Kindy College Medical Journal · doi:10.47723/hesy7z38 · Cited by 5
Chunduri, S., Bidaoui, G., Hussein, M. H., Patel, M., Abdelmaksoud, A., Mohamed, M., Attia, A. S., Tatum, D. M., Borgi, J., & Toraih, E. A. (2025) · Cardiovascular Drugs and Therapy · doi:10.1007/s10557-025-07757-3 · Cited by 5
Time to screen: rationale and roadmap for HFpEF screening in individuals with obesity
Achten, A., Peeters, L., Verkoulen, G. H. J. M., Weerts, J., Knackstedt, C., Boerma, E.-J. G., van Empel, V. P. M., & Wijk, S. S. (2025) · Heart Failure Reviews · doi:10.1007/s10741-025-10540-z · Cited by 4
Overweight and obesity in metabolic syndrome
Nedogoda, S. V., & Васильевна, Ц. О. (2025) · Russian Journal of Cardiology · doi:10.15829/1560-4071-2025-6535 · Cited by 4
The role of the incretin GIP in inflammation
Rossi, G., Bucciarelli, L. G., Cimino, V., & Fiorina, P. (2025) · Journal of Endocrinological Investigation · doi:10.1007/s40618-025-02719-w · Cited by 4
Glucagon-Like Peptide 1 Receptor Agonists and Cardiovascular Disease
Ibe, T., & Borlaug, B. A. (2025) · Annual Review of Medicine · doi:10.1146/annurev-med-043024-011141 · Cited by 4
Self-citationNLRP3 inflammasome as a central target for the pleiotropic effects of GLP-1 receptor agonists
Mahmoudi, A. A., Saeedi‐Boroujeni, A., Vadizadeh, A., Kesharwani, P., & Sahebkar, A. (2026) · International Immunopharmacology · doi:10.1016/j.intimp.2026.117063 · Cited by 4
Elbatreek, M. H., Li, Z., Yu, X., Gehred, N., Gromova, T., Chen, J., Huerta, M., Muraoka, N., Jensen, M. B., Kartha, V. K., et al. (2026) · European Heart Journal · doi:10.1093/eurheartj/ehag732 · Cited by 4
Wang, K., Zhang, H., & Chen, Y. (2025) · Scientific Reports · doi:10.1038/s41598-025-17483-3 · Cited by 4
Impact of glucagon-like peptide-1 receptor agonists on the incidence of atrial fibrillation
Glaser, K., Glaser, W., Marino, L., Ruchała, M. A., & Bilotta, F. (2025) · World Journal of Cardiology · doi:10.4330/wjc.v17.i7.107510 · Cited by 3
Body Composition and Treatment Response in Heart Failure With Preserved Ejection Fraction
Vest, A. R., Ilonze, O. J., Umapathi, P., & Harrington, J. (2025) · Journal of the American College of Cardiology · doi:10.1016/j.jacc.2025.08.037 · Cited by 3
He, Y., Zeng, C., Zhang, Y., Wu, Q., Xiao-yu, Z., Yan, P., Xu, Y., Guo, M., & Teng, F. (2025) · Diabetes/Metabolism Research and Reviews · doi:10.1002/dmrr.70097 · Cited by 3
Advances in Pharmacotherapies for Obesity-Related HFpEF: A Comprehensive Review
Wu, Y., Song, M., Chen, X., Chen, W., Wu, M., & Lin, L. (2025) · Current Heart Failure Reports · doi:10.1007/s11897-025-00722-z · Cited by 3
Targeting Obesity for Heart Failure
Morris, E., & Rider, O. J. (2025) · European Cardiology Review · doi:10.15420/ecr.2025.37 · Cited by 3
Update on clinical heart failure trials
Hoevelmann, J., Tokcan, M., Kulenthiran, S., Abdin, A., Viljoen, C. A., & Böhm, M. (2025) · Clinical Research in Cardiology · doi:10.1007/s00392-025-02784-4 · Cited by 2
Sebastian, S. A., Ayyalu, T., Bimal, T., Patel, B., Kittleson, M. M., Carbone, S., & Yehya, A. (2026) · Disease-a-Month · doi:10.1016/j.disamonth.2026.102099 · Cited by 2
Kidney dysfunction and pulmonary vascular disease in heart failure with preserved ejection fraction
Amdahl, M. B., Naser, J. A., Tada, A., Doi, S., Harada, T., Ibe, T., Testani, J. M., Melenovský, V., Reddy, Y. N. V., & Borlaug, B. A. (2026) · European Journal of Heart Failure · doi:10.1093/ejhf/xuag140 · Cited by 2
Self-citationBiologics for cardiovascular diseases: from bench to bedside
Sun, X., Wang, X., Jia, R., Tang, J., Zeng, X. Y., Zhao, F., Zeng, F., Huang, N., Li, J., & Cui, K. (2026) · Signal Transduction and Targeted Therapy · doi:10.1038/s41392-026-02673-w · Cited by 2
Mondellini, G. M., Heemann, J., Galloo, X., Plein, D., Soens, L., Borlaug, B. A., Guazzi, M., & Verbrugge, F. H. (2026) · Acta cardiologica. Supplementum · doi:10.1080/00015385.2026.2721796 · Cited by 2
Self-citationEvaluating the Impact of Tirzepatide on Clinical Outcomes in Patients With Heart Failure
Malik, M. H. B. A., Khan, N. N., Chowdhari, M. J., Rafiq, M. K., Ali, M., Sadia, L. N. U., Ramzan, H. S., Ahmed, M. M., & Khatoon, F. (2025) · Cureus · doi:10.7759/cureus.82118 · Cited by 2
Sedrak, P., Verma, R., Verma, M., & Connelly, K. A. (2025) · Canadian Journal of Cardiology · doi:10.1016/j.cjca.2025.03.037 · Cited by 2
Incretins for management of obesity and obstructive sleep apnea
Hu, X., Yee, B. J., Phillips, C. L., Chapman, J. L., & Grunstein, R. R. (2025) · Expert Review of Respiratory Medicine · doi:10.1080/17476348.2025.2513516 · Cited by 2
Cardiovascular effects of semaglutide and tirzepatide and their potential for cardioprevention
Cherkashin, D. V., Салухов, В. В., & Khalimov, Y. S. (2025) · Meditsinskiy sovet = Medical Council · doi:10.21518/ms2025-323 · Cited by 2
Lee, J., & Shin, M. (2025) · Cardiovascular Prevention and Pharmacotherapy · doi:10.36011/cpp.2025.7.e2 · Cited by 1
Animal models for development of anti-obesity drugs in the age of GLP-1 agents
Culver, A. E., Stayrook, K. R., Comerota, M. M., Oblak, A. L., & Burris, T. P. (2025) · Expert Opinion on Drug Discovery · doi:10.1080/17460441.2025.2507766 · Cited by 2
Ibe, T., Demmer, R. T., Harada, T., Doi, S., Tada, A., Naser, J. A., Reddy, Y. N. V., & Borlaug, B. A. (2025) · European Journal of Heart Failure · doi:10.1002/ejhf.3745 · Cited by 1
Self-citationEvaluation of pulmonary hypertension in heart failure with preserved ejection fraction
Cao, J. J. L., & Reddy, Y. N. V. (2025) · Heart Failure Reviews · doi:10.1007/s10741-025-10553-8 · Cited by 1
Do Heart Failure With Preserved Ejection Fraction Treatments Work by Targeting Adipose Biology?
Borlaug, B. A. (2025) · Journal of the American College of Cardiology · doi:10.1016/j.jacc.2025.07.046 · Cited by 1
Self-citationTirzepatide and Obesity: A Narrative Review
Singh, A., Ahmad, R., Chowdhury, K., Narwaria, M., & Haque, M. (2025) · Advances in Human Biology · doi:10.4103/aihb.aihb_244_25 · Cited by 1
Obesity in Cardiorenal syndrome: Management Opportunities and Challenges
Reaves, A. C., Jaffe, E., & McCallum, W. I. (2025) · Current Hypertension Reports · doi:10.1007/s11906-025-01352-5 · Cited by 1
Obesidad y disfunción cardiorrenal: el impacto de la inflamación y la lipotoxicidad
Rico-Fontalvo, J. E., Daza-Arnedo, R., Raad-Sarabia, M., Montejo-Hernández, J. D., Yánez, T. R., Quintero, J. J., Arias, M. G., & Garaygordobil, D. A. (2026) · Revista Colombiana de Nefrología · doi:10.22265/acnef.13.1.1071 · Cited by 1
Riccardi, M., Ostrominski, J. W., Chatur, S., Lombardi, C., Volterrani, M., Metra, M., Savarese, G., Vaduganathan, M., Solomon, S. D., & Inciardi, R. M. (2026) · European Journal of Heart Failure · doi:10.1093/ejhf/xuag074 · Cited by 1
Obesity and Heart Failure: Introducing the Theme
Monitillo, F., Basile, P., & Lisco, G. (2026) · Journal of Cardiovascular Development and Disease · doi:10.3390/jcdd13040153 · Cited by 2
Shin, M. H., Jeong, J. W., Ha, S. E., Singh, R., Lee, M. Y., Ro, S., & Yu, T. Y. (2026) · Pharmaceuticals · doi:10.3390/ph19050791 · Cited by 1
Adipokine profile in acute heart failure: associations with natriuretic response and prognosis
Biegus, J., Tymków, R., Iwanek, G., Zymliński, R., Guzik, M., Hurkacz, M., Sopyla, W., Gajewski, P., & Ponikowski, P. P. (2026) · ESC Heart Failure · doi:10.1093/eschf/xvag150 · Cited by 1
Curto, R., Giglione, C., Cannarella, R., Berisha, H., Hattab, R., Condorelli, R. A., Vignera, S. L., Calogero, A. E., & Magni, P. (2026) · Pharmacological Research · doi:10.1016/j.phrs.2026.108278 · Cited by 1
Fan, Y., Chen, X., Cai, X., Dong, Y., Liu, C., Chen, Y., Lip, G. Y. H., & Zhu, W. (2026) · Metabolism · doi:10.1016/j.metabol.2026.156678 · Cited by 1
Gómez-Martín, Á., Marqués, P., Recatalá, C. A., Vea, À., Domingo, E., Alabadí, B., Real, J. T., Sanz, M., & Piqueras, L. (2026) · Pharmacological Research · doi:10.1016/j.phrs.2026.108321 · Cited by 1
Khan, I., Meenakshi, S., Abubakar, M., Kumar, N., Gaikwad, V. L., Rai, A., & Murti, K. (2026) · Endocrine · doi:10.1007/s12020-026-04686-5 · Cited by 1
Effects of Tirzepatide in Obesity-Related HFpEF by Sex
Borlaug, B. A., Zile, M. R., Kramer, C. M., Litwin, S. E., Ye, W., Ou, Y., Hurt, K. C., Murakami, M., & Packer, M. (2026) · JACC Heart Failure · doi:10.1016/j.jchf.2026.103218 · Cited by 1
Self-citationIncretin analogues as cardiovascular agents: a state-of-the-art review
Garaygordobil, D. A., Rico-Fontalvo, J. E., Hernández-Balbuena, B., Vinay, M., & Gonzalez-Arias, M. (2026) · Frontiers in Endocrinology · doi:10.3389/fendo.2026.1898812 · Cited by 1
Beyond glycemic control: clinical cardiovascular effects of tirzepatide—a narrative review
Alawad, A. O., Merghani, T. H., Fadelelmoula, T. E. Y., Elamin, N. A., Satti, S., Edris, A., Hakim, A., El-Hindi, R. F., Alhaj-Ali, A. A., Ibrahim, W. E., et al. (2026) · Therapeutic Advances in Endocrinology and Metabolism · doi:10.1177/20420188261469947 · Cited by 1
Wireless electrocatalytic closed-loop system for drug-free management of diabesity
Maity, D., Ray, P. G., Buchmann, P., Hamri, G. C., & Fussenegger, M. (2026) · Science · doi:10.1126/science.ady8560 · Cited by 1
Does the Mechanism of Weight Loss Matter for Cardiovascular Protection?
Myhre, P. L., & Vaduganathan, M. (2025) · Journal of the American College of Cardiology · doi:10.1016/j.jacc.2024.12.020 · Cited by 1
Bridging Gaps in Heart Failure Science: Toward a More Integrated Future
Liu, J., & Cheng, T. (2025) · Life · doi:10.3390/life15101613 · Cited by 1
Liuzzo, G., & Patrono, C. (2025) · European Heart Journal · doi:10.1093/eurheartj/ehaf013
The Role of GLP-1R and GIPR Agonism in Heart Failure
Sedrak, P., & Connelly, K. A. (2025) · Canadian Diabetes & Endocrinology Today · doi:10.58931/cdet.2025.3138
Metadata
- Authors
- Borlaug, B. A., Zile, M. R., Kramer, C. M., Baum, S. J., Hurt, K., Litwin, S. E., Murakami, M., Ou, Y., Upadhyay, N., & Packer, M.
- Affiliations
- Mayo Clinic (US)
- Medical University of South Carolina (US)
- University of Virginia Health System (US)
- Eli Lilly (United States) (US)
- Baylor University Medical Center (US)
- Corresponding author
- Borlaug, Barry A.
- ORCID
- Venue
- Nature Medicine
- Published
- 2024-11-17
- Volume
- 31
- Issue
- 2
- Pages
- 544-551
- ISSN
- 1078-8956 (ISSN-L)
- 1546-170X
- PMC
- PMC11835708
- OpenAlex
- W4404448817
- Semantic Scholar
- 9e45ced488de6f3d503280df9f45d4dbd4862fc5
- Cited by
- 166
- References
- 43
- Citations by year
- 2026: 83 · 2025: 81 · 2024: 2
- FWCI
- 46.66
- Type
- journal article
- Language
- en
- Open access
- hybrid
- doi.org
- Locations
- Nature Medicine (publishedVersion, cc-by)
- PubMed Central (publishedVersion, cc-by)
- PubMed (publishedVersion)
- Funders
- Eli Lilly and Company
- Topics
- Health Sciences › Medicine › Cardiology and Cardiovascular Medicine › Heart Failure Treatment and Management
- Health Sciences › Medicine › Cardiology and Cardiovascular Medicine › Cardiovascular Function and Risk Factors
- Health Sciences › Medicine › Endocrinology, Diabetes and Metabolism › Diabetes Treatment and Management
- Keywords
- tirzepatide, heart failure with preserved ejection fraction, obesity, circulatory overload, blood volume, blood pressure, C-reactive protein, glomerular filtration rate, albuminuria, natriuretic peptides, troponin T, SUMMIT trial, GIP/GLP-1 receptor agonist
- MeSH terms
- Tirzepatide, Aged, Blood Pressure, C-Reactive Protein, Female, Heart Failure, Humans, Male, Middle Aged, Obesity, Peptide Fragments, Stroke Volume, Natriuretic Peptide, Brain
About these checks
Registry, retraction, Cites and statistics results are computed, not judged, with one exception: a printed reference that no index lists is read once by a model before it counts as a citation error. Claims are extracted by a model and kept only when their quote appears verbatim in the text; each cited source is then checked, with a model’s help, for whether it says what the claim relies on. Those verdicts can be wrong — read the claim’s quote and the cited source before relying on one.
A language model drew the claims from the paper on 2026-11-09, under version 3 of the claim definition (model deepseek-v4.1-flash, prompt extract-v3).
A second model labelled each claim on 2026-11-09 (model jev-1.13-20260917, definition revision gold-guideline-v0.2).
Cited sources are checked with a language model’s help (gpt-6-sol).
Statistics and arithmetic are recomputed, not judged.
Confidence bands are shown only for fields calibrated on our annotated test set. None is calibrated yet, so no band is shown.
What counts as a claim ›How we measure confidence ›How we check this ›
Are you an author, or do you see a problem with this page? Request a review
