

The DOI matches its Crossref record; 36 of the 37 references it cites were found in a registry or an index, and 1 are not checked yet.
Understanding metric-related pitfalls in image analysis validation
Open accessAbstract
Validation metrics are key for tracking scientific progress and bridging the current chasm between artificial intelligence research and its translation into practice. However, increasing evidence shows that, particularly in image analysis, metrics are often chosen inadequately. Although taking into account the individual strengths, weaknesses and limitations of validation metrics is a critical prerequisite to making educated choices, the relevant knowledge is currently scattered and poorly accessible to individual researchers. Based on a multistage Delphi process conducted by a multidisciplinary expert consortium as well as extensive community feedback, the present work provides a reliable and comprehensive common point of access to information on pitfalls related to validation metrics in image analysis. Although focused on biomedical image analysis, the addressed pitfalls generalize across application domains and are categorized according to a newly created, domain-agnostic taxonomy. The work serves to enhance global comprehension of a key topic in image analysis validation.
Overview
The claims and statistics of this paper haven’t been checked yet.
Run the check — free, no account needed. It reads the open-access text and checks the sources it cites.
Integrity signals
Registry
Cites
Statistics
Figures
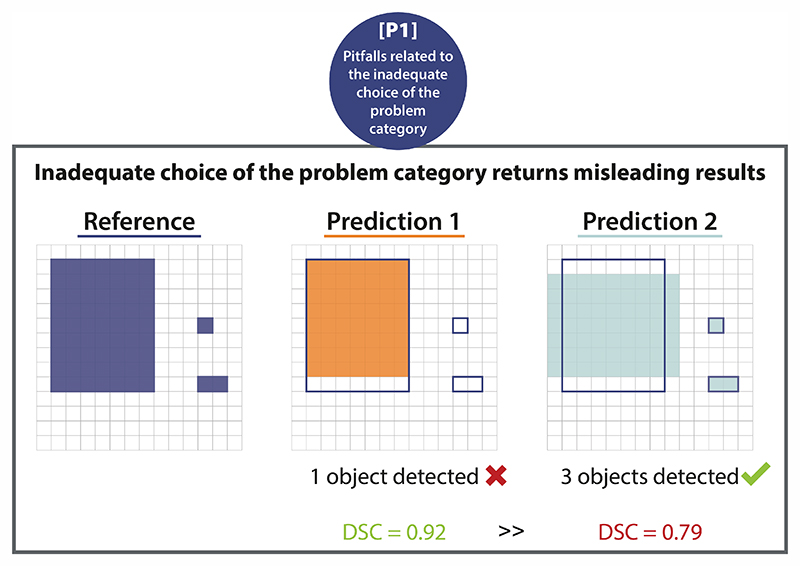
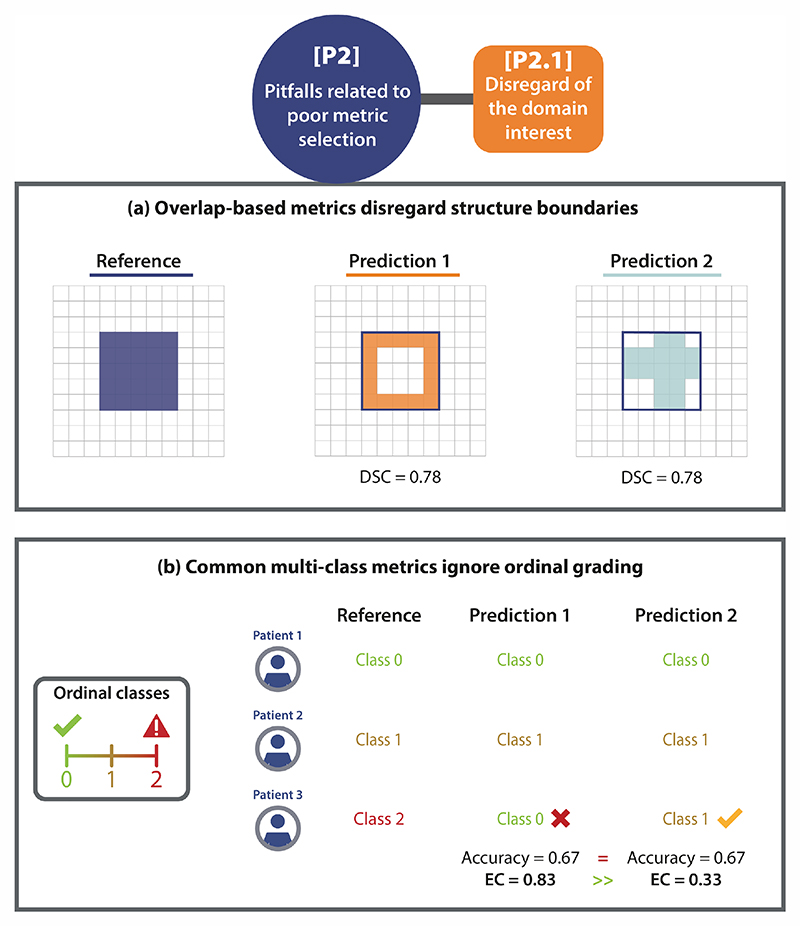
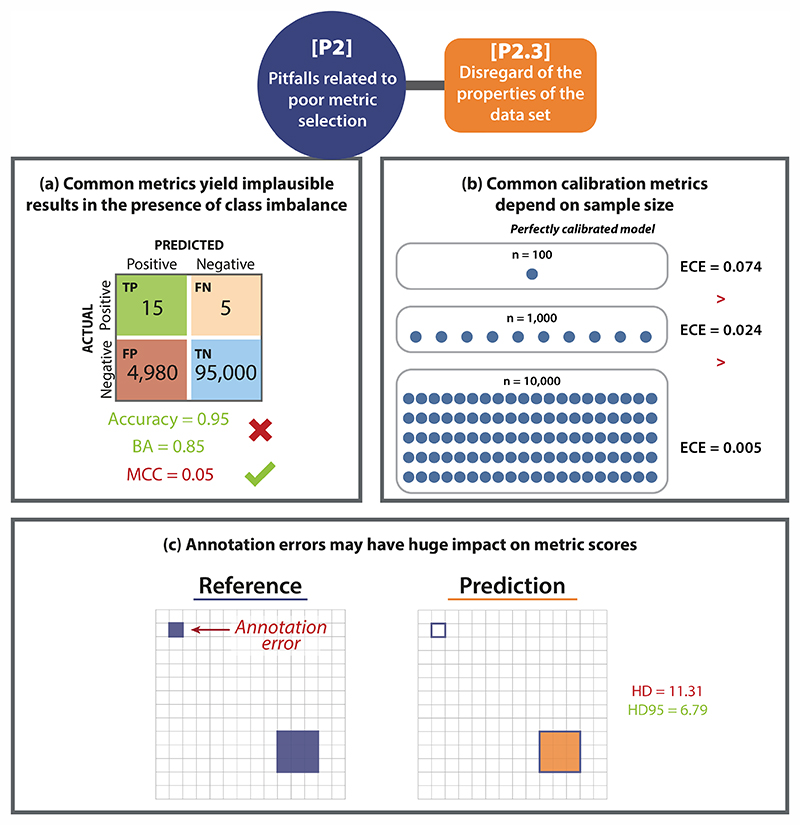
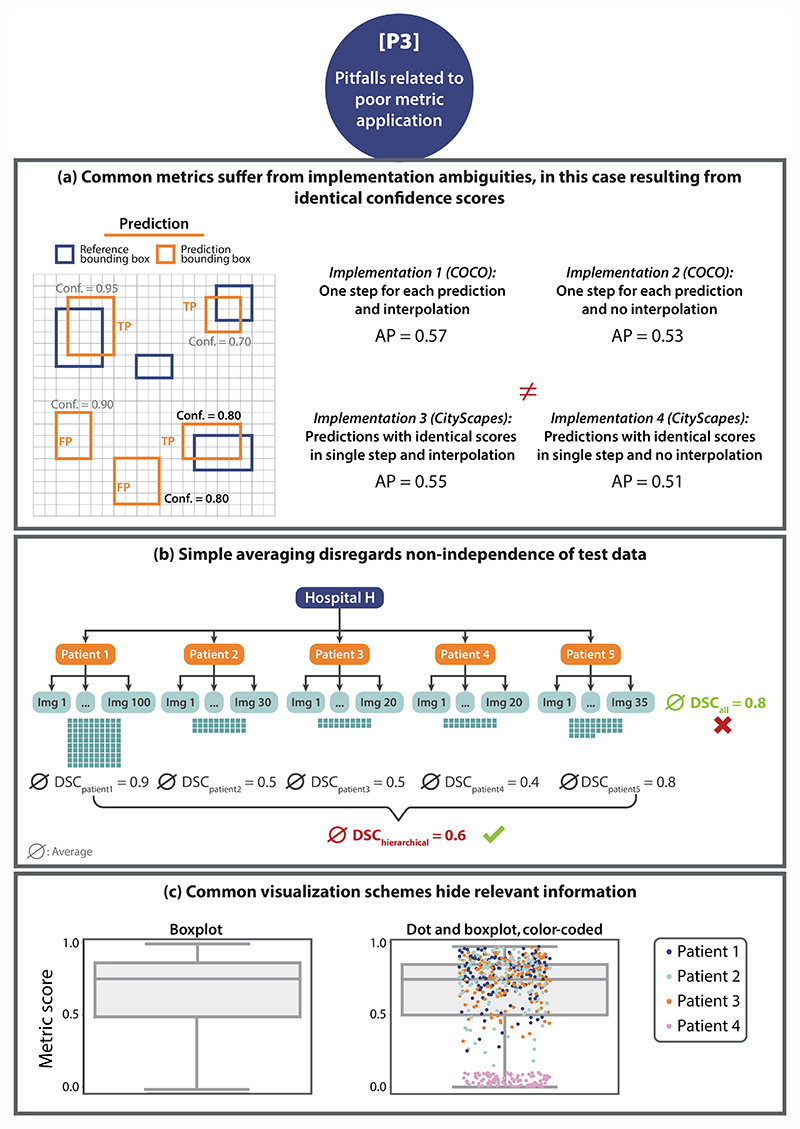
Verification
Claims the paper makes
The claims and statistics of this paper haven’t been checked yet.
Run the check — free, no account needed. It reads the open-access text and checks the sources it cites.
Claims other papers make about this one
Each is checked against this paper’s own text: does it say what the citing paper says it does?
The source backs part of the claim, not all of it — or backs it for a different population, condition or comparison.
In the citing paper
“Acceptance testing of AI auto contouring algorithms typically involves both area‐based metrics (e.g., Dice Similarity Coefficient, Intersection over Union (IoU)) and distance‐based metrics (e.g., Hausdorff Distance) evaluated against reference standard contours. 11 , 12 , 13 , 14 These metrics are well established for assessing contour agreement, but they say nothing about where the model is confi”
From Uncertainty quantification of U‐Net based segmentation tool using conformal prediction (2026) · cites this paper as [13]
Experimental — accuracy not yet measured
Self-check
Percentages, sums and reported differences re-computed from the paper’s own numbers.
The self-check needs the paper’s full text.
Citations
Cites
Microsoft COCO: Common Objects in Context
Lin, T.-Y., Maire, M., Belongie, S., Hays, J., Perona, P., Ramanan, D., Dollár, P., & Zitnick, C. L. (2014) · Lecture Notes in Computer Science · doi:10.1007/978-3-319-10602-1_48 · Cited by 45,460
The pascal visual object classes (VOC) challenge
Everingham, M., Van Gool, L., Williams, C. K. I., Winn, J., & Zisserman, A. (2010) · International Journal of Computer Vision · doi:10.1007/s11263-009-0275-4 · Cited by 19,599
Yang (2021) · doi:10.1038/s41598-020-79139-8 · Cited by 5,035
Cellpose: a generalist algorithm for cellular segmentation
Stringer, C., Wang, T., Michaelos, M., & Pachitariu, M. (2021) · Nature Methods · doi:10.1038/s41592-020-01018-x · Cited by 4,369
Metrics for evaluating 3D medical image segmentation: analysis, selection, and tool
Taha, A. A., & Hanbury, A. (2015) · BMC Medical Imaging · doi:10.1186/s12880-015-0068-x · Cited by 3,247
Self-citationCell Detection with Star-Convex Polygons
Schmidt, U., Weigert, M., Broaddus, C., & Myers, G. (2018) · Lecture Notes in Computer Science · doi:10.1007/978-3-030-00934-2_30 · Cited by 1,826
Delphi methodology in healthcare research: How to decide its appropriateness
Nasa, P., Jain, R., & Juneja, D. (2021) · World Journal of Methodology · doi:10.5662/wjm.v11.i4.116 · Cited by 1,821
The Liver Tumor Segmentation Benchmark (LiTS)
Bilic, P., Christ, P., Li, H. B., Vorontsov, E., Ben-Cohen, A., Kaissis, G., Szeskin, A., Jacobs, C., Mamani, G. E. H., Chartrand, G., et al. (2023) · Medical Image Analysis · doi:10.1016/j.media.2022.102680 · Cited by 1,412
Self-citationHow to Evaluate Foreground Maps
Margolin, R., Zelnik‐Manor, L., & Tal, A. (2014) · IEEE Computer Society Conference on Computer Vision and Pattern Recognition/Proceedings - IEEE Computer Society Conference on Computer Vision and Pattern Recognition/Proceedings · doi:10.1109/cvpr.2014.39 · Cited by 1,143
Metrics for Multi-Class Classification: an OverviewPreprint
Grandini, M., Bagli, E., & Visani, G. (2020) · arXiv (Cornell University) · doi:10.48550/arxiv.2008.05756 · Cited by 892
Research works printed but not linked: 1
- Lennerz, J. K., Green, U., Williamson, D. F. K. & Mahmood, F. A unifying force for the realization of medical ai. NPJ Digit. Med. 5, 172 (2022).
Cited by
Sorted by citations
Items 201–230 of 230
Shi, G., Tang, H., Lu, B.-Y., Sun, L., Ye, T., & Wang, W. (2026) · Remote Sensing · doi:10.3390/rs18183228 · Cited by 1
Katı, E., ÖZKILIÇ, G. G. E., Özata, M. Y., & Bayrakdar, İ. Ş. (2026) · Diagnostics · doi:10.3390/diagnostics16193078
On the Behavior of Calibration Error Under Rater Disagreement
Kumar, H., Vu, Y. N. T., Su, J., & Matthews, T. P. (2026) · Lecture notes in computer science · doi:10.1007/978-3-032-38470-6_21
A Reproducible and Explainable Deep Learning Framework for Dermoscopic Image Analysis in Skin Cancer
Pınar, A., Yağın, F. H., Çolak, C., Yagin, B., Alzakari, S. A., Alkhalifa, A. K., & Tabnjh, A. K. (2026) · Journal of Clinical Medicine · doi:10.3390/jcm15197422
Ma, C.-Y., Fu, Y., Zhang, L., Liu, L., Wang, Y., Jia, L., Wei-qi, 熊. X., Zhang, W., Xu, X., & Zhou, J. (2026) · Frontiers in Oncology · doi:10.3389/fonc.2026.1936913
Beyond Overlap Metrics: A Multi-Domain Evaluation Framework for Hepatic Vascular Segmentation
Franzoi, E., Morelli, A., Aliani, C., Bocchi, L., & Uccheddu, F. (2026) · World Congress on Medical Physics and Biomedical Engineering, September 7 - 12, 2009, Munich, Germany · doi:10.1007/978-3-032-37736-4_43
CogAlign-CausalX: Explainable Polyp Segmentation and Grading with XAlign Scoring
Gowd, G. S., & Vasundra, S. (2026) · International Conference on I-SMAC (IoT in Social, Mobile, Analytics and Cloud) (I-SMAC) · doi:10.21203/rs.3.rs-11101497/v1
Colson, H., & Valdebran, M. (2026) · Frontiers in Imaging · doi:10.3389/fimag.2026.1976334
Bidstrup, D., Pareek, A., & Børglum, J. D. (2026) · Journal of Imaging Informatics in Medicine · doi:10.1007/s10278-026-02346-8
O'Neill, A. G. M., O’Keeffe, R., Winter, S., Dorrian, J., Gaunt, T. R., Guönason, V., Travis, R. C., Martin, R. M., Allott, E. H., & Leech, M. (2026) · The Prostate · doi:10.1002/pros.70226
Xiang, G., Wang, W., Cao, J., Li, S., Yuan, Y., & Lan, R. (2026) · SSRN Electronic Journal · doi:10.2139/ssrn.7597499
Lee, J., Cho, N., & Lee, K. (2026) · ISPRS International Journal of Geo-Information · doi:10.3390/ijgi15100461
A Dual-Stage Vision–Language Framework for Dental Report Generation
Boulesnane, A., Bouart, F., Meshoul, S., Boussalia, R., Batouche, M., Lebeze, I., & Benhamada, I. (2026) · Electronics · doi:10.3390/electronics15204729
Petrova, A., Petrović, I., Berger, M., Kravutske, Y., Leinkauf, J., Rumbak, R., Haider, L., Niess, E., Strasser, B., Bogner, W., et al. (2026) · Journal of Imaging · doi:10.3390/jimaging12100510
Öztekin, F., KATAR, O., Eskibağlar, M., Konuş, F., Atik, M. R., Ozdogan, N., & Baybars, S. C. (2026) · Diagnostics · doi:10.3390/diagnostics16203371
Zhang, T., Jiao, R., Ma, J., Mei, A., Qian, Y., Lv, J., Wang, H., & Jiang, Y. (2026) · Automated Software Engineering · doi:10.1007/s10515-026-00680-3
Alalwany, E., & Alsharif, B. (2026) · Diagnostics · doi:10.3390/diagnostics16203378
Automated spheroid and organoid image analysis from rule-based methods to deep learning
Ncube, K. N., van den Bout, I., & Cordier, W. (2026) · SLAS DISCOVERY · doi:10.1016/j.slasd.2026.100344
Miao, Y., Zheng, F., Hong, N., & Yin, P. (2026) · Medicine Plus · doi:10.1016/j.medp.2026.100175
Ding, W., Zhou, Y., Duan, H., Sun, H., & Bai, Z. (2026) · Journal of Marine Science and Engineering · doi:10.3390/jmse14211982
Elkachachi, K., Alaoui, M. H. E. Y., & Jbari, A. (2026) · BioMedInformatics · doi:10.3390/biomedinformatics6050095
Aras, E. (2026) · International Artificial Intelligence and Data Processing Symposium (IDAP) · doi:10.1109/idap71869.2026.11728131
M'jikou, A., Lahouze, F., Omari, A., Ahmadi-Sénichault, A., Gaborieau, C., Liu, S., Caty, O., King, A., & Lachaud, J. (2026) · Chemical Engineering Journal · doi:10.1016/j.cej.2026.183034
Cassidy, R., Razzaq, S., Howell, A., Leiva‐Juárez, M. M., & Schumacher, L. (2026) · Cancers · doi:10.3390/cancers18213438
Study of Overlap-Preserving Multi-Label Semantic Segmentation for Visual Bridge Inspection
Ma, S., Qiao, L., & Li, Q. (2026) · Applied Sciences · doi:10.3390/app162110630
Limitations of clDice for Evaluating Pancreatic Duct Segmentation in CT
Adhikary, S., Chabi, N., & Mastmeyer, A. (2026) · Tomography · doi:10.3390/tomography12110155
Kairat, Z., Zhaksylyk, T., Abdikenov, B., Makhanov, N., & Faizullin, A. (2026) · Journal of Imaging · doi:10.3390/jimaging12110537
Lv, J., Zhang, Q., Liao, Z., Guo, W., Zheng, S., & Lyu, Y. (2026) · Bioengineering · doi:10.3390/bioengineering13111288
Metrics reloaded: Recommendations for image analysis validation
Maier-Hein, L., Reinke, A., Godau, P., Tizabi, M. D., Buettner, F., Christodoulou, E., Glocker, B., Isensee, F., Kleesiek, J., Kozubek, M., et al. (2022) · arXiv · doi:10.48550/arxiv.2206.01653 · Cited by 59
Self-citation
Metadata
- Authors
- Reinke, A., Tizabi, M. D., Baumgartner, M., Eisenmann, M., Heckmann-Nötzel, D., Kavur, A. E., Rädsch, T., Sudre, C. H., Acion, L., Antonelli, M., Arbel, T., Bakas, S., Benis, A., Buettner, F., Cardoso, M. J., Cheplygina, V., Chen, J., Christodoulou, E., Cimini, B. A., Farahani, K., Ferrer, L., Galdran, A., van Ginneken, B., Glocker, B., Godau, P., Hashimoto, D. A., Hoffman, M. M., Huisman, M., Isensee, F., Jannin, P., Kahn, C. E., Kainmueller, D., Kainz, B., Karargyris, A., Kleesiek, J., Kofler, F., Kooi, T., Kopp-Schneider, A., Kozubek, M., Kreshuk, A., Kurc, T., Landman, B. A., Litjens, G., Madani, A., Maier-Hein, K., Martel, A. L., Meijering, E., Menze, B., Moons, K. G. M., Müller, H., Nichyporuk, B., Nickel, F., Petersen, J., Rafelski, S. M., Rajpoot, N., Reyes, M., Riegler, M. A., Rieke, N., Saez-Rodriguez, J., Sánchez, C. I., Shetty, S., Summers, R. M., Taha, A. A., Tiulpin, A., Tsaftaris, S. A., Van Calster, B., Varoquaux, G., Yaniv, Z. R., Jäger, P. F., & Maier-Hein, L.
- Affiliations
- German Cancer Research Center (DE)
- King's College London (GB)
- Mila - Quebec Artificial Intelligence Institute (CA)
- Indiana University Indianapolis (US)
- Holon Institute of Technology (IL)
- Goethe University Frankfurt (DE)
- IT University of Copenhagen (DK)
- Leibniz Institute for Analytical Sciences - ISAS (DE)
- Broad Institute (US)
- National Cancer Institute (US)
- Consejo Nacional de Investigaciones Científicas y Técnicas (AR)
- Radboud University Medical Center (NL)
- Imperial College London (GB)
- University of Pennsylvania (US)
- University Health Network (CA)
- Inserm (FR)
- University of Potsdam (DE)
- Friedrich-Alexander-Universität Erlangen-Nürnberg (DE)
- Institut de Chirurgie Guidée par l'Image (FR)
- Essen University Hospital (DE)
- Lunit (South Korea) (KR)
- Masaryk University (CZ)
- European Molecular Biology Laboratory (DE)
- Vanderbilt University (US)
- University of Toronto (CA)
- UNSW Sydney (AU)
- University of Zurich (CH)
- Utrecht University (NL)
- University of Geneva (CH)
- University Medical Center Hamburg-Eppendorf (DE)
- Allen Institute for Cell Science (US)
- University of Warwick (GB)
- University of Bern (CH)
- Simula Metropolitan Center for Digital Engineering (NO)
- Google (United States) (US)
- National Institutes of Health (US)
- TU Wien (AT)
- Oulu University Hospital (FI)
- University of Edinburgh (GB)
- National Institute of Allergy and Infectious Diseases (US)
- Corresponding author
- Reinke, Annika
- Tizabi, Minu D.
- Maier-Hein, Klaus
- Jäger, Paul F.
- ORCID
- Reinke, Annika
- Tizabi, Minu D.
- Baumgartner, Michael
- Eisenmann, Matthias
- Kavur, A. Emre
- Rädsch, Tim
- Sudre, Carole H.
- Acion, Laura
- Antonelli, Michela
- Arbel, Tal
- Bakas, Spyridon
- Benis, Arriel
- Buettner, Florian
- Cardoso, M. Jorge
- Cheplygina, Veronika
- Chen, Jianxu
- Christodoulou, Evangelia
- Cimini, Beth A.
- Farahani, Keyvan
- Ferrer, Luciana
- van Ginneken, Bram
- Glocker, Ben
- Godau, Patrick
- Hashimoto, Daniel A.
- Hoffman, Michael M.
- Huisman, Merel
- Isensee, Fabian
- Jannin, Pierre
- Kahn, Charles E.
- Kainmueller, Dagmar
- Kainz, Bernhard
- Karargyris, Alexandros
- Kleesiek, Jens
- Kofler, Florian
- Kooi, Thijs
- Kopp-Schneider, Annette
- Kozubek, Michal
- Kreshuk, Anna
- Landman, Bennett A.
- Litjens, Geert
- Madani, Amin
- Maier-Hein, Klaus
- Martel, Anne L.
- Meijering, Erik
- Menze, Bjoern
- Moons, Karel G. M.
- Müller, Henning
- Nichyporuk, Brennan
- Nickel, Felix
- Petersen, Jens
- Rafelski, Susanne M.
- Rajpoot, Nasir
- Reyes, Mauricio
- Riegler, Michael A.
- Rieke, Nicola
- Saez-Rodriguez, Julio
- Shetty, Shravya
- Summers, Ronald M.
- Taha, Abdel A.
- Tiulpin, Aleksei
- Tsaftaris, Sotirios A.
- Varoquaux, Gaël
- Yaniv, Ziv R.
- Jäger, Paul F.
- Maier-Hein, Lena
- Venue
- Nature Methods
- Published
- 2024-02
- Volume
- 21
- Issue
- 2
- Pages
- 182-194
- ISSN
- 1548-7091 (ISSN-L)
- 1548-7105
- PMC
- PMC11181963
- OpenAlex
- W4353015179
- Cited by
- 241
- References
- 36
- Citations by year
- 2026: 108 · 2025: 82 · 2024: 48
- FWCI
- 12.21
- Type
- journal article
- Language
- en
- Open access
- bronze
- doi.org
- Licence
- Locations
- Nature Methods (publishedVersion)
- PubMed (publishedVersion)
- UvA-DARE (University of Amsterdam) (acceptedVersion, other-oa)
- PubMed Central (acceptedVersion)
- Warwick Research Archive Portal (University of Warwick) (acceptedVersion)
- Zurich Open Repository and Archive (University of Zurich) (acceptedVersion, cc-by-nc)
- Radboud Repository (Radboud University) (submittedVersion)
- PubMed Central (submittedVersion, cc-by)
- HAL (submittedVersion)
- Universitätsbibliographie, Universität Duisburg-Essen (submittedVersion)
- TECNALIA Publications (Fundación TECNALIA Research & Innovation) (submittedVersion, public-domain)
- ArODES (HES-SO (https://www.hes-so.ch/)) (submittedVersion)
- IRIS eCampus Telematic University (Università degli Studi eCampus) (submittedVersion)
- Lirias (KU Leuven) (submittedVersion)
- Fraunhofer-Publica (Fraunhofer-Gesellschaft) (submittedVersion)
- Pure Amsterdam UMC (submittedVersion, cc-by)
- Amsterdam UMC (VU Amsterdam) - Institutional Repository (submittedVersion, other-oa)
- University of Birmingham Research Portal (University of Birmingham) (submittedVersion)
- Edinburgh Research Explorer (University of Edinburgh) (submittedVersion, cc-by)
- PuSH - Publication Server of Helmholtz Zentrum München (submittedVersion)
- Zurich Open Repository and Archive (University of Zurich) (submittedVersion, cc-by-nc)
- Zurich Open Repository and Archive (University of Zurich)
- Funders
- National Science Foundation (GM135019)
- Silicon Valley Community Foundation (2020-225720)
- Foundation for Cardiovascular Research
- Canadian Institute for Advanced Research
- Wellcome Trust (WT 203148/Z/16/Z), 203148, WT213038/Z/18/Z, 213038)
- Alzheimer's Society (AS‐JF‐17‐011)
- Cancer Research UK (C49297/A27294)
- Royal Academy of Engineering (RCSRF1819\8\25)
- European Commission (101002198, HORIZON2020, 101088594)
- Agence Nationale de la Recherche (ANR-10-IAHU-0002, ANR-10–IAHU-02, ANR-10)
- Schweizerischer Nationalfonds zur Förderung der Wissenschaftlichen Forschung (31274, 27294, 225720, 212939, 205320)
- Bundesministerium für Bildung und Forschung (161L0272)
- Nederlandse Organisatie voor Wetenschappelijk Onderzoek
- Sydäntutkimussäätiö
- Oulun Yliopisto (336449, Profi6 336449)
- Novo Nordisk Fonden (NNF21OC0068816)
- Innosuisse - Schweizerische Agentur für Innovationsförderung
- National Institutes of Health (LM2018129, 5u24ca215109-05, 2020-225720, GM135019)
- Natural Sciences and Engineering Research Council of Canada (rgpin-2022-05134)
- Engineering and Physical Sciences Research Council ([WT203148/Z/16/Z], WT213038/Z/18/Z)
- Centre For Medical Engineering, King’s College London (WT 203148/Z/16/Z)
- National Cancer Institute (U24CA180924, UH3CA225021, UG3CA225021, U24CA215109,, 3U24CA215109-02, U01CA242871, 4UH3-CA225021-03, U24CA279629)
- National Institute of General Medical Sciences (P41GM135019)
- National Institute of Neurological Disorders and Stroke (R01NS042645)
- NIH Clinical Center
- Topics
- Life Sciences › Biochemistry, Genetics and Molecular Biology › Biophysics › Cell Image Analysis Techniques
- Physical Sciences › Computer Science › Computer Vision and Pattern Recognition › Medical Image Segmentation Techniques
- Health Sciences › Medicine › Health Informatics › Artificial Intelligence in Healthcare and Education
- Keywords
- validation metrics, medical image analysis, Delphi consensus, expert consensus, reproducibility
About these checks
Registry, retraction, Cites and statistics results are computed, not judged, with one exception: a printed reference that no index lists is read once by a model before it counts as a citation error. Claims are extracted by a model and kept only when their quote appears verbatim in the text; each cited source is then checked, with a model’s help, for whether it says what the claim relies on. Those verdicts can be wrong — read the claim’s quote and the cited source before relying on one.
Statistics and arithmetic are recomputed, not judged.
Confidence bands are shown only for fields calibrated on our annotated test set. None is calibrated yet, so no band is shown.
What counts as a claim ›How we measure confidence ›How we check this ›
Are you an author, or do you see a problem with this page? Request a review
