

The DOI matches its Crossref record; 86 of the 91 references it cites were found in a registry or an index; 4 of the 35 sources its claims cite were checked for support.
A structural biology community assessment of AlphaFold2 applications
Open accessAbstract
Most proteins fold into 3D structures that determine how they function and orchestrate the biological processes of the cell. Recent developments in computational methods for protein structure predictions have reached the accuracy of experimentally determined models. Although this has been independently verified, the implementation of these methods across structural-biology applications remains to be tested. Here, we evaluate the use of AlphaFold2 (AF2) predictions in the study of characteristic structural elements; the impact of missense variants; function and ligand binding site predictions; modeling of interactions; and modeling of experimental structural data. For 11 proteomes, an average of 25% additional residues can be confidently modeled when compared with homology modeling, identifying structural features rarely seen in the Protein Data Bank. AF2-based predictions of protein disorder and complexes surpass dedicated tools, and AF2 models can be used across diverse applications equally well compared with experimentally determined structures, when the confidence metrics are critically considered. In summary, we find that these advances are likely to have a transformative impact in structural biology and broader life-science research.
Overview
AI snapshot
Written from the paper’s full text.
TL;DR
This community assessment evaluates AlphaFold2 (AF2) across structural-biology applications, including proteome coverage, disorder, variant effects, pockets, complexes, and experimental model building. It finds AF2 models are broadly comparable to experimental structures when confidence metrics are critically considered, while low-confidence regions and some high-confidence details still require caution.
Key findings
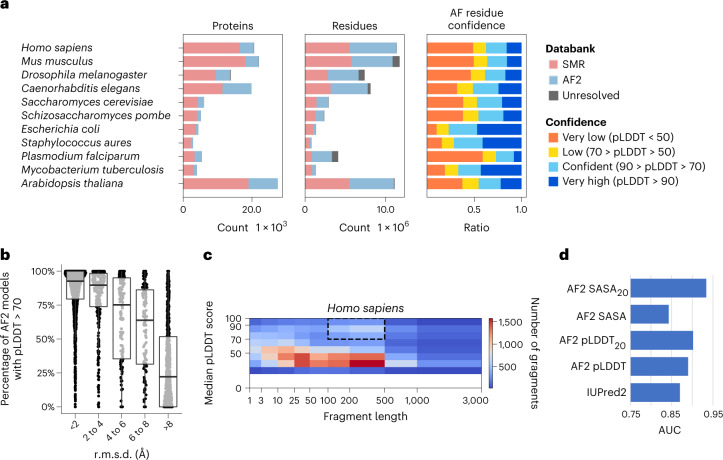
- For 11 proteomes shared with the SWISS-MODEL Repository, AF2 added an average of 44% residue coverage; among residues absent from SMR, 49.4% had pLDDT > 70, and on average around 25% of proteome residues were covered by novel, confident AF2 predictions. Across the 11 species, 18,429 contiguous “domain-like” regions (100–500 residues, pLDDT > 70) had no SMR model.
- AF2-derived disorder metrics (pLDDT and window averages of pLDDT or SASA) outperformed IUPred2. For oligomeric state prediction, 71/87 (82%) top-scoring models matched the correct state; for heterodimeric docking, 31% of AF2 models were correct versus 7% for GRAMM.
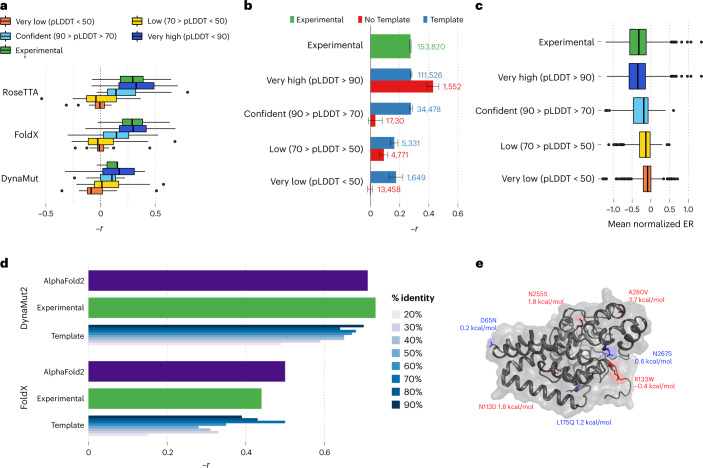
- In variant-effect tests, AF2-based predictions of mutation impact consistently matched or were better than those from experimental models for 117,135 DMS mutations in 33 proteins; stability predictions across 2,648 mutations in 121 proteins were comparable to experimental structures, while homology models degraded below 40% sequence identity.
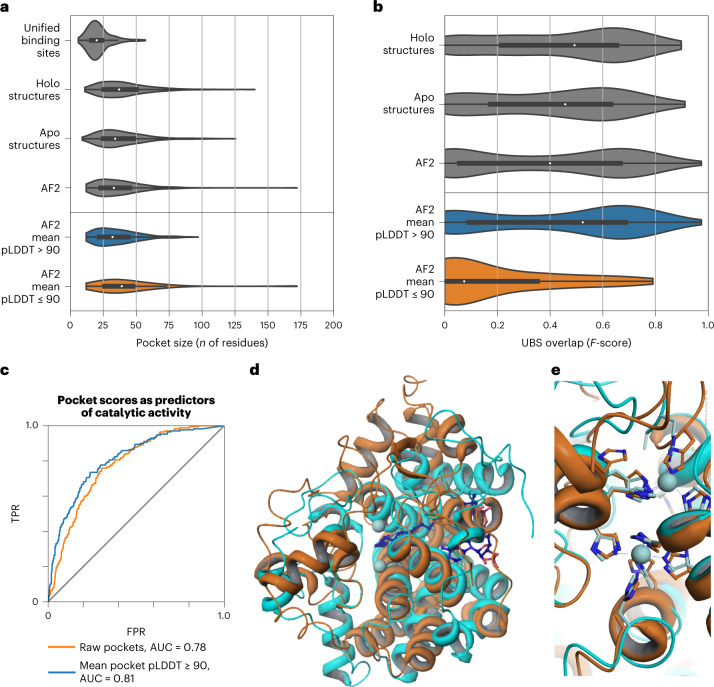
- High-quality AF2 pockets (mean pLDDT > 90) performed similarly to pockets from experimental structures, whereas low-confidence pockets generally did not overlap known sites. AF2 also revealed a novel beta-solenoid for pentapeptide repeats, proposed as the shortest repeat length forming such a structure.
Methods
- The paper is a multi-application benchmark/evaluation study using AF2 predictions from public databases and locally generated models, compared against experimental structures, homology models, SMR, trRosetta/Pfam models, and PDB entries.
- Datasets included 11 model proteomes, 365,198 AF2 proteins, 104,323 PDB proteins, 117,135 DMS mutations in 33 proteins, 2,648 stability mutations in 121 proteins, 225 proteins with known binding sites, 87 oligomeric proteins, 219 heterodimeric complexes, and 14 IDR-containing complexes.
- Analyses used structure-based predictors (FoldX, Rosetta, DynaMut2), disorder benchmarking against IUPred2, Geometricus shape-mers with NMF/t-SNE, AutoSite pocket detection, DockQ for docking, and ISOLDE/phenix for cryo-EM and crystallographic model building.
Limitations
- The paper states that AF2 models can contain uncertainly placed segments, leading to incorrect structural similarity, pocket, variant-effect, or model-building estimates; confidence metrics must be incorporated into workflows. It also notes that even high-confidence regions can contain subtle errors, citing Trp A111 (pLDDT = 86.1) modeled backwards.
- The authors state that low-confidence predictions are enriched for disorder, but caution this may be partly a by-product of AF2 being trained primarily on X-ray data; they also note IUPred2 is not the best-performing dedicated disorder predictor.
- The paper states open questions remain about generalization to truly unseen folds, prediction of mutated protein structures, conformational diversity/dynamics, structure without an MSA, and complexes with DNA, RNA, or metabolites. Evident from the text: several benchmarks rely on specific released databases and curated sets, and some oligomer examples may overlap AF2 training even though the authors argue this still tests oligomeric-state prediction.
Model-written summary. Check it against the paper before relying on it.
Integrity signals
Registry
Cites
Statistics
Figures
Verification
Claims the paper makes
50 Own result · 24 Own interpretation · 23 Not checked yet · 15 No basis given · 2 Supported · 1 Partly supported · 1 Own method · accuracy not yet measured
Every source the paper cites for this claim was checked and supports it.
In the paper
“AF2 has been shown to be able to predict the structure of protein domains with an accuracy matching that of experimental methods.”
§ A structural biology community assessment of AlphaFold2 applications > Main
What the sources say
- Supportedcites [12] Jumper, J. et al. Highly accurate protein structure prediction with AlphaFold. Nature 596, 583–589 (2021). source
The Main section says AlphaFold predicts protein structures to near-experimental accuracy in a majority of cases. It also reports highly accurate domain structures in the CASP14 assessment, supporting the claim that AF2 can achieve this accuracy for protein domains. (LLM, conf=0.91)
plain- Asserted: passes — The authors put it forward as true.
- Checkable: passes — It can be checked against evidence.
- Load-bearing: passes — The paper’s conclusions depend on it.
- Based: passes — The paper gives a reason why it holds.
- Supported
Every source the paper cites for this claim was checked and supports it.
In the paper
“Recent developments in computational methods for protein structure predictions have reached the accuracy of experimentally determined models.”
§ A structural biology community assessment of AlphaFold2 applications > Abstract
What the sources say
- Supportedcites [12] Jumper, J. et al. Highly accurate protein structure prediction with AlphaFold. Nature 596, 583–589 (2021). source
The Main section says AlphaFold predicts protein structures to near-experimental accuracy in a majority of cases. The Abstract likewise reports accuracy competitive with experimental structures in a majority of CASP14 cases, supporting the broad claim about recent computational progress. (LLM, conf=0.90)
plain- Asserted: passes — The authors put it forward as true.
- Checkable: passes — It can be checked against evidence.
- Load-bearing: passes — The paper’s conclusions depend on it.
- Based: passes — The paper gives a reason why it holds.
- Supported
A result the paper reports from its own data — it cites no other source for it, so there is none to check. The quote shows it is in the paper.
In the paper
“For 11 proteomes, an average of 25% additional residues can be confidently modeled when compared with homology modeling, identifying structural features rarely seen in the Protein Data Bank.”
- Also stated in: § Added structural coverage by AlphaFold2 predictions of model proteomes · plain
“In summary, an average of around 25% of the residues of the proteomes of the 11 model species are covered by AF2 with novel (not present in SRM) and confident (pLDDT > 70) predictions.”
§ A structural biology community assessment of AlphaFold2 applications > Abstract
plain- Asserted: passes — The authors put it forward as true.
- Checkable: passes — It can be checked against evidence.
- Load-bearing: passes — The paper’s conclusions depend on it.
- Based: passes — The paper gives a reason why it holds.
- Also stated in: § Added structural coverage by AlphaFold2 predictions of model proteomes · plain
The paper states this without a source or data behind it here, so there is nothing to check it against. The quote shows it is in the paper.
In the paper
“AF2-based predictions of protein disorder and complexes surpass dedicated tools, and AF2 models can be used across diverse applications equally well compared with experimentally determined structures, when the confidence metrics are critically considered.”
§ A structural biology community assessment of AlphaFold2 applications > Abstract
plaindirect- Asserted: passes — The authors put it forward as true.
- Checkable: passes — It can be checked against evidence.
- Load-bearing: passes — The paper’s conclusions depend on it.
- Based: passes — The paper gives a reason why it holds.
A result the paper reports from its own data — it cites no other source for it, so there is none to check. The quote shows it is in the paper.
In the paper
“For 11 proteomes, an average of 25% additional residues can be confidently modeled when compared with homology modeling, identifying structural features rarely seen in the Protein Data Bank.”
§ A structural biology community assessment of AlphaFold2 applications > Abstract
plaindirect- Asserted: passes — The authors put it forward as true.
- Checkable: passes — It can be checked against evidence.
- Load-bearing: passes — The paper’s conclusions depend on it.
- Based: passes — The paper gives a reason why it holds.
A result the paper reports from its own data — it cites no other source for it, so there is none to check. The quote shows it is in the paper.
In the paper
“We compared the structures of 11 model species that were included in both the SMR and AF2 databases and that had an average additional coverage of 44% of residues by AF2 (Fig. 1a, residues).”
§ A structural biology community assessment of AlphaFold2 applications > Results > Added structural coverage by AlphaFold2 predictions of model proteomes
plaindirect- Asserted: passes — The authors put it forward as true.
- Checkable: passes — It can be checked against evidence.
- Load-bearing: passes — The paper’s conclusions depend on it.
- Based: passes — The paper gives a reason why it holds.
A result the paper reports from its own data — it cites no other source for it, so there is none to check. The quote shows it is in the paper.
In the paper
“With a more stringent cut-off (pLDDT > 90), AF2 predicts, on average, 25% of residues with very high confidence.”
§ A structural biology community assessment of AlphaFold2 applications > Results > Added structural coverage by AlphaFold2 predictions of model proteomes
plain- Asserted: passes — The authors put it forward as true.
- Checkable: passes — It can be checked against evidence.
- Load-bearing: unclear — It is unclear whether the paper’s conclusions depend on it.
- Based: passes — The paper gives a reason why it holds.
A result the paper reports from its own data — it cites no other source for it, so there is none to check. The quote shows it is in the paper.
In the paper
“We did not observe a difference between the performance of high-quality AF2 pockets and pockets identified from experimental structures.”
§ A structural biology community assessment of AlphaFold2 applications > Results > Functional characterization of AF2 models by pocket and structural motif prediction
plain- Asserted: passes — The authors put it forward as true.
- Checkable: passes — It can be checked against evidence.
- Load-bearing: passes — The paper’s conclusions depend on it.
- Based: passes — The paper gives a reason why it holds.
A result the paper reports from its own data — it cites no other source for it, so there is none to check. The quote shows it is in the paper.
In the paper
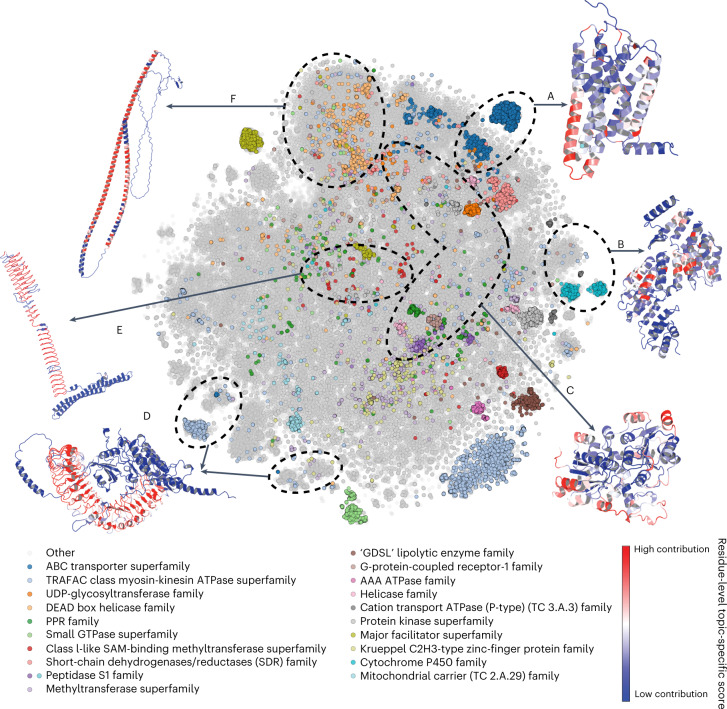
“The clustering identified 250 groups of proteins, dubbed ‘topics’ (Supplementary Dataset 2), with characteristic combinations of shape-mers.”
§ A structural biology community assessment of AlphaFold2 applications > Results > Characterization of structural elements in AlphaFold2’s predicted models across 21 proteomes
plaincorrelational- Asserted: passes — The authors put it forward as true.
- Checkable: passes — It can be checked against evidence.
- Load-bearing: passes — The paper’s conclusions depend on it.
- Based: passes — The paper gives a reason why it holds.
A result the paper reports from its own data — it cites no other source for it, so there is none to check. The quote shows it is in the paper.
In the paper
“Topics 209 and 113 consist of immune response proteins, such as immunoglobulins and T-cell receptors, mainly from the PDB.”
§ A structural biology community assessment of AlphaFold2 applications > Results > Characterization of structural elements in AlphaFold2’s predicted models across 21 proteomes
plain- Asserted: passes — The authors put it forward as true.
- Checkable: passes — It can be checked against evidence.
- Load-bearing: unclear — It is unclear whether the paper’s conclusions depend on it.
- Based: passes — The paper gives a reason why it holds.
- Probably not a substantial claim. 14
- It may state two separate claims as one. 34
- The quote only partly states this claim. 2
The cited sources support only part of this claim — read each source’s verdict below.
In the paper
“However, some reports have indicated that AF2 does not appear to be well suited to predict the structures of mutated proteins54,55.”
§ A structural biology community assessment of AlphaFold2 applications > Discussion
What the sources say
- Partly supportedcites [54] Pak, M. A. et al. Using AlphaFold to predict the impact of single mutations on protein stability and function. Preprint at bioRxiv https://doi.org/10.1101/2021.09.19.460937 (2021). sourceExperimental — accuracy not yet measured
The Discussion (p. not available) says AlphaFold predictions cannot directly and reliably estimate how a mutation affects protein stability or function. The Methods section reports that the authors did model mutant protein structures, but the paper does not establish that AF2 is generally unsuitable for predicting those structures themselves. (LLM, conf=0.84)
- Supportedcites [55] Buel, G. R. & Walters, K. J. Can AlphaFold2 predict the impact of missense mutations on structure? Nat. Struct. Mol. Biol. 29, 1–2 (2022). source
The opening passage says AlphaFold2 falls short in predicting the impact of missense mutations on protein structures. The conclusion likewise says it is largely unable to predict when a point mutation causes defective folding, supporting the citing sentence’s qualified summary. (LLM, conf=0.91)
hedged- Asserted: passes — The authors put it forward as true.
- Checkable: passes — It can be checked against evidence.
- Load-bearing: passes — The paper’s conclusions depend on it.
- Based: passes — The paper gives a reason why it holds.
Probably not a substantial claim.
- Partly supported
In the paper
“p.A280V has been shown to lead to loss of protein stability34 and has a predicted Gibbs free energy change (ΔΔG) of 3.7 kcal/mol.”
§ A structural biology community assessment of AlphaFold2 applications > Results > Application of AlphaFold2 models for structure-based variant effect prediction
What the sources say
- Not checked yetcites [34] Karsai, G. et al. DEGS1-associated aberrant sphingolipid metabolism impairs nervous system function in humans. J. Clin. Invest. 129, 1229–1239 (2019). source
plaindirect- Asserted: passes — The authors put it forward as true.
- Checkable: passes — It can be checked against evidence.
- Load-bearing: passes — The paper’s conclusions depend on it.
- Based: passes — The paper gives a reason why it holds.
It may state two separate claims as one.
The paper states this without a source or data behind it here, so there is nothing to check it against. The quote shows it is in the paper.
In the paper
“Topic 38 consists of short fragments of PDB structures, with an average length of 63 residues—there are no AF2 proteins, because AlphaFold models the entire structure instead of returning fragments.”
§ A structural biology community assessment of AlphaFold2 applications > Results > Characterization of structural elements in AlphaFold2’s predicted models across 21 proteomes
plaindirect- Asserted: passes — The authors put it forward as true.
- Checkable: passes — It can be checked against evidence.
- Load-bearing: unclear — It is unclear whether the paper’s conclusions depend on it.
- Based: passes — The paper gives a reason why it holds.
It may state two separate claims as one.
A result the paper reports from its own data — it cites no other source for it, so there is none to check. The quote shows it is in the paper.
In the paper
“This is also true for pockets predicted from AF2 structures, including a small number of particularly large pockets (Fig. 4a).”
§ A structural biology community assessment of AlphaFold2 applications > Results > Functional characterization of AF2 models by pocket and structural motif prediction
plaincorrelational- Asserted: passes — The authors put it forward as true.
- Checkable: passes — It can be checked against evidence.
- Load-bearing: unclear — It is unclear whether the paper’s conclusions depend on it.
- Based: passes — The paper gives a reason why it holds.
It may state two separate claims as one.
The paper states this without a source or data behind it here, so there is nothing to check it against. The quote shows it is in the paper.
In the paper
“This represents around twice the number of experimental structures and six times the number of unique proteins in the Protein Data Bank (PDB).”
§ A structural biology community assessment of AlphaFold2 applications > Results > Added structural coverage by AlphaFold2 predictions of model proteomes
hedged- Asserted: passes — The authors put it forward as true.
- Checkable: passes — It can be checked against evidence.
- Load-bearing: passes — The paper’s conclusions depend on it.
- Based: passes — The paper gives a reason why it holds.
It may state two separate claims as one.
A result the paper reports from its own data — it cites no other source for it, so there is none to check. The quote shows it is in the paper.
In the paper
“Out of 250 total groups, we selected 5 examples that were almost exclusively (>90%) composed of structures derived from AF2, as well as 1 example with >80% AF2 structures with a particularly interesting novel predicted structural element.”
§ A structural biology community assessment of AlphaFold2 applications > Results > Characterization of structural elements in AlphaFold2’s predicted models across 21 proteomes
plain- Asserted: passes — The authors put it forward as true.
- Checkable: passes — It can be checked against evidence.
- Load-bearing: unclear — It is unclear whether the paper’s conclusions depend on it.
- Based: passes — The paper gives a reason why it holds.
It may state two separate claims as one.
The paper states this without a source or data behind it here, so there is nothing to check it against. The quote shows it is in the paper.
In the paper
“Additionally, the 20 most common superfamilies, predicted from sequence, tend to be placed together.”
§ A structural biology community assessment of AlphaFold2 applications > Results > Characterization of structural elements in AlphaFold2’s predicted models across 21 proteomes
plaincorrelational- Asserted: passes — The authors put it forward as true.
- Checkable: passes — It can be checked against evidence.
- Load-bearing: unclear — It is unclear whether the paper’s conclusions depend on it.
- Based: passes — The paper gives a reason why it holds.
The quote only partly states this claim.
A result the paper reports from its own data — it cites no other source for it, so there is none to check. The quote shows it is in the paper.
In the paper
“pLDDT and window averages of pLDDT or SASA outperformed IUPred2, indicating that AF2’s low-confidence predictions are enriched for IDRs.”
§ A structural biology community assessment of AlphaFold2 applications > Results > Added structural coverage by AlphaFold2 predictions of model proteomes
hedgedcorrelational- Asserted: passes — The authors put it forward as true.
- Checkable: passes — It can be checked against evidence.
- Load-bearing: passes — The paper’s conclusions depend on it.
- Based: passes — The paper gives a reason why it holds.
It may state two separate claims as one.
A result the paper reports from its own data — it cites no other source for it, so there is none to check. The quote shows it is in the paper.
In the paper
“Low-quality pockets are larger on average, and include particularly large pockets (Fig. 4a, bottom).”
§ A structural biology community assessment of AlphaFold2 applications > Results > Functional characterization of AF2 models by pocket and structural motif prediction
plaincorrelational- Asserted: passes — The authors put it forward as true.
- Checkable: passes — It can be checked against evidence.
- Load-bearing: unclear — It is unclear whether the paper’s conclusions depend on it.
- Based: passes — The paper gives a reason why it holds.
It may state two separate claims as one.
The paper states this without a source or data behind it here, so there is nothing to check it against. The quote shows it is in the paper.
In the paper
“As many of these antibodies are under intense study, there are many more PDB structures (based on multiple individuals and antibody-drug research) than the actual number of such proteins in the respective UniProt proteomes.”
§ A structural biology community assessment of AlphaFold2 applications > Results > Characterization of structural elements in AlphaFold2’s predicted models across 21 proteomes
plaindirect- Asserted: passes — The authors put it forward as true.
- Checkable: passes — It can be checked against evidence.
- Load-bearing: unclear — It is unclear whether the paper’s conclusions depend on it.
- Based: passes — The paper gives a reason why it holds.
It may state two separate claims as one.
In the paper
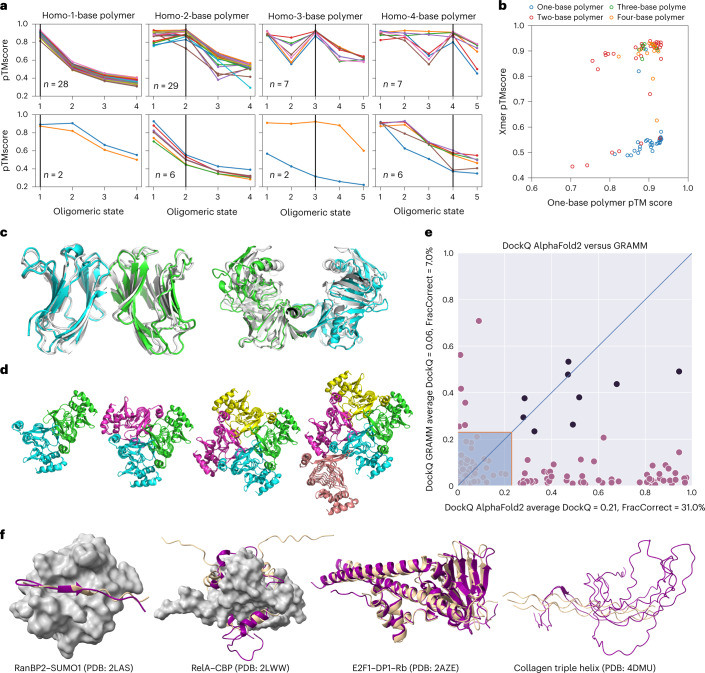
“In Figure 5e, it can be seen that the performance is far superior to traditional docking methods, with 31% of correctly predicted protein complex models, compared with 7% using GRAMM, a standard shape-complementarity docking method44.”
§ A structural biology community assessment of AlphaFold2 applications > Results > AlphaFold2-based prediction of protein complex structures
What the sources say
- Not checked yetcites [44] Tovchigrechko, A., Wells, C. A. & Vakser, I. A. Docking of protein models. Protein Sci. 11, 1888–1896 (2002). source
plaindirect- Asserted: passes — The authors put it forward as true.
- Checkable: passes — It can be checked against evidence.
- Load-bearing: passes — The paper’s conclusions depend on it.
- Based: passes — The paper gives a reason why it holds.
It may state two separate claims as one.
A result the paper reports from its own data — it cites no other source for it, so there is none to check. The quote shows it is in the paper.
In the paper
“For the RelA–CBP interaction, AF2 correctly finds the binding groove, but fits the IDR in a reverse orientation.”
§ A structural biology community assessment of AlphaFold2 applications > Results > AlphaFold2-based prediction of protein complex structures
plainSingle case- Asserted: passes — The authors put it forward as true.
- Checkable: passes — It can be checked against evidence.
- Load-bearing: unclear — It is unclear whether the paper’s conclusions depend on it.
- Based: passes — The paper gives a reason why it holds.
It may state two separate claims as one.
A result the paper reports from its own data — it cites no other source for it, so there is none to check. The quote shows it is in the paper.
In the paper
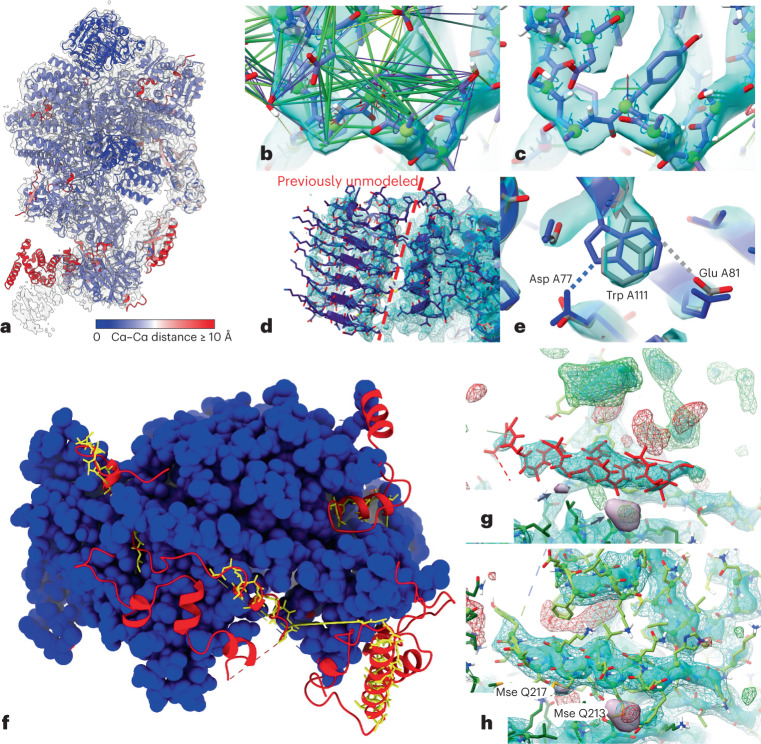
“The total time spent was approximately one working day; the final model (Fig. 6f–h) increased the number of modeled, identified residues from 600 to 818, slightly improved overall geometry and reduced the Rfree from 0.317 to 0.295.”
§ A structural biology community assessment of AlphaFold2 applications > Results > Evaluation of AlphaFold2 models for use in experimental model building
plaindirectSingle case- Asserted: passes — The authors put it forward as true.
- Checkable: passes — It can be checked against evidence.
- Load-bearing: passes — The paper’s conclusions depend on it.
- Based: passes — The paper gives a reason why it holds.
It may state two separate claims as one.
A result the paper reports from its own data — it cites no other source for it, so there is none to check. The quote shows it is in the paper.
In the paper
“We noted that, for some cases of failed tetramer predictions, we could obtain higher confidence of the tetramer predictions by increasing the number of recycles.”
§ A structural biology community assessment of AlphaFold2 applications > Results > AlphaFold2-based prediction of protein complex structures
hedgedconditional- Asserted: passes — The authors put it forward as true.
- Checkable: passes — It can be checked against evidence.
- Load-bearing: fails — The paper’s conclusions may not depend on it.
- Based: passes — The paper gives a reason why it holds.
Probably not a substantial claim. The paper’s conclusions may not depend on it.
A result the paper reports from its own data — it cites no other source for it, so there is none to check. The quote shows it is in the paper.
In the paper
“Rigid-body alignment of AF2 models to their corresponding experimental chains (Fig. 6a) showed overall excellent agreement, with the largest deviations corresponding to correctly folded domains with flexible connections to their neighbors.”
§ A structural biology community assessment of AlphaFold2 applications > Results > Evaluation of AlphaFold2 models for use in experimental model building
plaincorrelationalSingle case- Asserted: passes — The authors put it forward as true.
- Checkable: passes — It can be checked against evidence.
- Load-bearing: passes — The paper’s conclusions depend on it.
- Based: passes — The paper gives a reason why it holds.
It may state two separate claims as one.
A result the paper reports from its own data — it cites no other source for it, so there is none to check. The quote shows it is in the paper.
In the paper
“we focused on the human sphingolipid delta(4)-desaturase (EC 1.14.19.17, DEGS1, UniProt Accession O15121, pocket score rank 57 of 912), which has a high confidence level (average pLDDT = 96.31) and for which there are no previous structural data.”
§ A structural biology community assessment of AlphaFold2 applications > Results > Functional characterization of AF2 models by pocket and structural motif prediction
plainSingle case- Asserted: passes — The authors put it forward as true.
- Checkable: passes — It can be checked against evidence.
- Load-bearing: passes — The paper’s conclusions depend on it.
- Based: passes — The paper gives a reason why it holds.
It may state two separate claims as one.
A result the paper reports from its own data — it cites no other source for it, so there is none to check. The quote shows it is in the paper.
In the paper
“We found that the prediction score of the highest ranked pocket enriched the set for proteins with previous annotations for enzymatic activity (Fig. 4c and Supplementary Table 3).”
§ A structural biology community assessment of AlphaFold2 applications > Results > Functional characterization of AF2 models by pocket and structural motif prediction
plaincorrelational- Asserted: passes — The authors put it forward as true.
- Checkable: passes — It can be checked against evidence.
- Load-bearing: passes — The paper’s conclusions depend on it.
- Based: passes — The paper gives a reason why it holds.
The quote only partly states this claim.
The paper states this without a source or data behind it here, so there is nothing to check it against. The quote shows it is in the paper.
In the paper
“Although AF2 returns full protein predictions, these can often contain protein segments that are placed with uncertainty.”
§ A structural biology community assessment of AlphaFold2 applications > Discussion
plain- Asserted: passes — The authors put it forward as true.
- Checkable: passes — It can be checked against evidence.
- Load-bearing: passes — The paper’s conclusions depend on it.
- Based: passes — The paper gives a reason why it holds.
It may state two separate claims as one.
A result the paper reports from its own data — it cites no other source for it, so there is none to check. The quote shows it is in the paper.
In the paper
“A sequence search of the 323-residue protein against all existing entries in the PDB shows that the best sequence match is 23.5%, with PDB entry 1VHB (Bacterial dimeric hemoglobin, 9115439), indicating the lack of any structural models from homology.”
§ A structural biology community assessment of AlphaFold2 applications > Results > Functional characterization of AF2 models by pocket and structural motif prediction
hedgeddirectSingle case- Asserted: passes — The authors put it forward as true.
- Checkable: passes — It can be checked against evidence.
- Load-bearing: passes — The paper’s conclusions depend on it.
- Based: passes — The paper gives a reason why it holds.
It may state two separate claims as one.
A result the paper reports from its own data — it cites no other source for it, so there is none to check. The quote shows it is in the paper.
In the paper
“Notably, although the failure rate is high for tetramer state predictions, the predicted structure for the corresponding state was actually correct for 5/6 failures.”
§ A structural biology community assessment of AlphaFold2 applications > Results > AlphaFold2-based prediction of protein complex structures
plain- Asserted: passes — The authors put it forward as true.
- Checkable: passes — It can be checked against evidence.
- Load-bearing: unclear — It is unclear whether the paper’s conclusions depend on it.
- Based: passes — The paper gives a reason why it holds.
It may state two separate claims as one.
A result the paper reports from its own data — it cites no other source for it, so there is none to check. The quote shows it is in the paper.
In the paper
“Across the set of predictions, higher scores were given to models corresponding to the correct oligomerization state, and 71 out of 87 (82%) predicted top-scoring models corresponded to the correct state (Fig. 5a and Supplementary Table 4).”
§ A structural biology community assessment of AlphaFold2 applications > Results > AlphaFold2-based prediction of protein complex structures
plaincorrelational- Asserted: passes — The authors put it forward as true.
- Checkable: passes — It can be checked against evidence.
- Load-bearing: passes — The paper’s conclusions depend on it.
- Based: passes — The paper gives a reason why it holds.
It may state two separate claims as one.
The paper states this without a source or data behind it here, so there is nothing to check it against. The quote shows it is in the paper.
In the paper
“As an example, we have identified to our knowledge the shortest length of repeat that forms a beta-solenoid to date.”
§ A structural biology community assessment of AlphaFold2 applications > Discussion
hedged- Asserted: passes — The authors put it forward as true.
- Checkable: passes — It can be checked against evidence.
- Load-bearing: fails — The paper’s conclusions may not depend on it.
- Based: fails — The paper may give no reason why it holds.
Probably not a substantial claim. The paper’s conclusions may not depend on it. The paper may give no reason why it holds.
In the paper
“The AF2 database has released predictions of the canonical protein isoforms for 21 model species, covering nearly every residue in 365,198 proteins.”
§ A structural biology community assessment of AlphaFold2 applications > Results > Added structural coverage by AlphaFold2 predictions of model proteomes
What the sources say
- Not checked yetcites [13] Tunyasuvunakool, K. et al. Highly accurate protein structure prediction for the human proteome. Nature 596, 590–596 (2021). source
plain- Asserted: passes — The authors put it forward as true.
- Checkable: passes — It can be checked against evidence.
- Load-bearing: passes — The paper’s conclusions depend on it.
- Based: passes — The paper gives a reason why it holds.
It may state two separate claims as one.
In the paper
“This is in line with previous findings that core variant changes in particular lead to loss of stability, whereas surface variants are more likely to act through other mechanisms30.”
§ A structural biology community assessment of AlphaFold2 applications > Results > Application of AlphaFold2 models for structure-based variant effect prediction
What the sources say
- Not checked yetcites [30] Høie, M. H., Cagiada, M., Beck Frederiksen, A. H., Stein, A. & Lindorff-Larsen, K. Predicting and interpreting large-scale mutagenesis data using analyses of protein stability and conservation. Cell Rep. 38, 110207 (2022). source
plaindirect- Asserted: passes — The authors put it forward as true.
- Checkable: passes — It can be checked against evidence.
- Load-bearing: unclear — It is unclear whether the paper’s conclusions depend on it.
- Based: passes — The paper gives a reason why it holds.
It may state two separate claims as one.
A conclusion the paper draws from its own results — it cites no other source for it, so there is none to check. The quote shows it is in the paper.
In the paper
“The likely pathogenic variant p.R133W is not predicted to affect stability, and hence likely has a different mechanism underlying disease.”
§ A structural biology community assessment of AlphaFold2 applications > Results > Application of AlphaFold2 models for structure-based variant effect prediction
hedged- Asserted: passes — The authors put it forward as true.
- Checkable: passes — It can be checked against evidence.
- Load-bearing: passes — The paper’s conclusions depend on it.
- Based: passes — The paper gives a reason why it holds.
It may state two separate claims as one.
A conclusion the paper draws from its own results — it cites no other source for it, so there is none to check. The quote shows it is in the paper.
In the paper
“However, the full protein models produced by AF2 have to be considered carefully given their potential errors, such as the likely incorrect placement of protein segments of low confidence or the low confidence in interdomain orientations.”
§ A structural biology community assessment of AlphaFold2 applications > Results > Functional characterization of AF2 models by pocket and structural motif prediction
hedged- Asserted: passes — The authors put it forward as true.
- Checkable: passes — It can be checked against evidence.
- Load-bearing: passes — The paper’s conclusions depend on it.
- Based: passes — The paper gives a reason why it holds.
Probably not a substantial claim.
None of the sources cited for this claim have been checked yet.
In the paper
“it has been shown recently that contact predictions can be used to simultaneously fold and dock proteins17, and early reports have indicated that AF2 can predict the structure of complexes18–20, which it was not initially trained to handle.”
§ A structural biology community assessment of AlphaFold2 applications > Main
What the sources say
- Not checked yetcites [17] Pozzati, G. et al. Limits and potential of combined folding and docking. Bioinformatics 38, 954–961 (2021). source
- Not checked yetcites [18] Ko, J. & Lee, J. Can AlphaFold2 predict protein-peptide complex structures accurately? Preprint at bioRxiv https://doi.org/10.1101/2021.07.27.453972 (2021). source
- Not checked yetcites [19] Mirdita, M. et al. ColabFold: making protein folding accessible to all. Nat. Methods 19, 679–682 (2022). source
- Not checked yetcites [20] Bryant, P., Pozzati, G. & Elofsson, A. Improved prediction of protein-protein interactions using AlphaFold2. Nat. Commun. 13, 1265 (2022).
hedgeddirect- Asserted: passes — The authors put it forward as true.
- Checkable: passes — It can be checked against evidence.
- Load-bearing: fails — The paper’s conclusions may not depend on it.
- Based: passes — The paper gives a reason why it holds.
Probably not a substantial claim. The paper’s conclusions may not depend on it. It may state two separate claims as one.
None of the sources cited for this claim have been checked yet.
In the paper
“previous attempts to generate ‘proteome-wide’ structural models include those based on homology models, such as the SWISS-MODEL Repository (SMR)14, and more recently, the modeling of known protein domains in the Pfam database15 using trRosetta16.”
§ A structural biology community assessment of AlphaFold2 applications > Main
What the sources say
- Not checked yetcites [14] Bienert, S. et al. The SWISS-MODEL Repository—new features and functionality. Nucleic Acids Res. 45, D313–D319 (2017). source
- Not checked yetcites [15] Mistry, J. et al. Pfam: The protein families database in 2021. Nucleic Acids Res. 49, D412–D419 (2021). source
- Not checked yetcites [16] Yang, J. et al. Improved protein structure prediction using predicted interresidue orientations. Proc. Natl Acad. Sci. USA 117, 1496–1503 (2020). source
plain- Asserted: passes — The authors put it forward as true.
- Checkable: passes — It can be checked against evidence.
- Load-bearing: unclear — It is unclear whether the paper’s conclusions depend on it.
- Based: passes — The paper gives a reason why it holds.
It may state two separate claims as one.
A conclusion the paper draws from its own results — it cites no other source for it, so there is none to check. The quote shows it is in the paper.
In the paper
“Around half the residues in AF2 predictions of the 11 model species are of low confidence, many of which may correspond to regions without a well-defined structure in isolation.”
§ A structural biology community assessment of AlphaFold2 applications > Results > Added structural coverage by AlphaFold2 predictions of model proteomes
hedgedcorrelational- Asserted: passes — The authors put it forward as true.
- Checkable: passes — It can be checked against evidence.
- Load-bearing: passes — The paper’s conclusions depend on it.
- Based: passes — The paper gives a reason why it holds.
It may state two separate claims as one.
In the paper
“it is noteworthy that the platform provides metrics of uncertainty12 that have been shown to reflect confidence in the structural assignment—potentially linked to protein disorder—and uncertainty for pair-wise residue distances.”
§ A structural biology community assessment of AlphaFold2 applications > Main
What the sources say
- Not checked yetcites [12] Jumper, J. et al. Highly accurate protein structure prediction with AlphaFold. Nature 596, 583–589 (2021). source
plaincorrelational- Asserted: passes — The authors put it forward as true.
- Checkable: passes — It can be checked against evidence.
- Load-bearing: passes — The paper’s conclusions depend on it.
- Based: passes — The paper gives a reason why it holds.
It may state two separate claims as one.
A conclusion the paper draws from its own results — it cites no other source for it, so there is none to check. The quote shows it is in the paper.
In the paper
“Although there may be bias because high-confidence AF2 regions are more likely to have relevant deposited templates, we suggest that the mean pLDDT of predicted pockets can be used as an additional criterion for pocket selection in AF2 structures.”
§ A structural biology community assessment of AlphaFold2 applications > Results > Functional characterization of AF2 models by pocket and structural motif prediction
hedged- Asserted: passes — The authors put it forward as true.
- Checkable: passes — It can be checked against evidence.
- Load-bearing: passes — The paper’s conclusions depend on it.
- Based: passes — The paper gives a reason why it holds.
Probably not a substantial claim.
A conclusion the paper draws from its own results — it cites no other source for it, so there is none to check. The quote shows it is in the paper.
In the paper
“Two additional pathogenic variants have ΔΔG values of >1.5 kcal/mol, pointing towards loss of stability being the mechanism of pathogenicity; the benign variants do not substantially affect protein stability, as expected (Fig. 3e).”
§ A structural biology community assessment of AlphaFold2 applications > Results > Application of AlphaFold2 models for structure-based variant effect prediction
hedgedconditional- Asserted: passes — The authors put it forward as true.
- Checkable: passes — It can be checked against evidence.
- Load-bearing: passes — The paper’s conclusions depend on it.
- Based: passes — The paper gives a reason why it holds.
It may state two separate claims as one.
A conclusion the paper draws from its own results — it cites no other source for it, so there is none to check. The quote shows it is in the paper.
In the paper
“However, we note that the protein disordered regions are often defined as regions that are not solved by X-ray crystallography. As AF2 is trained primarily on X-ray data, the relation between disorder and predicted confidence could be a by-product of using this definition of disorder.”
§ A structural biology community assessment of AlphaFold2 applications > Discussion
hedgedconditional- Asserted: passes — The authors put it forward as true.
- Checkable: passes — It can be checked against evidence.
- Load-bearing: fails — The paper’s conclusions may not depend on it.
- Based: passes — The paper gives a reason why it holds.
Probably not a substantial claim. The paper’s conclusions may not depend on it.
- Rests on an assumption: AF2 is trained primarily on X-ray data.
- Rests on an assumption: Protein disordered regions are often defined as regions that are not solved by X-ray crystallography.
In the paper
“Originally solved using selenomethionine experimental phasing, the combination of low-resolution and anisotropy (ΔB = 80 Å2) meant that, although the core of the complex was confidently and correctly modeled, only 583 out of 850 total residues were definitively modeled by the authors, with a further 65 residues traced as unknown sequence and one peripheral 27-residue helix modeled out of register.”
§ A structural biology community assessment of AlphaFold2 applications > Results > Evaluation of AlphaFold2 models for use in experimental model building
What the sources say
- Not checked yetcites [50] Taschner, M. et al. Nse5/6 inhibits the Smc5/6 ATPase and modulates DNA substrate binding. EMBO J. 40, e107807 (2021). source
plaindirectSingle case- Asserted: passes — The authors put it forward as true.
- Checkable: passes — It can be checked against evidence.
- Load-bearing: passes — The paper’s conclusions depend on it.
- Based: passes — The paper gives a reason why it holds.
It may state two separate claims as one.
A conclusion the paper draws from its own results — it cites no other source for it, so there is none to check. The quote shows it is in the paper.
In the paper
“In summary, we find that AF2 models, when their uncertainty is taken into account, can be applied to existing structural biology challenges, and their quality is near that of experimental models.”
§ A structural biology community assessment of AlphaFold2 applications > Discussion
plaincorrelational- Asserted: passes — The authors put it forward as true.
- Checkable: passes — It can be checked against evidence.
- Load-bearing: passes — The paper’s conclusions depend on it.
- Based: passes — The paper gives a reason why it holds.
It may state two separate claims as one.
In the paper
“Since the first development of direct coupling analysis algorithms, co-evolutionary-information-based methods have been used to predict protein-protein interactions40.”
§ A structural biology community assessment of AlphaFold2 applications > Results > AlphaFold2-based prediction of protein complex structures
What the sources say
- Not checked yetcites [40] Weigt, M., White, R. A., Szurmant, H., Hoch, J. A. & Hwa, T. Identification of direct residue contacts in protein-protein interaction by message passing. Proc. Natl Acad. Sci. USA 106, 67–72 (2009). source
plaindirect- Asserted: passes — The authors put it forward as true.
- Checkable: passes — It can be checked against evidence.
- Load-bearing: fails — The paper’s conclusions may not depend on it.
- Based: passes — The paper gives a reason why it holds.
Probably not a substantial claim. The paper’s conclusions may not depend on it.
In the paper
“This was not included in the AF2 training set, and no existing structures have ≥30% identity to either chain.”
§ A structural biology community assessment of AlphaFold2 applications > Results > Evaluation of AlphaFold2 models for use in experimental model building
What the sources say
- Not checked yetcites [50] Taschner, M. et al. Nse5/6 inhibits the Smc5/6 ATPase and modulates DNA substrate binding. EMBO J. 40, e107807 (2021). source
plainSingle case- Asserted: passes — The authors put it forward as true.
- Checkable: passes — It can be checked against evidence.
- Load-bearing: passes — The paper’s conclusions depend on it.
- Based: passes — The paper gives a reason why it holds.
It may state two separate claims as one.
In the paper
“These advances have led to the recent leap in performance demonstrated by Deepmind at CASP14 (ref. 12).”
§ A structural biology community assessment of AlphaFold2 applications > Main
What the sources say
- Not checked yetcites [12] Jumper, J. et al. Highly accurate protein structure prediction with AlphaFold. Nature 596, 583–589 (2021). source
boosteddirect- Asserted: passes — The authors put it forward as true.
- Checkable: passes — It can be checked against evidence.
- Load-bearing: fails — The paper’s conclusions may not depend on it.
- Based: passes — The paper gives a reason why it holds.
Probably not a substantial claim. The paper’s conclusions may not depend on it.
None of the sources cited for this claim have been checked yet.
In the paper
“It has been recently reported that several deep-learning-based methods, such as trRosetta16 and Raptor-X41, can predict the structure of protein complexes.”
§ A structural biology community assessment of AlphaFold2 applications > Results > AlphaFold2-based prediction of protein complex structures
What the sources say
- Not checked yetcites [16] Yang, J. et al. Improved protein structure prediction using predicted interresidue orientations. Proc. Natl Acad. Sci. USA 117, 1496–1503 (2020). source
- Not checked yetcites [41] Jing, X., Zeng, H., Wang, S. & Xu, J. A web-based protocol for interprotein contact prediction by deep learning. Methods Mol. Biol. 2074, 67–80 (2020). source
plaindirect- Asserted: passes — The authors put it forward as true.
- Checkable: passes — It can be checked against evidence.
- Load-bearing: fails — The paper’s conclusions may not depend on it.
- Based: passes — The paper gives a reason why it holds.
Probably not a substantial claim. The paper’s conclusions may not depend on it.
A conclusion the paper draws from its own results — it cites no other source for it, so there is none to check. The quote shows it is in the paper.
In the paper
“However, even for residues that can be modeled by distant homology, it is possible that the AF2 models are more accurate, increasing their usefulness.”
§ A structural biology community assessment of AlphaFold2 applications > Discussion
hedgedconditional- Asserted: passes — The authors put it forward as true.
- Checkable: passes — It can be checked against evidence.
- Load-bearing: fails — The paper’s conclusions may not depend on it.
- Based: fails — The paper may give no reason why it holds.
Probably not a substantial claim. The paper’s conclusions may not depend on it. The paper may give no reason why it holds. It may state two separate claims as one.
In the paper
“Both the method and a database of 365,198 protein models have been released13”
§ A structural biology community assessment of AlphaFold2 applications > Main
What the sources say
- Not checked yetcites [13] Tunyasuvunakool, K. et al. Highly accurate protein structure prediction for the human proteome. Nature 596, 590–596 (2021). source
plain- Asserted: passes — The authors put it forward as true.
- Checkable: passes — It can be checked against evidence.
- Load-bearing: fails — The paper’s conclusions may not depend on it.
- Based: passes — The paper gives a reason why it holds.
Probably not a substantial claim. The paper’s conclusions may not depend on it. It may state two separate claims as one.
A conclusion the paper draws from its own results — it cites no other source for it, so there is none to check. The quote shows it is in the paper.
In the paper
“We estimate that AF2 may add, on average, around 25% of confidently predicted residues to a given proteome, although this will vary depending on how much experimental and previous computational approaches have already covered.”
§ A structural biology community assessment of AlphaFold2 applications > Discussion
hedgedconditional- Asserted: passes — The authors put it forward as true.
- Checkable: passes — It can be checked against evidence.
- Load-bearing: passes — The paper’s conclusions depend on it.
- Based: unclear — It is unclear why the paper says it holds.
It may state two separate claims as one.
A conclusion the paper draws from its own results — it cites no other source for it, so there is none to check. The quote shows it is in the paper.
In the paper
“Finally, we explored the application of AlphaFold2 for prediction of complex structures and found that it outcompetes standard docking approaches while not requiring even starting protein structures.”
§ A structural biology community assessment of AlphaFold2 applications > Discussion
plaindirect- Asserted: passes — The authors put it forward as true.
- Checkable: passes — It can be checked against evidence.
- Load-bearing: passes — The paper’s conclusions depend on it.
- Based: passes — The paper gives a reason why it holds.
It may state two separate claims as one.
A conclusion the paper draws from its own results — it cites no other source for it, so there is none to check. The quote shows it is in the paper.
In the paper
“In addition, low AF2 prediction scores are enriched for protein disorder, suggesting that regions of low-confidence predictions can be hypothesized to be disordered segments.”
§ A structural biology community assessment of AlphaFold2 applications > Discussion
hedgedcorrelational- Asserted: passes — The authors put it forward as true.
- Checkable: passes — It can be checked against evidence.
- Load-bearing: passes — The paper’s conclusions depend on it.
- Based: passes — The paper gives a reason why it holds.
Probably not a substantial claim.
What the paper did — it cites no source for this, so there is none to check. The quote shows it is in the paper.
In the paper
“For comparison purposes, all the analyses and results presented here are based on the subset of 17,006 protein sequences for which the ENSEMBL and AlphaFold protein sequences were identical.”
§ A structural biology community assessment of AlphaFold2 applications > Methods > Comparison between human RoseTTAFold Pfam domain and AlphaFold2 structures
plain- Asserted: passes — The authors put it forward as true.
- Checkable: passes — It can be checked against evidence.
- Load-bearing: passes — The paper’s conclusions depend on it.
- Based: passes — The paper gives a reason why it holds.
Probably not a substantial claim.
A conclusion the paper draws from its own results — it cites no other source for it, so there is none to check. The quote shows it is in the paper.
In the paper
“For model building based on experimental data, we noted examples of cases for which details were incorrect in regions where AF2 has high confidence, which underlies the need for detailed manual inspection.”
§ A structural biology community assessment of AlphaFold2 applications > Discussion
plaindirect- Asserted: passes — The authors put it forward as true.
- Checkable: passes — It can be checked against evidence.
- Load-bearing: passes — The paper’s conclusions depend on it.
- Based: passes — The paper gives a reason why it holds.
It may state two separate claims as one.
A conclusion the paper draws from its own results — it cites no other source for it, so there is none to check. The quote shows it is in the paper.
In the paper
“Because AF2’s training was done only on single chains, we reasoned that examples, even if they overlap with the training set, could be used to evaluate AF2’s oligomeric state prediction capabilities.”
§ A structural biology community assessment of AlphaFold2 applications > Methods > Oligomerization state prediction
hedgeddirect- Asserted: passes — The authors put it forward as true.
- Checkable: passes — It can be checked against evidence.
- Load-bearing: passes — The paper’s conclusions depend on it.
- Based: passes — The paper gives a reason why it holds.
It may state two separate claims as one.
The paper relies on this without support.
The implementation of computational protein structure prediction methods across structural-biology applications remains to be tested.
“Although this has been independently verified, the implementation of these methods across structural-biology applications remains to be tested.”
The paper relies on this without support.
Many questions remain regarding the extent to which AF2 approaches extend coverage of structural biology and the limitations of AF2 for applications in biology.
“Yet many questions remain regarding the extent to which these approaches extend our coverage of structural biology, and the limitations of the AF2 method or structures derived from AF2 for applications in biology.”
The paper relies on this without support.
A protein structure facilitates the generation of hypotheses regarding the impact of missense mutations.
“A protein structure facilitates the generation of hypotheses regarding the impact of missense mutations.”
The paper relies on this without support.
An agreement between the expected and observed impacts of mutations provides confidence in the accuracy of a structural model.
“Conversely, an agreement between the expected and observed impacts of mutations provides confidence in the accuracy of a structural model.”
The paper relies on this without support.
AF2 is trained primarily on X-ray data.
“As AF2 is trained primarily on X-ray data, the relation between disorder and predicted confidence could be a by-product of using this definition of disorder.”
The paper relies on this without support.
Protein disordered regions are often defined as regions that are not solved by X-ray crystallography.
“However, we note that the protein disordered regions are often defined as regions that are not solved by X-ray crystallography.”
The paper relies on this without support.
Many LBSp structures are from species not included in the public AlphaFold database.
“In the latter case, we used locally modeled structures, as many LBSp structures are from species not included in the public database.”
Claims other papers make about this one
Each is checked against this paper’s own text: does it say what the citing paper says it does?
The source backs part of the claim, not all of it — or backs it for a different population, condition or comparison.
In the citing paper
“Preliminary reports also suggest that AF2 may also be able to predict oligomeric states of proteins and amyloids17,57”
From The power and pitfalls of AlphaFold2 for structure prediction beyond rigid globular proteins (2024) · cites this paper as [17]
Experimental — accuracy not yet measuredThe source backs part of the claim, not all of it — or backs it for a different population, condition or comparison.
In the citing paper
“For the majority of globular proteins, AF2 provides accurate, reliable models with high pLDDT (> 70) or low PAE values (< 5 Å) highlighting confidence in the prediction of the position of the atomic coordinates, which match experimentally determined native structures5,17,23,59”
From The power and pitfalls of AlphaFold2 for structure prediction beyond rigid globular proteins (2024) · cites this paper as [17]
Experimental — accuracy not yet measuredIn the citing paper
“are the best and most accurate answer to the structure prediction problem to date”
From The power and pitfalls of AlphaFold2 for structure prediction beyond rigid globular proteins (2024) · cites this paper as [17]
In the citing paper
“While AF2 performs exceptionally well on these types of folds on average”
From The power and pitfalls of AlphaFold2 for structure prediction beyond rigid globular proteins (2024) · cites this paper as [17]
In the citing paper
“Previous analysis suggests that AF2 predicts on average ~50% of residues across all proteins with high confidence17,59”
From The power and pitfalls of AlphaFold2 for structure prediction beyond rigid globular proteins (2024) · cites this paper as [17]
Self-check
Percentages, sums and reported differences re-computed from the paper’s own numbers.
Each contradiction between two passages listed here was confirmed by an independent check.
Rated minor: it would not touch a result — a value no result rests on, a p-value that stays on the same side of the significance level, or a conflict that is clerical, resolved elsewhere in the paper, or outside its own findings.
In the paper
§ A structural biology community assessment of AlphaFold2 applications > Results > Evaluation of AlphaFold2 models for use in experimental model building
“An example of the latter is the side chain of Trp A111, which, despite its high confidence (pLDDT = 86.1), was modeled incorrectly by AF2 (Fig. 6f).”
§ A structural biology community assessment of AlphaFold2 applications > Results > Evaluation of AlphaFold2 models for use in experimental model building
“e, High-confidence regions may still contain subtle errors that are difficult or impossible to detect in the absence of experimental data. The side chain of Trp A111 (pLDDT = 86.1) was modeled backwards (blue), forming an H-bond with Asp A77; the final model fitted to the map (gray) instead forms an H-bond with Glu A81. f, Rebuilding the recent 3.3-Å crystal structure 7OGG”
Rated minor: it would not touch a result — a value no result rests on, a p-value that stays on the same side of the significance level, or a conflict that is clerical, resolved elsewhere in the paper, or outside its own findings.
In the paper
§ A structural biology community assessment of AlphaFold2 applications > Results > Functional characterization of AF2 models by pocket and structural motif prediction
“A close up of the metal-binding center (Fig. 4e) of DEGS1 and 4YZO (overall sequence homology, 12.1%)”
§ A structural biology community assessment of AlphaFold2 applications > Results > Functional characterization of AF2 models by pocket and structural motif prediction
“A scan of 400 auto-generated 3-residue templates from the AF2-predicted structure against representative structures in the PDB (reverse template comparison38) yielded a possible 3-residue template match: PDB entry 4ZYO”
Rated minor: it would not touch a result — a value no result rests on, a p-value that stays on the same side of the significance level, or a conflict that is clerical, resolved elsewhere in the paper, or outside its own findings.
In the paper
§ A structural biology community assessment of AlphaFold2 applications > Results > Application of AlphaFold2 models for structure-based variant effect prediction
“The compilation of measured impacts of mutations on protein stability contains information for 2,648 single-point missense mutations over 121 distinct proteins.”
§ A structural biology community assessment of AlphaFold2 applications > Methods > Structure-based variant effect predictions using experimental and predicted structures
“A subset of experimentally characterized mutations was curated from ThermoMutDB27, comprising 2,648 single point missense mutations across 132 unique globular proteins.”
Citations
Cites
UCSF Chimera—A visualization system for exploratory research and analysis
Pettersen, E. F., Goddard, T. D., Huang, C. C., Couch, G. S., Greenblatt, D. M., Meng, E. C., & Ferrin, T. E. (2004) · Journal of Computational Chemistry · doi:10.1002/jcc.20084 · Cited by 46,047
Highly accurate protein structure prediction with AlphaFold
Jumper, J., Evans, R., Pritzel, A., Green, T., Figurnov, M., Ronneberger, O., Tunyasuvunakool, K., Bates, R., Žídek, A., Potapenko, A., et al. (2021) · Nature · doi:10.1038/s41586-021-03819-2 · Cited by 43,764
Harris, C. R., Millman, K. J., van der Walt, S. J., Gommers, R., Virtanen, P., Cournapeau, D., Wieser, E., Taylor, J., Berg, S., Smith, N. J., et al. (2020) · Nature · doi:10.1038/s41586-020-2649-2 · Cited by 23,826
Phaser crystallographic software
McCoy, A. J., Grosse-Kunstleve, R. W., Adams, P. D., Winn, M. D., Storoni, L. C., & Read, R. J. (2007) · Journal of Applied Crystallography · doi:10.1107/s0021889807021206 · Cited by 20,612
Harris, C., Millman, K., van der Walt, S., Gommers, R., Virtanen, P., Cournapeau, D., Wieser, E., Taylor, J., Berg, S., Smith, N., et al. (2020) · RePEc: Research Papers in Economics · Cited by 17,844
Comparative Protein Modelling by Satisfaction of Spatial Restraints
Šali, A., & Blundell, T. L. (1993) · Journal of Molecular Biology · doi:10.1006/jmbi.1993.1626 · Cited by 12,977
Open Babel: An open chemical toolbox
O'Boyle, N. M., Banck, M. S., James, C. A. J., Morley, C., Vandermeersch, T., & Hutchison, G. R. (2011) · Journal of Cheminformatics · doi:10.1186/1758-2946-3-33 · Cited by 10,745
ColabFold - Making protein folding accessible to all
Mirdita, M., Schütze, K., Moriwaki, Y., Heo, L., Ovchinnikov, S., & Steinegger, M. (2021) · doi:10.1101/2021.08.15.456425 · Cited by 9,391
Self-citationLiebschner, D., Afonine, P. V., Baker, M. L., Bunkóczi, G., Chen, V. B., Croll, T. I., Hintze, B., Hung, L.-W., Jain, S., McCoy, A. J., et al. (2019) · Acta Crystallographica Section D Structural Biology · doi:10.1107/s2059798319011471 · Cited by 7,953
Self-citationVaradi, M., Anyango, S., Deshpande, M., Nair, S., Natassia, C., Yordanova, G., Yuan, D., Stroe, O., Wood, G., Laydon, A., et al. (2022) · Nucleic Acids Research · doi:10.1093/nar/gkab1061 · Cited by 7,850
Self-citation
Research works printed but not linked: 1
- Mirdita, M. et al. ColabFold—making protein folding accessible to all. Nat. Methods 19, 679–682 (2022). · DOI · Paper page
Cited by
Sorted by citations
Items 701–722 of 722
Marien, J., Sritharan, S., Caviglia, B., Versini, R., Auclair, L., Barraud, P., Tisné, C., Reguei, A., Murail, S., Leclerc, F., et al. (2026) · bioRxiv (Cold Spring Harbor Laboratory) · doi:10.64898/2026.07.24.740587
Teixeira, T. D. O., da Silva, R. C. C., Alves, M. C. S., Silva, R. D. A., Echeverria, J. E. S., & Simionatto, S. (2026) · Journal of Computer-Aided Molecular Design · doi:10.1007/s10822-026-00905-3
SSAS-GO: structure-sequence adaptive synergy network for protein function prediction
Wang, D., Wang, H., Jiang, T., Lu, B., Xiang, F., & Wang, Q. (2026) · Briefings in Bioinformatics · doi:10.1093/bib/bbag408 · Cited by 1
Evaluating transformer-based models for structural characterization of orphan proteins
Seçkin, E., Colinet, D., Danchin, É., et al. (2026) · Bioinformatics Advances · doi:10.1093/bioadv/vbag215
Lavecchia, A. (2026) · Medicinal Research Reviews · doi:10.1002/med.70098 · Cited by 3
From affinity to kinetics: SPR as the analytical backbone of AI-driven drug discovery
Hwang, Y., Kim, J., Ko, J. B., Han, Y., Kim, Y., Lee, K. H., & Jang, S. (2026) · TrAC Trends in Analytical Chemistry · doi:10.1016/j.trac.2026.119089
Quadrotta, V., Gasperini, B., Pasquadibisceglie, A., et al. (2026) · International Journal of Biological Macromolecules · doi:10.1016/j.ijbiomac.2026.154090
Excessive disulfide bonds in lamin A/C contribute to premature human aging
Ha, S. G., Park, M., Lee, J., Bong, D., Ahn, J., Kim, D., Kim, M.-O., Lee, S., & Ha, N. (2026) · Molecules and Cells · doi:10.1016/j.mocell.2026.100389
Díaz, F. R., Orschanski, D., Folco, J. I., Ceci, J. E., Nibeyro, G., Vega, H. V. R., Nicola, J. P., & Fernández, E. A. (2026) · Briefings in Bioinformatics · doi:10.1093/bib/bbag461 · Cited by 1
Prakash, A., & Singh, P. (2026) · In Silico Research in Biomedicine · doi:10.1016/j.insi.2026.100594
da Silva, P. C. R. (2026) · Nexus Science Review · doi:10.66104/337xw232
Protein structural biology in precision medicine and clinical translation
Khan, M., Richi, M., & Othman, S. (2026) · Elsevier eBooks · doi:10.1016/b978-0-443-44988-8.00005-8
Structural biology in understanding bacterial resistance
Gupta, D., Kumar, M., Mathew, D. S., et al. (2026) · Elsevier eBooks · doi:10.1016/b978-0-443-44988-8.00021-6
Waksman, T., Bleau, J. R., Fisher, S. R., Pankovs, G., Hunter, W. N., & Bos, J. I. B. (2026) · bioRxiv (Cold Spring Harbor Laboratory) · doi:10.64898/2026.09.18.752295
Evolutionary conservation and local structural context of DNAJC14 W576
Ganesh, K., Patil, S. S., Harish, J., Suresh, K. P., Hiremath, J., & Nayakvadi, S. (2026) · Academia Immunity and Disease · doi:10.20935/acadimmunodis8523
Amaral, D. T., Teodoro, J. A., Cardoso, M. I. O., Moraes, E. M., Franco, F. F., & Bonatelli, I. A. S. (2026) · Genetica · doi:10.1007/s10709-026-00293-4
Structure-Guided Hybrid GCN−Transformer Framework for Enzyme Optimal pH Prediction
Tao, L., Zhang, J., Xiang, C., Yang, J., Wei, L., & Kang, S. (2026) · ACS Synthetic Biology · doi:10.1021/acssynbio.6c00421
Bahati, S. Y., & Maghembe, R. S. (2026) · Bacteriophage · doi:10.1016/j.phage.2026.100014
VQ-Transformer: A deep learning-driven model for transcription factor sequence identification
Li, J., Liang, X., Yuan, J., & Guan, J. (2026) · Model Organisms Research · doi:10.1016/j.mores.2026.100037
Metadata
- Authors
- Akdel, M., Pires, D. E. V., Pardo, E. P., Jänes, J., Zalevsky, A. O., Mészáros, B., Bryant, P., Good, L. L., Laskowski, R. A., Pozzati, G., Shenoy, A., Zhu, W., Kundrotas, P., Serra, V. R., Rodrigues, C. H. M., Dunham, A. S., Burke, D., Borkakoti, N., Velankar, S., Frost, A., Basquin, J., Lindorff-Larsen, K., Bateman, A., Kajava, A. V., Valencia, A., Ovchinnikov, S., Durairaj, J., Ascher, D. B., Thornton, J. M., Davey, N. E., Stein, A., Elofsson, A., Croll, T. I., & Beltrao, P.
- Affiliations
- Wageningen University & Research (NL)
- The University of Melbourne (AU)
- European Bioinformatics Institute (GB)
- Russian Academy of Sciences (RU)
- European Molecular Biology Laboratory (DE)
- Science for Life Laboratory (SE)
- University of Copenhagen (DK)
- University of California, San Francisco (US)
- Max Planck Institute of Biochemistry (DE)
- Centre National de la Recherche Scientifique (FR)
- Barcelona Supercomputing Center (ES)
- Harvard University (US)
- University of Basel (CH)
- The University of Queensland (AU)
- Institute of Cancer Research (GB)
- University of Cambridge (GB)
- Corresponding author
- Valencia, Alfonso
- Ovchinnikov, Sergey
- Durairaj, Janani
- Ascher, David B.
- Thornton, Janet M.
- Davey, Norman E.
- Stein, Amelie
- Elofsson, Arne
- Croll, Tristan I.
- ORCID
- Akdel, Mehmet
- Pires, Douglas E. V.
- Jänes, Jürgen
- Zalevsky, Arthur O.
- Mészáros, Bálint
- Bryant, Patrick
- Good, Lydia L.
- Laskowski, Roman A.
- Pozzati, Gabriele
- Shenoy, Aditi
- Zhu, Wensi
- Kundrotas, Petras
- Serra, Victoria Ruiz
- Rodrigues, Carlos H. M.
- Dunham, Alistair S.
- Burke, David
- Borkakoti, Neera
- Velankar, Sameer
- Frost, Adam
- Basquin, Jérôme
- Lindorff-Larsen, Kresten
- Bateman, Alex
- Kajava, Andrey V.
- Valencia, Alfonso
- Ovchinnikov, Sergey
- Durairaj, Janani
- Ascher, David B.
- Thornton, Janet M.
- Davey, Norman E.
- Stein, Amelie
- Elofsson, Arne
- Croll, Tristan I.
- Beltrao, Pedro
- Venue
- Nature Structural & Molecular Biology
- Published
- 2022-11
- Volume
- 29
- Issue
- 11
- Pages
- 1056-1067
- ISSN
- 1545-9985 (ISSN-L)
- 1545-9993
- PMC
- PMC9663297
- OpenAlex
- W4308463927
- Semantic Scholar
- 7bde0455b85732e9853f17f6b671c1e91884af78
- Cited by
- 675
- References
- 91
- Citations by year
- 2026: 137 · 2025: 143 · 2024: 171 · 2023: 174 · 2022: 47
- FWCI
- 44.48
- Type
- journal article
- Language
- en
- Open access
- hybrid
- doi.org
- Locations
- Nature Structural & Molecular Biology (publishedVersion, cc-by)
- PubMed Central (publishedVersion, cc-by)
- PubMed (publishedVersion)
- Research at the University of Copenhagen (University of Copenhagen) (publishedVersion, cc-by)
- edoc (University of Basel) (acceptedVersion)
- HAL (submittedVersion, other-oa)
- eScholarship (California Digital Library) (submittedVersion, cc-by)
- Minerva Access (University of Melbourne) (submittedVersion, cc-by)
- Socio-Environmental Systems Modeling (submittedVersion, cc-by)
- Data Archiving and Networked Services (DANS) (submittedVersion, other-oa)
- Funders
- National Science Foundation (2032259)
- Simons Foundation (735929LPI)
- Wellcome Trust
- Swedish e-Science Research Centre
- Cancer Research UK (28159)
- European Commission (HORIZON2020, 842490)
- Eidgenössische Technische Hochschule Zürich
- Lundbeckfonden (R272-2017-4528)
- Novo Nordisk
- Vetenskapsrådet (2016-06301, Berzelius-2021-29)
- State Government of Victoria
- Russian Science Foundation (20-14-00121)
- Novo Nordisk Fonden (NNF18OC0033950)
- ETH Zürich Foundation
- H. Lundbeck A/S
- Helmut Horten Stiftung
- National Institutes of Health (RYC2019-026415-I, DP5OD026389)
- Medical Research Council
- National Health and Medical Research Council (1174405)
- National Institute of Allergy and Infectious Diseases (R21AI156595)
- Topics
- Life Sciences › Biochemistry, Genetics and Molecular Biology › Molecular Biology › Protein Structure and Dynamics
- Life Sciences › Biochemistry, Genetics and Molecular Biology › Structural Biology › Enzyme Structure and Function
- Life Sciences › Biochemistry, Genetics and Molecular Biology › Molecular Biology › Machine Learning in Bioinformatics
- Keywords
- AlphaFold2, protein structure prediction, protein disorder prediction, protein complex modeling, ligand binding site prediction, confidence measures, Protein Data Bank
- MeSH terms
- Binding Sites, Furylfuramide, Protein Conformation, Proteins, Computational Biology, Databases, Protein
About these checks
Registry, retraction, Cites and statistics results are computed, not judged, with one exception: a printed reference that no index lists is read once by a model before it counts as a citation error. Claims are extracted by a model and kept only when their quote appears verbatim in the text; each cited source is then checked, with a model’s help, for whether it says what the claim relies on. Those verdicts can be wrong — read the claim’s quote and the cited source before relying on one.
A language model drew the claims from the paper on 2026-10-07, under version 3 of the claim definition (model deepseek-v4.1-flash, prompt extract-v3).
A second model labelled each claim on 2026-10-07 (model jev-1.13-20260917, definition revision gold-guideline-v0.2).
Cited sources are checked with a language model’s help (gpt-6-sol).
Statistics and arithmetic are recomputed, not judged.
Confidence bands are shown only for fields calibrated on our annotated test set. None is calibrated yet, so no band is shown.
What counts as a claim ›How we measure confidence ›How we check this ›
Are you an author, or do you see a problem with this page? Request a review
