

The DOI matches its Crossref record; 57 of the 57 references it cites were found in a registry or an index; 23 of the 38 sources its claims cite were checked for support.
Satellite-based time-series of sea-surface temperature since 1981 for climate applications
Open accessAbstract
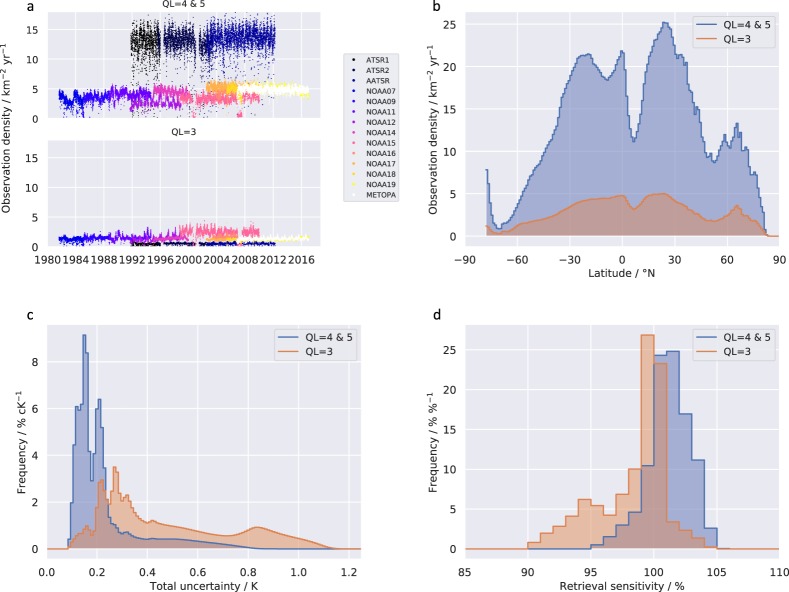
A climate data record of global sea surface temperature (SST) spanning 1981–2016 has been developed from 4 × 10 12 satellite measurements of thermal infra-red radiance. The spatial area represented by pixel SST estimates is between 1 km 2 and 45 km 2. The mean density of good-quality observations is 13 km−2 yr−1. SST uncertainty is evaluated per datum, the median uncertainty for pixel SSTs being 0.18 K. Multi-annual observational stability relative to drifting buoy measurements is within 0.003 K yr−1 of zero with high confidence, despite maximal independence from in situ SSTs over the latter two decades of the record. Data are provided at native resolution, gridded at 0.05° latitude-longitude resolution (individual sensors), and aggregated and gap-filled on a daily 0.05° grid. Skin SSTs, depth-adjusted SSTs de-aliased with respect to the diurnal cycle, and SST anomalies are provided. Target applications of the dataset include: climate and ocean model evaluation; quantification of marine change and variability (including marine heatwaves); climate and ocean-atmosphere processes; and specific applications in ocean ecology, oceanography and geophysics.
Overview
AI snapshot
Written from the paper’s full text.
TL;DR
This paper describes ESA SST CCI v2.1, a global satellite sea-surface temperature climate data record spanning 1981–2016, built from 4 × 10¹² thermal infrared radiance measurements and provided at native, 0.05° gridded, and gap-filled daily 0.05° levels. It reports median per-pixel uncertainty of 0.18 K and multi-annual stability relative to drifting buoys within 0.003 K yr⁻¹ of zero.
Key findings
- The CDR spans 1981–2016 from 11 AVHRRs and three ATSRs; the mean density of good-quality observations (QL 4 and 5) is 13 km⁻² yr⁻¹, with pixel SST footprint areas between 1 km² and 45 km².
- Median evaluated uncertainty for L2P pixel SSTs is 0.18 K; total uncertainty is less than 0.8 K for almost all SSTs, and median sensitivity for QL 4 and 5 data is 101%.
- Multi-annual global observational stability relative to drifting buoy SSTs is, with 95% confidence, in the range −0.0026 to 0.0004 K yr⁻¹.
- Products include skin SST, depth-adjusted SST at 20 cm de-aliased with respect to the diurnal cycle, and SST anomalies; the L4 analysis is a gap-filled daily-mean 20 cm SST field produced without assimilating in situ measurements.
Methods
- Inputs are the full ATSR-series v3/v2.1 level-1b archive and AVHRR GAC archives (AVHRR 7, 9, 11, 12, 14, 15, 16, 17, 18, 19 and Metop-A), with auxiliary ERA-Interim NWP fields, OSI-SAF sea-ice concentration, land-sea masks, and pre-calculated look-up tables.
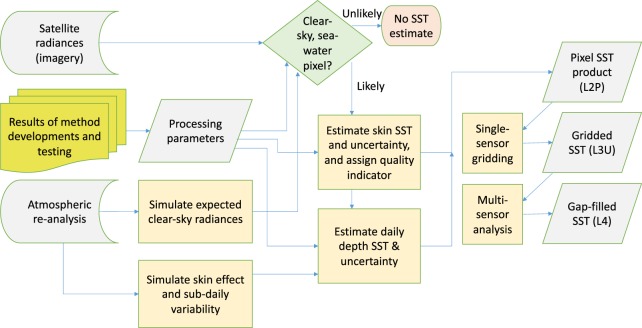
- Processing includes Bayesian cloud detection, radiance harmonisation referenced to AATSR/ATSR-2, radiative transfer modelling (LBLRTM and RTTOV), skin SST retrieval (coefficient-based for ATSRs; optimal estimation for AVHRRs), per-pixel uncertainty decomposition, depth/time adjustment to 20 cm and 10:30 or 22:30 local mean solar time, and NEMOVAR variational assimilation for the L4 analysis.
- Validation includes automated inspection of all 465,302 L2P and L3U products (8 TB L2P, 3.4 TB L3U), visual inspection of random subsets, manual metadata checks, and comparison against drifting buoys in skin-raw, skin-skin, and depth-depth categories.
Limitations
- Stated in the paper: independence from in situ observations is high for 1995 onward, but is significantly lost for 1981–1995 because in situ SSTs were used as a large-scale calibration reference.
- Stated in the paper: known v2.1 artefacts include unscreened and unadjusted desert dust causing intermittent negative biases of magnitude 1 K in CCI AVHRR SSTs in the north east tropical Atlantic, Red Sea and Gulf of Arabia, with an exaggerated positive trend of about 0.01 to 0.02 K yr⁻¹ in those regions; 1980s single-AVHRR periods with degraded calibration introduce global-mean analysis artefacts of 0.1 to 0.5 K in May 1982, October–December 1982, early August 1983 and late September 1983.
- Stated in the paper: some error sources are not estimated (cloud-affected pixels passing cloud detection, volcanic aerosol effects, mineral dust, undetected solar contamination), correlation scales for synoptically correlated uncertainty are not fully quantified, and L4 interpolation degrades feature resolution relative to lower-level data.
Model-written summary. Check it against the paper before relying on it.
Integrity signals
Registry
Cites
Statistics
Figures
Verification
Claims the paper makes
51 No basis given · 26 Own result · 22 Own interpretation · 20 Own method · 10 Supported · 7 No full text of the sources · 6 Partly supported · 4 Sources not found · 2 Supported so far · 1 Couldn’t confirm · 1 Not checked yet · accuracy not yet measured
The cited sources support only part of this claim — read each source’s verdict below.
In the paper
“The diurnal cycle in sea surface temperature has been empirically characterised from sub-daily drifting buoy variability8 and by remote sensing9, and is typically in the peak-to-peak range of 0.1 K to 0.5 K.”
§ Satellite-based time-series of sea-surface temperature since 1981 for climate applications > Background & Summary
What the sources say
- Partly supportedcites [8] Morak‐Bozzo, S., Merchant, C. J., Kent, E. C., Berry, D. I. & Carella, G. Climatological diurnal variability in sea surface temperature characterized from drifting buoy data. Geosci. Data J. 3, 20–28 (2016). sourceExperimental — accuracy not yet measured
The Abstract says the authors used sub-daily drifting-buoy records to characterize the SST diurnal cycle, supporting that part of the citing sentence. The Results (§1.2) discuss how its amplitude varies and give a 0.1 K start-to-end difference for one seasonal example, but our copy does not state that the typical peak-to-peak range is 0.1–0.5 K. (LLM, conf=0.82)
- Partly supportedcites [9] Zhang, H. et al. Comparison of SST diurnal variation models over the Tropical Warm Pool region. J. of Geophys. Res. Oceans 123, 3467–3488 (2018). sourceExperimental — accuracy not yet measured
Section 4.3 (DV Cycles; page unavailable) reports an average amplitude of 0.4–0.6 K in the original satellite data, which overlaps the claimed range. But the paper considers sensitivity-scaled data more realistic and gives their average amplitude as 0.8–0.9 K, so it does not support 0.1–0.5 K as the typical peak-to-peak range. The Introduction’s 0.1–0.5 K figure describes the cool-skin effect, not the diurnal cycle. (LLM, conf=0.85)
plain- Asserted: passes — The authors put it forward as true.
- Checkable: passes — It can be checked against evidence.
- Load-bearing: passes — The paper’s conclusions depend on it.
- Based: passes — The paper gives a reason why it holds.
- Partly supported
Every source the paper cites for this claim was checked and supports it.
In the paper
“Bayesian methods of cloud screening of imagery11,12”
§ Satellite-based time-series of sea-surface temperature since 1981 for climate applications > Methods
What the sources say
- Supportedcites [11] Merchant, C. J., Harris, A. R., Maturi, E. & MacCallum, S. Probabilistic physically-based cloud screening of satellite infra-red imagery for operational sea surface temperature retrieval. Quarterly Journal of the Royal Meteorological Society 131(611), 2735–2755 (2005). source
Section 2 applies Bayes’ theorem to cloud screening, and the Discussion and Conclusions says the authors used the resulting clear-sky probabilities to generate cloud masks for thermal infrared imagery. This supports the citing sentence’s identification of a Bayesian method for screening imagery. (LLM, conf=0.90)
- Supportedcites [12] Bulgin, C. E., Mittaz, J. P. D., Embury, O., Eastwood, S. & Merchant, C. J. Bayesian cloud detection for 37 Years of Advanced Very High Resolution Radiometer (AVHRR) Global Area Coverage (GAC) data. Remote Sens. 10(1), 97 (2018). source
The Abstract states that the authors applied a Bayesian cloud detection scheme to 37 years of AVHRR Global Area Coverage data. Section 5 (Conclusions) likewise describes the scheme as applied across the AVHRR data record, supporting the claim that Bayesian cloud screening was used. (LLM, conf=0.94)
plain- Asserted: passes — The authors put it forward as true.
- Checkable: passes — It can be checked against evidence.
- Load-bearing: unclear — It is unclear whether the paper’s conclusions depend on it.
- Based: passes — The paper gives a reason why it holds.
- The authors state this as an assumption: In the cloud detection calculation, P(x|c) is assumed equal to P(x).
- Supported
The cited sources support only part of this claim — read each source’s verdict below.
In the paper
“In situ SST measurements2 and the upper layers of ocean models typically reflect SST at depths between ~10 cm and ~10 m.”
§ Satellite-based time-series of sea-surface temperature since 1981 for climate applications > Background & Summary
What the sources say
- Partly supportedcites [2] Kent, E. C. et al. A Call for New Approaches to Quantifying Biases in Observations of Sea Surface Temperature. Bull. Amer. Meteor. Soc. 98, 1601–1616 (2017). sourceExperimental — accuracy not yet measured
The section “What Is SST and How Is It Measured?” says drifting buoys measure at nominal depths of 10–20 cm and moored buoys at about 1 m, supporting the in situ portion of the claim. It does not establish ~10 m as the typical lower boundary; it says measurements down to about 20 m have historically been treated as SST. The cited passage also does not establish the stated depth range for ocean-model upper layers. (LLM, conf=0.83)
plain- Asserted: passes — The authors put it forward as true.
- Checkable: passes — It can be checked against evidence.
- Load-bearing: passes — The paper’s conclusions depend on it.
- Based: passes — The paper gives a reason why it holds.
- Partly supported
The cited sources that could be checked couldn’t confirm or dispute this claim.
In the paper
“Three major volcanic eruptions (El Chichon22; Pinatubo and Hudson23) caused two periods of elevated stratospheric sulfate aerosol (1982–84, 1991–93) with impacts on infra-red brightness temperatures that are significant for SST retrieval24 (e.g., >0.03 K).”
§ Satellite-based time-series of sea-surface temperature since 1981 for climate applications > Methods > Auxiliary data
What the sources say
- Not checked — no full text of the sourcecites [22] Matson, M. The 1982 El Chichón Volcano eruptions – A satellite perspective. J. Volcanol. Geotherm. Res. 23(1–2), 1–10 (1984). source
- Not checked — no full text of the sourcecites [23] Lambert, A. et al. Measurements of the evolution of the Mt. Pinatubo aerosol cloud by ISAMS. Geophys. Res. Lett. 20(12), 1287–1290 (1993). source
- Could not verifycites [24] Merchant, C. J., Harris, A. R., Murray, M. J. & Zavody, A. M. Toward the elimination of bias in satellite retrievals of skin sea surface temperature 1. Theory, modeling and inter-algorithm comparison. Journal of Geophysical Research 104(C10), 23565–23578 (1999). sourceExperimental — accuracy not yet measured
The retrieved passages contain bibliographic details and the paper’s title, but no substantive passage addressing volcanic sulfate aerosols or their effect on infrared brightness temperatures. Searches for volcanic aerosols, stratospheric aerosols, brightness-temperature bias, and 0.03 K found no supporting passage in our copy. (LLM, conf=0.74)
plaindirect- Asserted: passes — The authors put it forward as true.
- Checkable: passes — It can be checked against evidence.
- Load-bearing: passes — The paper’s conclusions depend on it.
- Based: passes — The paper gives a reason why it holds.
The cited sources support only part of this claim — read each source’s verdict below.
In the paper
“context-specific estimation of total SST uncertainty and uncertainty components16,17”
§ Satellite-based time-series of sea-surface temperature since 1981 for climate applications > Methods
What the sources say
- Supportedcites [16] Bulgin, C. E., Embury, O., Corlett, G. & Merchant, C. J. Independent uncertainty estimates for coefficient based sea surface temperature retrieval from the Along-Track Scanning Radiometer instruments. Remote Sens. Env. 178, 213–222 (2016). source
The Introduction says the method estimates SST retrieval uncertainty at the pixel level, accounting for local instrument noise, viewing geometry and atmospheric conditions. The Discussion describes separate uncertainty components and a total uncertainty map, supporting context-specific estimates of both. (LLM, conf=0.91)
- Partly supportedcites [17] Bulgin, C. E., Embury, O. & Merchant, C. J. Sampling uncertainty in gridded sea surface temperature products and Advanced Very High Resolution Radiometer (AVHRR) Global Area Coverage (GAC) data. Remote Sens. Env. 178, 287–294 (2016). sourceExperimental — accuracy not yet measured
The Introduction (p. 4) says this paper models sampling uncertainty, one component of the uncertainty budget, while a companion paper addresses context-specific uncertainties from other error sources. Section 4.2 (p. 16) describes estimating sampling uncertainty from clear-sky coverage and SST variability. This source therefore supports context-specific estimation of a component, but not the attributed estimation of total SST uncertainty and its other components. (LLM, conf=0.88)
plain- Asserted: passes — The authors put it forward as true.
- Checkable: passes — It can be checked against evidence.
- Load-bearing: passes — The paper’s conclusions depend on it.
- Based: passes — The paper gives a reason why it holds.
- Supported
Every source the paper cites for this claim was checked and supports it.
In the paper
“harmonisation of sensor calibrations13”
§ Satellite-based time-series of sea-surface temperature since 1981 for climate applications > Methods
What the sources say
- Supportedcites [13] Giering, R. et al. A novel framework to harmonise satellite data series for climate applications. Remote Sens. 11(9), 1002 (2019). source
Section 3.1 reports that the procedure optimised calibration parameters for nine AVHRR instruments. The Discussion states that the authors applied it to harmonise satellite radiance, supporting the cited description of sensor-calibration harmonisation. (LLM, conf=0.90)
plain- Asserted: passes — The authors put it forward as true.
- Checkable: passes — It can be checked against evidence.
- Load-bearing: passes — The paper’s conclusions depend on it.
- Based: passes — The paper gives a reason why it holds.
- Supported
Every source the paper cites for this claim was checked and supports it.
In the paper
“Under low-wind, strong-sun conditions, it can be ~5 K10.”
§ Satellite-based time-series of sea-surface temperature since 1981 for climate applications > Background & Summary
What the sources say
- Supportedcites [10] Gentemann, C. L., Minnett, P. J., Le Borgne, P. & Merchant, C. J. Multi-satellite measurements of large diurnal warming events. Geophysical Research Letters 35(22), L22602 (2008). source
The Conclusions (§6) state that large diurnal heating occurred where low winds and high surface insolation coincided. The Discussion (§5) reports peaks greater than 5 K, supporting the claim that the SST diurnal cycle can be approximately 5 K under those conditions. (LLM, conf=0.94)
plainconditional- Asserted: passes — The authors put it forward as true.
- Checkable: passes — It can be checked against evidence.
- Load-bearing: passes — The paper’s conclusions depend on it.
- Based: passes — The paper gives a reason why it holds.
- Supported
Every source the paper cites for this claim was checked and supports it.
In the paper
“physical modelling of time-of-day adjustments of retrieved SSTs to minimise the aliasing of daily SST cycles into long-term trends15”
§ Satellite-based time-series of sea-surface temperature since 1981 for climate applications > Methods
What the sources say
- Supportedcites [15] Embury, O., Merchant, C. J. & Corlett, G. K. A reprocessing for climate of sea surface temperature from the Along-Track Scanning Radiometers: initial validation, accounting for skin and diurnal variability. Remote Sens. Env. 116, 62–78 (2012). source
Section 3.3 (page unavailable) says physical models estimated SST heating and cooling rates to adjust for the diurnal cycle. It explains that the sensors’ different overpass times would otherwise introduce a discontinuity into the climate SST record; the Discussion (section 5, page unavailable) says that difference must be adjusted for in an SST time series for climate applications. (LLM, conf=0.90)
plaindirect- Asserted: passes — The authors put it forward as true.
- Checkable: passes — It can be checked against evidence.
- Load-bearing: passes — The paper’s conclusions depend on it.
- Based: passes — The paper gives a reason why it holds.
- Supported
The cited sources support only part of this claim — read each source’s verdict below.
In the paper
“Estimates of standard uncertainty4 (which may be considered as the standard deviation of the estimated error distribution) are provided for every SST39 at all product levels.”
§ Satellite-based time-series of sea-surface temperature since 1981 for climate applications > Methods > Uncertainty estimate for skin SST
What the sources say
- Partly supportedcites [39] Merchant, C. J. et al. Uncertainty information in climate data records from Earth observation. Earth System Science Data 9, 511–527 (2017). sourceExperimental — accuracy not yet measured
The SST example in the Conclusion says standard uncertainty is given at pixel level, and §5.1 defines it as the standard deviation of the estimated error distribution. But §9 describes per-datum uncertainty estimates at all product levels as an aspiration that is challenging and not fully solved. The source therefore does not support the claim that estimates are provided for every SST at all levels. (LLM, conf=0.86)
plain- Asserted: passes — The authors put it forward as true.
- Checkable: passes — It can be checked against evidence.
- Load-bearing: passes — The paper’s conclusions depend on it.
- Based: passes — The paper gives a reason why it holds.
- Partly supported
Every source the paper cites for this claim was checked and supports it.
In the paper
“There is a diurnal cycle in SST that has been empirically characterised using satellite observations9 and drifting buoys8.”
§ Satellite-based time-series of sea-surface temperature since 1981 for climate applications > Methods > Adjustments by depth and time
What the sources say
- Supportedcites [9] Zhang, H. et al. Comparison of SST diurnal variation models over the Tropical Warm Pool region. J. of Geophys. Res. Oceans 123, 3467–3488 (2018). source
Section 3 states that the study compares SST diurnal cycles observed by MTSAT-1R with those observed by drifting buoys. This directly supports the claim attributed to citation 8: that the diurnal cycle has been empirically characterised using drifting buoys. (LLM, conf=0.92)
- Supportedcites [8] Morak‐Bozzo, S., Merchant, C. J., Kent, E. C., Berry, D. I. & Carella, G. Climatological diurnal variability in sea surface temperature characterized from drifting buoy data. Geosci. Data J. 3, 20–28 (2016). source
The citation to this paper is attached to “drifting buoys,” not to the satellite-observations part of the sentence. The Abstract and section 1.1 (Analysis) state that drifting-buoy SST measurements were used to characterize and compute the diurnal cycle. (LLM, conf=0.94)
plain- Asserted: passes — The authors put it forward as true.
- Checkable: passes — It can be checked against evidence.
- Load-bearing: passes — The paper’s conclusions depend on it.
- Based: passes — The paper gives a reason why it holds.
- Supported
- It may state two separate claims as one. 34
- Probably not a substantial claim. 47
- The quote only partly states this claim. 4
The sources with a verdict support this claim; the rest weren’t checked yet, have no full text we could read, or their verdicts aren’t rated yet.
In the paper
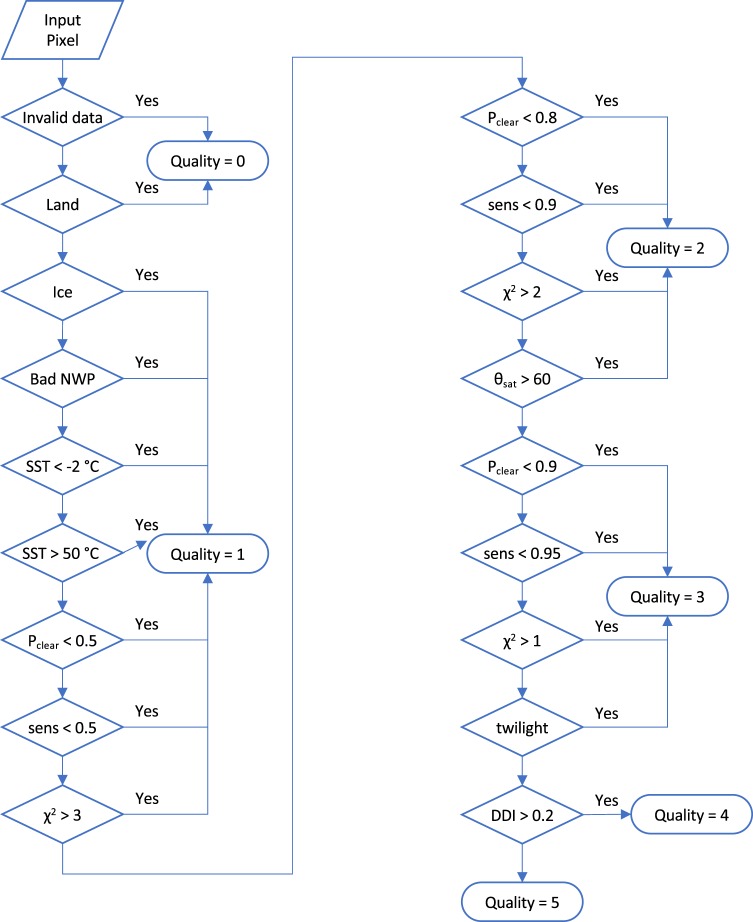
“therefore the quality level 5 is attributed only for high clear-sky probability and for conditions of low aerosol (assessed by a desert dust index42,43) or where steps to adjust for aerosol are taken (the case for the volcanic stratospheric aerosol events).”
§ Satellite-based time-series of sea-surface temperature since 1981 for climate applications > Methods > Quality indication
What the sources say
- Not checked — no full text of the sourcecites [42] Merchant, C. J., Embury, O., Le Borgne, P. & Bellec, B. Saharan dust in night-time thermal imagery: detection and reduction of related biases in retrieved sea surface temperature. Remote Sensing of Environment 104, 15–30 (2006). source
- Supportedcites [43] Good, E. J., Kong, X., Embury, O. & Merchant, C. J. An infrared desert dust index for the Along-Track Scanning Radiometers. Remote Sensing of Environment 116, 159–176 (2012). source
The citation is attached to “desert dust index,” not to the rule for assigning quality level 5. Section 5.1 describes the paper’s ASDI thresholds for distinguishing dust-contaminated from dust-free observations, supporting the cited index’s use to assess dust aerosol. (LLM, conf=0.93)
plain- Asserted: passes — The authors put it forward as true.
- Checkable: passes — It can be checked against evidence.
- Load-bearing: passes — The paper’s conclusions depend on it.
- Based: passes — The paper gives a reason why it holds.
It may state two separate claims as one.
The cited sources support only part of this claim — read each source’s verdict below.
In the paper
“A study on the use of CCI analysis SSTs at the locations of coral reefs near Florida and Belize found that the inferred coral-reef heat stress could differ from previous estimates59.”
§ Satellite-based time-series of sea-surface temperature since 1981 for climate applications > Usage Notes > Fitness-for-purpose assessment (climate science applications)
What the sources say
- Partly supportedcites [59] Liu, G. et al. Reef-scale thermal stress monitoring of coral ecosystems: new 5-km global products from NOAA Coral Reef Watch. Remote Sensing 6, 11579–11606 (2014). sourceExperimental — accuracy not yet measured
Section 3.1.2 (p. 17) reports that the new 5-km products yielded different estimates of coral-reef thermal stress from the earlier 50-km products. The paper describes NOAA's blended SST analysis and Pathfinder climatology, not a CCI analysis of SSTs at reefs near Florida and Belize; those specifics are unsupported. (LLM, conf=0.86)
hedgedconditional- Asserted: passes — The authors put it forward as true.
- Checkable: passes — It can be checked against evidence.
- Load-bearing: fails — The paper’s conclusions may not depend on it.
- Based: passes — The paper gives a reason why it holds.
Probably not a substantial claim. The paper’s conclusions may not depend on it.
- Partly supported
Every source the paper cites for this claim was checked and supports it.
In the paper
“Depth and time adjustments were calculated using a combined model of the skin-effect and diurnal thermocline15.”
§ Satellite-based time-series of sea-surface temperature since 1981 for climate applications > Technical Validation > Validation against in situ measurements
What the sources say
- Supportedcites [15] Embury, O., Merchant, C. J. & Corlett, G. K. A reprocessing for climate of sea surface temperature from the Along-Track Scanning Radiometers: initial validation, accounting for skin and diurnal variability. Remote Sens. Env. 116, 62–78 (2012). source
Section 3.2 describes adjusting satellite skin SST for both the skin effect and diurnal stratification to estimate SST at a specified depth. Section 3.3 says the Fairall skin and Kantha–Clayson stratification models were also used to estimate heating and cooling rates for time adjustment. The paper describes two models used together, rather than a single unified model; page numbers were not provided in our copy. (LLM, conf=0.91)
plaindirect- Asserted: passes — The authors put it forward as true.
- Checkable: passes — It can be checked against evidence.
- Load-bearing: fails — The paper’s conclusions may not depend on it.
- Based: passes — The paper gives a reason why it holds.
Probably not a substantial claim. The paper’s conclusions may not depend on it.
- Supported
The sources with a verdict support this claim; the rest weren’t checked yet, have no full text we could read, or their verdicts aren’t rated yet.
In the paper
“Users of a precursor version of SST CCI data have demonstrated its use for evaluating biases between different instrumentally homogenous observational datasets60 and for propagating observational uncertainty to scales required in model evaluation61.”
§ Satellite-based time-series of sea-surface temperature since 1981 for climate applications > Usage Notes > Fitness-for-purpose assessment (climate science applications)
What the sources say
- Supportedcites [60] Hausfather, Z. et al. Assessing recent warming using instrumentally homogeneous sea surface temperature records. Science Advances 3(1), e1601207 (2017). source
The Materials and Methods section (Satellites; page not available) identifies the experimental SST CCI record used in this study. The Introduction and Results compare it with other observational SST records to assess biases. This verdict concerns the bias-evaluation claim attached to citation 60; the separate uncertainty-propagation claim is attached to citation 61. (LLM, conf=0.88)
- Not checked — no full text of the sourcecites [61] Bellprat, O. et al. Uncertainty propagation in observations references to climate model scales. Rem. Sens. Environment. 203, 101–108 (2017). source
boosteddirect- Asserted: passes — The authors put it forward as true.
- Checkable: passes — It can be checked against evidence.
- Load-bearing: unclear — It is unclear whether the paper’s conclusions depend on it.
- Based: passes — The paper gives a reason why it holds.
It may state two separate claims as one.
- Supported
The paper states this without a source or data behind it here, so there is nothing to check it against. The quote shows it is in the paper.
In the paper
“Skin SSTs, depth-adjusted SSTs de-aliased with respect to the diurnal cycle, and SST anomalies are provided.”
§ Satellite-based time-series of sea-surface temperature since 1981 for climate applications > Abstract
plain- Asserted: passes — The authors put it forward as true.
- Checkable: passes — It can be checked against evidence.
- Load-bearing: passes — The paper’s conclusions depend on it.
- Based: passes — The paper gives a reason why it holds.
It may state two separate claims as one.
In the paper
“However, the 12 µm channel of AATSR was subject to an anomalous bias of up to 0.3 K, which we have reduced by application of a shift of its nominal spectral response function27”
§ Satellite-based time-series of sea-surface temperature since 1981 for climate applications > Methods > Radiance harmonization
What the sources say
- Not matchedcites [27] Remedios, J. J., Corlett, G. & Embury, O. AATSR 12 Micron Anomaly Review Board – Final Report ADDENDUM. ESA/ESRIN IDEAS-VEG-OQC-REP-1274_ADDENDUM, https://earth.esa.int/documents/10174/663411/Addendum-AATSR-12-Micron-Anomaly-Review-Board-Final-Report (2016).
Couldn’t be matched to a paper in Crossref, so it can’t be checked.
plaindirect- Asserted: passes — The authors put it forward as true.
- Checkable: passes — It can be checked against evidence.
- Load-bearing: passes — The paper’s conclusions depend on it.
- Based: passes — The paper gives a reason why it holds.
It may state two separate claims as one.
- Not matched
A result the paper reports from its own data — it cites no other source for it, so there is none to check. The quote shows it is in the paper.
In the paper
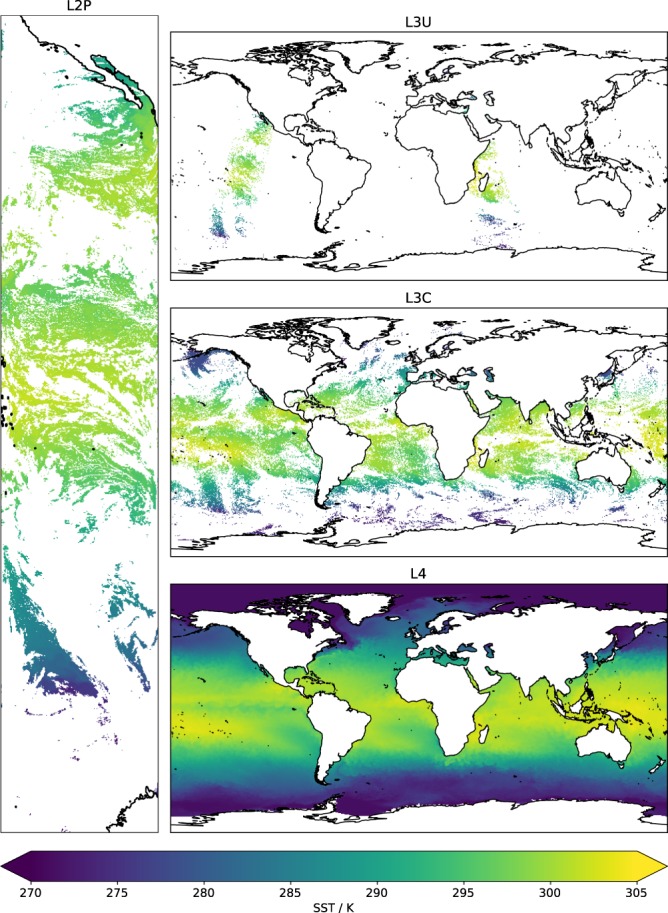
“The SST observation density varies in time and space (Fig. 1).”
§ Satellite-based time-series of sea-surface temperature since 1981 for climate applications > Background & Summary
plain- Asserted: passes — The authors put it forward as true.
- Checkable: passes — It can be checked against evidence.
- Load-bearing: fails — The paper’s conclusions may not depend on it.
- Based: passes — The paper gives a reason why it holds.
Probably not a substantial claim. The paper’s conclusions may not depend on it.
The paper states this without a source or data behind it here, so there is nothing to check it against. The quote shows it is in the paper.
In the paper
“The probability does not have a frequentist interpretation (i.e., when P(c|y, x) = 90% visual inspection suggests that the image pixels are cloudy less than 10% of the time).”
§ Satellite-based time-series of sea-surface temperature since 1981 for climate applications > Methods > Cloud detection
hedged- Asserted: passes — The authors put it forward as true.
- Checkable: passes — It can be checked against evidence.
- Load-bearing: fails — The paper’s conclusions may not depend on it.
- Based: fails — The paper may give no reason why it holds.
Probably not a substantial claim. The paper’s conclusions may not depend on it. The paper may give no reason why it holds. It may state two separate claims as one.
The paper states this without a source or data behind it here, so there is nothing to check it against. The quote shows it is in the paper.
In the paper
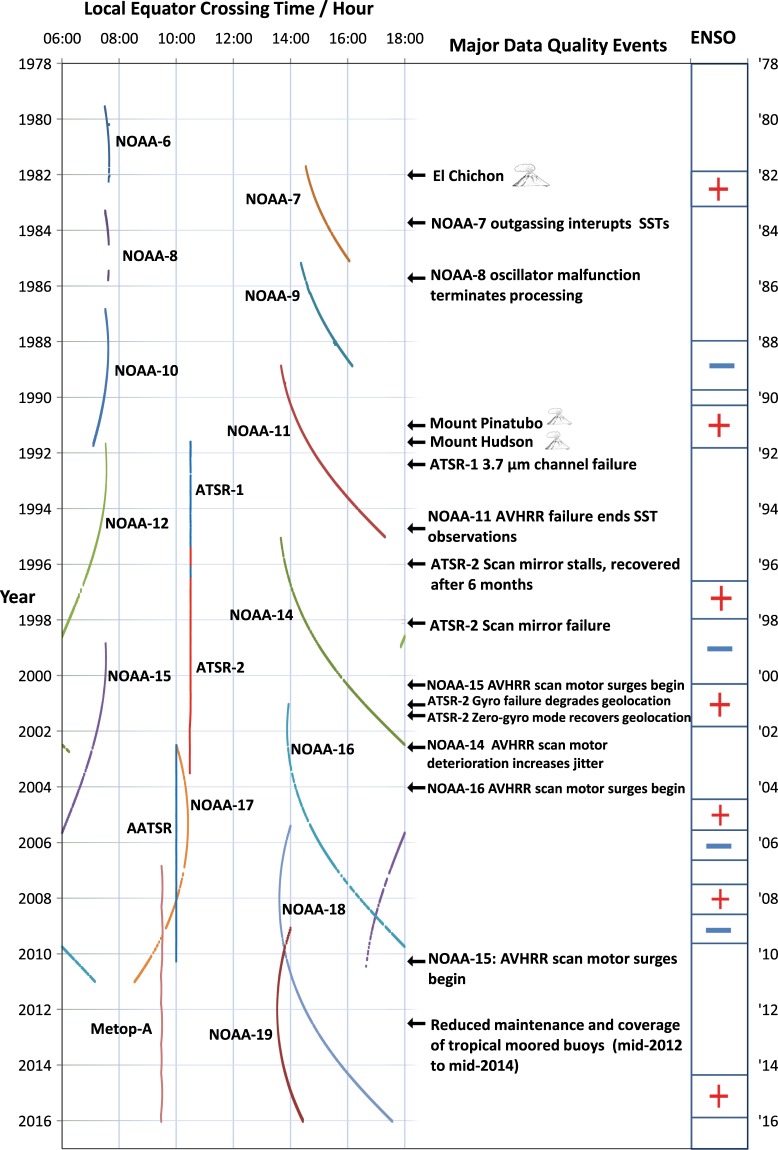
“Satellite local overpass times differ between missions and sometimes drift during missions (Fig. 3).”
§ Satellite-based time-series of sea-surface temperature since 1981 for climate applications > Background & Summary
plain- Asserted: passes — The authors put it forward as true.
- Checkable: passes — It can be checked against evidence.
- Load-bearing: passes — The paper’s conclusions depend on it.
- Based: passes — The paper gives a reason why it holds.
It may state two separate claims as one.
A result the paper reports from its own data — it cites no other source for it, so there is none to check. The quote shows it is in the paper.
In the paper
“The sensitivity is associated with each SST, and the median sensitivity for QL 4 & 5 data is 101%, close to the ideal value of 100%.”
§ Satellite-based time-series of sea-surface temperature since 1981 for climate applications > Methods > Retrieval of skin SST
plaincorrelational- Asserted: passes — The authors put it forward as true.
- Checkable: passes — It can be checked against evidence.
- Load-bearing: passes — The paper’s conclusions depend on it.
- Based: passes — The paper gives a reason why it holds.
It may state two separate claims as one.
The paper states this without a source or data behind it here, so there is nothing to check it against. The quote shows it is in the paper.
In the paper
“Data are provided at native resolution, gridded at 0.05° latitude-longitude resolution (individual sensors), and aggregated and gap-filled on a daily 0.05° grid.”
§ Satellite-based time-series of sea-surface temperature since 1981 for climate applications > Abstract
plain- Asserted: passes — The authors put it forward as true.
- Checkable: passes — It can be checked against evidence.
- Load-bearing: unclear — It is unclear whether the paper’s conclusions depend on it.
- Based: passes — The paper gives a reason why it holds.
It may state two separate claims as one.
A result the paper reports from its own data — it cites no other source for it, so there is none to check. The quote shows it is in the paper.
In the paper
“SST uncertainty is evaluated per datum, the median uncertainty for pixel SSTs being 0.18 K.”
- Also stated in: § Background & Summary · plain
“the median evaluated uncertainty for L2P SSTs (i.e., for individual ATSR and AVHRR retrievals) is 0.18 K”
§ Satellite-based time-series of sea-surface temperature since 1981 for climate applications > Abstract
plain- Asserted: passes — The authors put it forward as true.
- Checkable: passes — It can be checked against evidence.
- Load-bearing: passes — The paper’s conclusions depend on it.
- Based: passes — The paper gives a reason why it holds.
It may state two separate claims as one.
- Also stated in: § Background & Summary · plain
The paper states this without a source or data behind it here, so there is nothing to check it against. The quote shows it is in the paper.
In the paper
“For this reason, the depth adjustment mentioned above also addresses the diurnal cycle, the depth SST being further adjusted in time to be more representative of the daily mean.”
§ Satellite-based time-series of sea-surface temperature since 1981 for climate applications > Background & Summary
plaindirect- Asserted: passes — The authors put it forward as true.
- Checkable: passes — It can be checked against evidence.
- Load-bearing: passes — The paper’s conclusions depend on it.
- Based: passes — The paper gives a reason why it holds.
It may state two separate claims as one.
The paper states this without a source or data behind it here, so there is nothing to check it against. The quote shows it is in the paper.
In the paper
“This L4 product is intended to represent the SST at 20 cm depth, and the time-and-depth adjusted SSTs are the inputs used.”
§ Satellite-based time-series of sea-surface temperature since 1981 for climate applications > Methods > Analysed SST
plain- Asserted: passes — The authors put it forward as true.
- Checkable: passes — It can be checked against evidence.
- Load-bearing: fails — The paper’s conclusions may not depend on it.
- Based: passes — The paper gives a reason why it holds.
Probably not a substantial claim. The paper’s conclusions may not depend on it. It may state two separate claims as one.
A result the paper reports from its own data — it cites no other source for it, so there is none to check. The quote shows it is in the paper.
In the paper
“spanning 1981 to 2016”
§ Satellite-based time-series of sea-surface temperature since 1981 for climate applications > Data Records
plain- Asserted: passes — The authors put it forward as true.
- Checkable: passes — It can be checked against evidence.
- Load-bearing: fails — The paper’s conclusions may not depend on it.
- Based: passes — The paper gives a reason why it holds.
Probably not a substantial claim. The paper’s conclusions may not depend on it. The quote only partly states this claim.
In the paper
“A confidence level on a scale 0 to 5 is provided for each SST as a quality indicator, following an international convention3.”
§ Satellite-based time-series of sea-surface temperature since 1981 for climate applications > Methods > Quality indication
What the sources say
- Not matchedcites [3] GHRSST Science Team. The Recommended GHRSST Data Specification (GDS) 2.0 document revision 4. GHRSST International Project Office (2011).
Couldn’t be matched to a paper in Crossref, so it can’t be checked.
plain- Asserted: passes — The authors put it forward as true.
- Checkable: passes — It can be checked against evidence.
- Load-bearing: fails — The paper’s conclusions may not depend on it.
- Based: passes — The paper gives a reason why it holds.
Probably not a substantial claim. The paper’s conclusions may not depend on it.
- Not matched
The paper states this without a source or data behind it here, so there is nothing to check it against. The quote shows it is in the paper.
In the paper
“Users need to be aware that mineral-dust-affected AVHRR SSTs are present intermittently in the products, particularly for the north east tropical Atlantic Ocean, the Red Sea and the Gulf of Arabia, and such data may be given quality level 5 flags without the biasing effect of the aerosol being accounted for in the attached uncertainty; see further information in Usage Notes below.”
§ Satellite-based time-series of sea-surface temperature since 1981 for climate applications > Methods > Quality indication
hedgedconditional- Asserted: passes — The authors put it forward as true.
- Checkable: passes — It can be checked against evidence.
- Load-bearing: unclear — It is unclear whether the paper’s conclusions depend on it.
- Based: passes — The paper gives a reason why it holds.
It may state two separate claims as one.
The paper states this without a source or data behind it here, so there is nothing to check it against. The quote shows it is in the paper.
In the paper
“presented on the native geometry of observation at original time of observation”
§ Satellite-based time-series of sea-surface temperature since 1981 for climate applications > Data Records
plain- Asserted: passes — The authors put it forward as true.
- Checkable: passes — It can be checked against evidence.
- Load-bearing: fails — The paper’s conclusions may not depend on it.
- Based: passes — The paper gives a reason why it holds.
Probably not a substantial claim. The paper’s conclusions may not depend on it.
A result the paper reports from its own data — it cites no other source for it, so there is none to check. The quote shows it is in the paper.
In the paper
“270 G”
§ Satellite-based time-series of sea-surface temperature since 1981 for climate applications > Data Records
plain- Asserted: passes — The authors put it forward as true.
- Checkable: passes — It can be checked against evidence.
- Load-bearing: fails — The paper’s conclusions may not depend on it.
- Based: passes — The paper gives a reason why it holds.
Probably not a substantial claim. The paper’s conclusions may not depend on it.
The paper states this without a source or data behind it here, so there is nothing to check it against. The quote shows it is in the paper.
In the paper
“spanning 1991 to 2012”
§ Satellite-based time-series of sea-surface temperature since 1981 for climate applications > Data Records
plain- Asserted: fails — The authors may not put it forward as true.
- Checkable: passes — It can be checked against evidence.
- Load-bearing: fails — The paper’s conclusions may not depend on it.
- Based: fails — The paper may give no reason why it holds.
Probably not a substantial claim. The authors may not put it forward as true. The paper’s conclusions may not depend on it. The paper may give no reason why it holds. The quote only partly states this claim.
The paper states this without a source or data behind it here, so there is nothing to check it against. The quote shows it is in the paper.
In the paper
“This component of uncertainty is difficult to estimate, although an upper bound of order 0.1 K can be established by comparison with other SST data, and this value is used.”
§ Satellite-based time-series of sea-surface temperature since 1981 for climate applications > Methods > Uncertainty estimate for skin SST
plain- Asserted: passes — The authors put it forward as true.
- Checkable: passes — It can be checked against evidence.
- Load-bearing: passes — The paper’s conclusions depend on it.
- Based: passes — The paper gives a reason why it holds.
It may state two separate claims as one.
A result the paper reports from its own data — it cites no other source for it, so there is none to check. The quote shows it is in the paper.
In the paper
“3.1 T”
§ Satellite-based time-series of sea-surface temperature since 1981 for climate applications > Data Records
plain- Asserted: passes — The authors put it forward as true.
- Checkable: passes — It can be checked against evidence.
- Load-bearing: fails — The paper’s conclusions may not depend on it.
- Based: passes — The paper gives a reason why it holds.
Probably not a substantial claim. The paper’s conclusions may not depend on it.
A result the paper reports from its own data — it cites no other source for it, so there is none to check. The quote shows it is in the paper.
In the paper
“5.4 T”
§ Satellite-based time-series of sea-surface temperature since 1981 for climate applications > Data Records
plain- Asserted: passes — The authors put it forward as true.
- Checkable: passes — It can be checked against evidence.
- Load-bearing: fails — The paper’s conclusions may not depend on it.
- Based: passes — The paper gives a reason why it holds.
Probably not a substantial claim. The paper’s conclusions may not depend on it.
A result the paper reports from its own data — it cites no other source for it, so there is none to check. The quote shows it is in the paper.
In the paper
“presented on a 0.05° latitude-longitude grid at original time of observation”
§ Satellite-based time-series of sea-surface temperature since 1981 for climate applications > Data Records
plain- Asserted: passes — The authors put it forward as true.
- Checkable: passes — It can be checked against evidence.
- Load-bearing: fails — The paper’s conclusions may not depend on it.
- Based: passes — The paper gives a reason why it holds.
Probably not a substantial claim. The paper’s conclusions may not depend on it. It may state two separate claims as one.
A result the paper reports from its own data — it cites no other source for it, so there is none to check. The quote shows it is in the paper.
In the paper
“2.6 T”
§ Satellite-based time-series of sea-surface temperature since 1981 for climate applications > Data Records
plain- Asserted: passes — The authors put it forward as true.
- Checkable: passes — It can be checked against evidence.
- Load-bearing: fails — The paper’s conclusions may not depend on it.
- Based: passes — The paper gives a reason why it holds.
Probably not a substantial claim. The paper’s conclusions may not depend on it.
The paper states this without a source or data behind it here, so there is nothing to check it against. The quote shows it is in the paper.
In the paper
“presented on a 0.05° latitude-longitude grid at original time of observation”
§ Satellite-based time-series of sea-surface temperature since 1981 for climate applications > Data Records
plain- Asserted: passes — The authors put it forward as true.
- Checkable: passes — It can be checked against evidence.
- Load-bearing: fails — The paper’s conclusions may not depend on it.
- Based: passes — The paper gives a reason why it holds.
Probably not a substantial claim. The paper’s conclusions may not depend on it. It may state two separate claims as one.
The paper states this without a source or data behind it here, so there is nothing to check it against. The quote shows it is in the paper.
In the paper
“presented on the native geometry of observation at original time of observation”
§ Satellite-based time-series of sea-surface temperature since 1981 for climate applications > Data Records
plain- Asserted: passes — The authors put it forward as true.
- Checkable: passes — It can be checked against evidence.
- Load-bearing: fails — The paper’s conclusions may not depend on it.
- Based: passes — The paper gives a reason why it holds.
Probably not a substantial claim. The paper’s conclusions may not depend on it.
The paper states this without a source or data behind it here, so there is nothing to check it against. The quote shows it is in the paper.
In the paper
“All data are released under the licence Creative Commons Attribution 4.0 International (CC-BY 4.0, https://creativecommons.org/licenses/by/4.0/).”
§ Satellite-based time-series of sea-surface temperature since 1981 for climate applications > Data Records
plain- Asserted: passes — The authors put it forward as true.
- Checkable: passes — It can be checked against evidence.
- Load-bearing: fails — The paper’s conclusions may not depend on it.
- Based: passes — The paper gives a reason why it holds.
Probably not a substantial claim. The paper’s conclusions may not depend on it.
The paper states this without a source or data behind it here, so there is nothing to check it against. The quote shows it is in the paper.
In the paper
“Gridded versions of data (L3U and L3C, see Fig. 5) are provided on a spatial grid of 0.05° in latitude and longitude.”
§ Satellite-based time-series of sea-surface temperature since 1981 for climate applications > Methods > Gridded SST products
plain- Asserted: passes — The authors put it forward as true.
- Checkable: passes — It can be checked against evidence.
- Load-bearing: fails — The paper’s conclusions may not depend on it.
- Based: passes — The paper gives a reason why it holds.
Probably not a substantial claim. The paper’s conclusions may not depend on it.
The paper states this without a source or data behind it here, so there is nothing to check it against. The quote shows it is in the paper.
In the paper
“Typically, the process of retrieval amplifies noise by a factor that varies between ~2 and ~8, depending on the channel combination, viewing geometry and atmospheric state.”
§ Satellite-based time-series of sea-surface temperature since 1981 for climate applications > Methods > Uncertainty estimate for skin SST
plaindirect- Asserted: passes — The authors put it forward as true.
- Checkable: passes — It can be checked against evidence.
- Load-bearing: fails — The paper’s conclusions may not depend on it.
- Based: passes — The paper gives a reason why it holds.
Probably not a substantial claim. The paper’s conclusions may not depend on it.
The paper states this without a source or data behind it here, so there is nothing to check it against. The quote shows it is in the paper.
In the paper
“Some sources of error are not estimated by the above procedures. These include the SST impact of cloud-affected pixels that nonetheless pass the cloud-detection procedures, unaccounted-for aerosol effects on BTs from volcanic eruptions and mineral dust, and issues such as undetected solar contamination of measurements that may affect AVHRRs.”
§ Satellite-based time-series of sea-surface temperature since 1981 for climate applications > Methods > Uncertainty estimate for skin SST
plain- Asserted: passes — The authors put it forward as true.
- Checkable: passes — It can be checked against evidence.
- Load-bearing: unclear — It is unclear whether the paper’s conclusions depend on it.
- Based: passes — The paper gives a reason why it holds.
It may state two separate claims as one.
None of the sources cited for this claim have been checked yet.
In the paper
“An assessment of CCI analysis SSTs for oceanographic application over the Eastern Atlantic concluded that open ocean SST values had lower uncertainties than in coastal zones, where comparisons with coastal buoys gave discrepancies of between 0.3 K and 0.8 K (root mean square differences)”
§ Satellite-based time-series of sea-surface temperature since 1981 for climate applications > Usage Notes > Fitness-for-purpose assessment (climate science applications)
plaincorrelational- Asserted: passes — The authors put it forward as true.
- Checkable: passes — It can be checked against evidence.
- Load-bearing: unclear — It is unclear whether the paper’s conclusions depend on it.
- Based: passes — The paper gives a reason why it holds.
It may state two separate claims as one.
The paper states this without a source or data behind it here, so there is nothing to check it against. The quote shows it is in the paper.
In the paper
“there is southward shift in the distribution of the tropical organized convective regime and a corresponding increase in simulated tropical cyclone activity in that hemisphere, although the impact was modest compared to existing model biases.”
§ Satellite-based time-series of sea-surface temperature since 1981 for climate applications > Usage Notes > Fitness-for-purpose assessment (climate science applications)
plaindirect- Asserted: passes — The authors put it forward as true.
- Checkable: passes — It can be checked against evidence.
- Load-bearing: passes — The paper’s conclusions depend on it.
- Based: passes — The paper gives a reason why it holds.
It may state two separate claims as one.
The paper states this without a source or data behind it here, so there is nothing to check it against. The quote shows it is in the paper.
In the paper
“Overall, notwithstanding the limitations of the SST CCI products identified by inter-comparison and validation, users found the datasets easy to use and useful within the context of their applications.”
§ Satellite-based time-series of sea-surface temperature since 1981 for climate applications > Usage Notes > Fitness-for-purpose assessment (climate science applications)
plain- Asserted: passes — The authors put it forward as true.
- Checkable: passes — It can be checked against evidence.
- Load-bearing: unclear — It is unclear whether the paper’s conclusions depend on it.
- Based: passes — The paper gives a reason why it holds.
It may state two separate claims as one.
A result the paper reports from its own data — it cites no other source for it, so there is none to check. The quote shows it is in the paper.
In the paper
“All histograms of the variables showed the expected distributions.”
§ Satellite-based time-series of sea-surface temperature since 1981 for climate applications > Technical Validation > Verification results
plain- Asserted: passes — The authors put it forward as true.
- Checkable: passes — It can be checked against evidence.
- Load-bearing: fails — The paper’s conclusions may not depend on it.
- Based: passes — The paper gives a reason why it holds.
Probably not a substantial claim. The paper’s conclusions may not depend on it.
The paper states this without a source or data behind it here, so there is nothing to check it against. The quote shows it is in the paper.
In the paper
“Minor discrepancies between data and product user guide have been detected”
§ Satellite-based time-series of sea-surface temperature since 1981 for climate applications > Technical Validation > Verification results
plain- Asserted: passes — The authors put it forward as true.
- Checkable: passes — It can be checked against evidence.
- Load-bearing: fails — The paper’s conclusions may not depend on it.
- Based: passes — The paper gives a reason why it holds.
Probably not a substantial claim. The paper’s conclusions may not depend on it.
The paper states this without a source or data behind it here, so there is nothing to check it against. The quote shows it is in the paper.
In the paper
“An application of the data to provide an SST climatology for the Australian seas found the data to be highly consistent with mooring measurements in the region and able to provide a convincing climatology.”
§ Satellite-based time-series of sea-surface temperature since 1981 for climate applications > Usage Notes > Fitness-for-purpose assessment (climate science applications)
boostedcorrelationalSingle case- Asserted: passes — The authors put it forward as true.
- Checkable: passes — It can be checked against evidence.
- Load-bearing: fails — The paper’s conclusions may not depend on it.
- Based: passes — The paper gives a reason why it holds.
Probably not a substantial claim. The paper’s conclusions may not depend on it. It may state two separate claims as one.
The paper states this without a source or data behind it here, so there is nothing to check it against. The quote shows it is in the paper.
In the paper
“A study of ENSO variability in a coupled climate model showed reduced cold-tongue simulation biases from a model upgrade, relative to SST CCI observations.”
§ Satellite-based time-series of sea-surface temperature since 1981 for climate applications > Usage Notes > Fitness-for-purpose assessment (climate science applications)
plaindirect- Asserted: passes — The authors put it forward as true.
- Checkable: passes — It can be checked against evidence.
- Load-bearing: fails — The paper’s conclusions may not depend on it.
- Based: passes — The paper gives a reason why it holds.
Probably not a substantial claim. The paper’s conclusions may not depend on it.
A result the paper reports from its own data — it cites no other source for it, so there is none to check. The quote shows it is in the paper.
In the paper
“The visual inspection of the test-dataset did not reveal any unusual structures.”
§ Satellite-based time-series of sea-surface temperature since 1981 for climate applications > Technical Validation > Verification results
plain- Asserted: passes — The authors put it forward as true.
- Checkable: passes — It can be checked against evidence.
- Load-bearing: fails — The paper’s conclusions may not depend on it.
- Based: passes — The paper gives a reason why it holds.
Probably not a substantial claim. The paper’s conclusions may not depend on it.
In the paper
“The difference between skin and depth SST is typically of order tenths of kelvin, but can be larger5.”
§ Satellite-based time-series of sea-surface temperature since 1981 for climate applications > Background & Summary
What the sources say
- Not checked — no full text of the sourcecites [5] Minnett, P. J., Smith, M. & Ward, B. Measurements of the oceanic thermal skin effect. Deep-Sea Research Part II: Topical Studies in Oceanography. 58(6), 861–868 (2011). source
plain- Asserted: passes — The authors put it forward as true.
- Checkable: passes — It can be checked against evidence.
- Load-bearing: passes — The paper’s conclusions depend on it.
- Based: passes — The paper gives a reason why it holds.
It may state two separate claims as one.
In the paper
“inversion of TIR radiances to SST independently of in situ measurements (i.e., based on physical modelling not empirical tuning14)”
§ Satellite-based time-series of sea-surface temperature since 1981 for climate applications > Methods
What the sources say
- Not checked — no full text of the sourcecites [14] Embury, O., Merchant, C. J. & Filipiak, M. J. A reprocessing for climate of sea surface temperature from the Along-Track Scanning Radiometers: basis in radiative transfer. Remote Sens. Env. 116, 32–46 (2012). source
plain- Asserted: passes — The authors put it forward as true.
- Checkable: passes — It can be checked against evidence.
- Load-bearing: passes — The paper’s conclusions depend on it.
- Based: passes — The paper gives a reason why it holds.
It may state two separate claims as one.
The paper states this without a source or data behind it here, so there is nothing to check it against. The quote shows it is in the paper.
In the paper
“SSTs from dual-view retrievals can yield very low uncertainty from systematic effects but are prone to being noisy (relatively large independent random errors in individual pixel SSTs), particularly when using two channels (at 11 and 12 µm).”
§ Satellite-based time-series of sea-surface temperature since 1981 for climate applications > Methods > Retrieval of skin SST
plaincorrelational- Asserted: passes — The authors put it forward as true.
- Checkable: passes — It can be checked against evidence.
- Load-bearing: passes — The paper’s conclusions depend on it.
- Based: passes — The paper gives a reason why it holds.
It may state two separate claims as one.
What the paper did — it cites no source for this, so there is none to check. The quote shows it is in the paper.
In the paper
“For the thermal channels, AVHRRs brightness temperatures are re-calibrated on-orbit (see below under ‘Harmonisation’) and improvements to flagging of solar contamination events are implemented.”
§ Satellite-based time-series of sea-surface temperature since 1981 for climate applications > Methods > Input data
plain- Asserted: passes — The authors put it forward as true.
- Checkable: passes — It can be checked against evidence.
- Load-bearing: passes — The paper’s conclusions depend on it.
- Based: passes — The paper gives a reason why it holds.
Probably not a substantial claim. It may state two separate claims as one.
What the paper did — it cites no source for this, so there is none to check. The quote shows it is in the paper.
In the paper
“The trace gas concentrations evolve in time in order to ensure that their secular trends do not cause trend artefacts in SST retrievals.”
§ Satellite-based time-series of sea-surface temperature since 1981 for climate applications > Methods > Radiative transfer modeling
plaindirect- Asserted: passes — The authors put it forward as true.
- Checkable: passes — It can be checked against evidence.
- Load-bearing: passes — The paper’s conclusions depend on it.
- Based: passes — The paper gives a reason why it holds.
Probably not a substantial claim.
What the paper did — it cites no source for this, so there is none to check. The quote shows it is in the paper.
In the paper
“Atmospherically smoothed SSTs are preferable for ATSR SSTs to reduce the SST noise at full spatial resolution.”
§ Satellite-based time-series of sea-surface temperature since 1981 for climate applications > Methods > Retrieval of skin SST
plaindirect- Asserted: passes — The authors put it forward as true.
- Checkable: passes — It can be checked against evidence.
- Load-bearing: fails — The paper’s conclusions may not depend on it.
- Based: passes — The paper gives a reason why it holds.
Probably not a substantial claim. The paper’s conclusions may not depend on it.
In the paper
“For reflectance wavelengths, a previously published approach to calibration (“PATMOS-X”) is adopted18, which has a stated uncertainty of 2% across sensors.”
§ Satellite-based time-series of sea-surface temperature since 1981 for climate applications > Methods > Input data
What the sources say
- Not checked — no full text of the sourcecites [18] Heidinger, A. K., Straka, W. C. III., Molling, C. C., Sullivan, J. T. & Wu, X. Deriving and inter-sensor consistent calibration for the AVHRR solar reflectance data record. International Journal of Remote Sensing 31, 6493–6517 (2010). source
plain- Asserted: passes — The authors put it forward as true.
- Checkable: passes — It can be checked against evidence.
- Load-bearing: fails — The paper’s conclusions may not depend on it.
- Based: passes — The paper gives a reason why it holds.
Probably not a substantial claim. The paper’s conclusions may not depend on it. It may state two separate claims as one.
A conclusion the paper draws from its own results — it cites no other source for it, so there is none to check. The quote shows it is in the paper.
In the paper
“Such an adjustment for skin-to-depth and local-time-of-day effects has only, to our knowledge, been done for this CDR and its precursors.”
§ Satellite-based time-series of sea-surface temperature since 1981 for climate applications > Background & Summary
hedged- Asserted: passes — The authors put it forward as true.
- Checkable: passes — It can be checked against evidence.
- Load-bearing: fails — The paper’s conclusions may not depend on it.
- Based: fails — The paper may give no reason why it holds.
Probably not a substantial claim. The paper’s conclusions may not depend on it. The paper may give no reason why it holds.
What the paper did — it cites no source for this, so there is none to check. The quote shows it is in the paper.
In the paper
“Single-pixel SSTs, rather than atmospherically smoothed, are used as input to the L3U product since averaging to 0.05° in any case averages down the independent random noise, and the propagation of uncertainty from single-pixel SSTs is simpler.”
§ Satellite-based time-series of sea-surface temperature since 1981 for climate applications > Methods > Retrieval of skin SST
plaindirect- Asserted: passes — The authors put it forward as true.
- Checkable: passes — It can be checked against evidence.
- Load-bearing: passes — The paper’s conclusions depend on it.
- Based: passes — The paper gives a reason why it holds.
It may state two separate claims as one.
What the paper did — it cites no source for this, so there is none to check. The quote shows it is in the paper.
In the paper
“Manual verification of the product metadata against the PSD is done using two randomly selected products from the dataset for each processing level. Global metadata and the attributes of each variable are checked against the prescribed values defined in the PSD.”
§ Satellite-based time-series of sea-surface temperature since 1981 for climate applications > Technical Validation > Verification processes
plain- Asserted: passes — The authors put it forward as true.
- Checkable: passes — It can be checked against evidence.
- Load-bearing: fails — The paper’s conclusions may not depend on it.
- Based: passes — The paper gives a reason why it holds.
Probably not a substantial claim. The paper’s conclusions may not depend on it.
A conclusion the paper draws from its own results — it cites no other source for it, so there is none to check. The quote shows it is in the paper.
In the paper
“When averaging n L2P SSTs to make daily 0.05° gridded L3 products, the uncertainty from random errors decreases from “1/√n” averaging, whereas the uncertainty from the other two components does not.”
§ Satellite-based time-series of sea-surface temperature since 1981 for climate applications > Methods > Gridded SST products
plaindirect- Asserted: passes — The authors put it forward as true.
- Checkable: passes — It can be checked against evidence.
- Load-bearing: unclear — It is unclear whether the paper’s conclusions depend on it.
- Based: passes — The paper gives a reason why it holds.
It may state two separate claims as one.
What the paper did — it cites no source for this, so there is none to check. The quote shows it is in the paper.
In the paper
“The automated quality assessment of L2P and L3U consists of checks that are configurable for each product level and are applied to every file in the dataset. The checks consist of basic checks (file name follows the convention, file can be read, etc) and specific checks on the data (all variables exist, data are within prescribed boundaries, etc).”
§ Satellite-based time-series of sea-surface temperature since 1981 for climate applications > Technical Validation > Verification processes
plain- Asserted: passes — The authors put it forward as true.
- Checkable: passes — It can be checked against evidence.
- Load-bearing: fails — The paper’s conclusions may not depend on it.
- Based: passes — The paper gives a reason why it holds.
Probably not a substantial claim. The paper’s conclusions may not depend on it. It may state two separate claims as one. The quote only partly states this claim.
In the paper
“For all levels of SST CCI data in each public release, technical verification and quality tasks are undertaken, consisting of three steps: automated inspection of all files; visual inspection of a random subset; and manual verification of metadata against the product specification document (PSD)54.”
§ Satellite-based time-series of sea-surface temperature since 1981 for climate applications > Technical Validation > Verification processes
What the sources say
- Not matchedcites [54] Sea Surface Temperature CCI Phase-II Product Specification Document, SST_CCI-PSD-UKMO-201 (PSD), version 2, 2017-05-09, available at, http://www.esa-sst-cci.org.
Couldn’t be matched to a paper in Crossref, so it can’t be checked.
plain- Asserted: passes — The authors put it forward as true.
- Checkable: passes — It can be checked against evidence.
- Load-bearing: fails — The paper’s conclusions may not depend on it.
- Based: passes — The paper gives a reason why it holds.
Probably not a substantial claim. The paper’s conclusions may not depend on it. It may state two separate claims as one.
- Not matched
A conclusion the paper draws from its own results — it cites no other source for it, so there is none to check. The quote shows it is in the paper.
In the paper
“(When gridding L2P data to larger and/or longer scales, averaging down of the correlated errors would occur, but this is negligible for one pass on a scale of the grid cell.)”
§ Satellite-based time-series of sea-surface temperature since 1981 for climate applications > Methods > Gridded SST products
hedged- Asserted: passes — The authors put it forward as true.
- Checkable: passes — It can be checked against evidence.
- Load-bearing: fails — The paper’s conclusions may not depend on it.
- Based: fails — The paper may give no reason why it holds.
Probably not a substantial claim. The paper’s conclusions may not depend on it. The paper may give no reason why it holds.
A conclusion the paper draws from its own results — it cites no other source for it, so there is none to check. The quote shows it is in the paper.
In the paper
“The solution found by the minimum therefore balances the information carried forward from the previous day with the information added by new observations, in the light of their relative uncertainty, accounting for correlations in the forecast errors.”
§ Satellite-based time-series of sea-surface temperature since 1981 for climate applications > Methods > Analysed SST
plaindirect- Asserted: passes — The authors put it forward as true.
- Checkable: passes — It can be checked against evidence.
- Load-bearing: fails — The paper’s conclusions may not depend on it.
- Based: passes — The paper gives a reason why it holds.
Probably not a substantial claim. The paper’s conclusions may not depend on it.
In the paper
“Uncertainty information is also provided in the L4 products, which is estimated using an analysis quality method46.”
§ Satellite-based time-series of sea-surface temperature since 1981 for climate applications > Methods > Analysed SST
What the sources say
- Not checked — no full text of the sourcecites [46] Donlon, C. J. et al. The Operational Sea Surface Temperature and Sea Ice Analysis (OSTIA) system. Remote Sensing of Environment. 116, 140–158 (2012). source
plaindirect- Asserted: passes — The authors put it forward as true.
- Checkable: passes — It can be checked against evidence.
- Load-bearing: unclear — It is unclear whether the paper’s conclusions depend on it.
- Based: passes — The paper gives a reason why it holds.
It may state two separate claims as one.
What the paper did — it cites no source for this, so there is none to check. The quote shows it is in the paper.
In the paper
“The automated verification results are stored per-file and merged into a summary, ensuring traceability of the results.”
§ Satellite-based time-series of sea-surface temperature since 1981 for climate applications > Technical Validation > Verification processes
plaindirect- Asserted: passes — The authors put it forward as true.
- Checkable: passes — It can be checked against evidence.
- Load-bearing: fails — The paper’s conclusions may not depend on it.
- Based: passes — The paper gives a reason why it holds.
Probably not a substantial claim. The paper’s conclusions may not depend on it.
A conclusion the paper draws from its own results — it cites no other source for it, so there is none to check. The quote shows it is in the paper.
In the paper
“Even if the new solution were perfect, δy would be non-zero because of uncertainty (SST measurement errors and representativity effects)”
§ Satellite-based time-series of sea-surface temperature since 1981 for climate applications > Methods > Analysed SST
hedgeddirect- Asserted: passes — The authors put it forward as true.
- Checkable: passes — It can be checked against evidence.
- Load-bearing: fails — The paper’s conclusions may not depend on it.
- Based: passes — The paper gives a reason why it holds.
Probably not a substantial claim. The paper’s conclusions may not depend on it.
What the paper did — it cites no source for this, so there is none to check. The quote shows it is in the paper.
In the paper
“Visual inspections of L4 files were also undertaken.”
§ Satellite-based time-series of sea-surface temperature since 1981 for climate applications > Technical Validation > Verification processes
plain- Asserted: passes — The authors put it forward as true.
- Checkable: passes — It can be checked against evidence.
- Load-bearing: fails — The paper’s conclusions may not depend on it.
- Based: passes — The paper gives a reason why it holds.
Probably not a substantial claim. The paper’s conclusions may not depend on it.
What the paper did — it cites no source for this, so there is none to check. The quote shows it is in the paper.
In the paper
“For the visual inspection, two products of each sensor and processing level are randomly selected, one from early and one from late in the sensor’s useful life.”
§ Satellite-based time-series of sea-surface temperature since 1981 for climate applications > Technical Validation > Verification processes
plain- Asserted: passes — The authors put it forward as true.
- Checkable: passes — It can be checked against evidence.
- Load-bearing: fails — The paper’s conclusions may not depend on it.
- Based: passes — The paper gives a reason why it holds.
Probably not a substantial claim. The paper’s conclusions may not depend on it.
The paper states this without a source or data behind it here, so there is nothing to check it against. The quote shows it is in the paper.
In the paper
“Large values of chi-square indicate that the inter-relationships of the brightness temperatures are not as expected for a clear-sky observation given the background information.”
§ Satellite-based time-series of sea-surface temperature since 1981 for climate applications > Methods > Quality indication
hedgeddirect- Asserted: passes — The authors put it forward as true.
- Checkable: passes — It can be checked against evidence.
- Load-bearing: passes — The paper’s conclusions depend on it.
- Based: passes — The paper gives a reason why it holds.
Probably not a substantial claim.
What the paper did — it cites no source for this, so there is none to check. The quote shows it is in the paper.
In the paper
“Evidence of an observation context in which true uncertainty may be significantly larger than evaluated is one factor in downgrading the quality level attached to an SST.”
§ Satellite-based time-series of sea-surface temperature since 1981 for climate applications > Methods > Uncertainty estimate for skin SST
hedgeddirect- Asserted: passes — The authors put it forward as true.
- Checkable: passes — It can be checked against evidence.
- Load-bearing: fails — The paper’s conclusions may not depend on it.
- Based: passes — The paper gives a reason why it holds.
Probably not a substantial claim. The paper’s conclusions may not depend on it.
A conclusion the paper draws from its own results — it cites no other source for it, so there is none to check. The quote shows it is in the paper.
In the paper
“Since the effect causing the errors reflects aspects of the atmospheric state, the decorrelation scales are related to the length scales of the atmosphere, and are considered likely to be of order 1 day and 100 km.”
§ Satellite-based time-series of sea-surface temperature since 1981 for climate applications > Methods > Uncertainty estimate for skin SST
hedgedcorrelational- Asserted: passes — The authors put it forward as true.
- Checkable: passes — It can be checked against evidence.
- Load-bearing: unclear — It is unclear whether the paper’s conclusions depend on it.
- Based: passes — The paper gives a reason why it holds.
It may state two separate claims as one.
What the paper did — it cites no source for this, so there is none to check. The quote shows it is in the paper.
In the paper
“Three categories of validation were carried out.”
§ Satellite-based time-series of sea-surface temperature since 1981 for climate applications > Technical Validation > Validation against in situ measurements
plain- Asserted: passes — The authors put it forward as true.
- Checkable: passes — It can be checked against evidence.
- Load-bearing: fails — The paper’s conclusions may not depend on it.
- Based: passes — The paper gives a reason why it holds.
Probably not a substantial claim. The paper’s conclusions may not depend on it. The quote only partly states this claim.
What the paper did — it cites no source for this, so there is none to check. The quote shows it is in the paper.
In the paper
“The validation analysis was done for all levels (L2P, L3U and L3C) for both the SST CCI ATSR and SST CCI AVHRR records.”
§ Satellite-based time-series of sea-surface temperature since 1981 for climate applications > Technical Validation > Validation against in situ measurements
plain- Asserted: passes — The authors put it forward as true.
- Checkable: passes — It can be checked against evidence.
- Load-bearing: fails — The paper’s conclusions may not depend on it.
- Based: passes — The paper gives a reason why it holds.
Probably not a substantial claim. The paper’s conclusions may not depend on it. It may state two separate claims as one.
A conclusion the paper draws from its own results — it cites no other source for it, so there is none to check. The quote shows it is in the paper.
In the paper
“The extension is an interim climate data record (ICDR): this means that the scientific basis and practical form are consistent, so that users can validly use the ICDR seamlessly with the longer dataset.”
- Also stated in: § Will the climate data record be extended in time? · boosted
“Nonetheless, the SSTs are recommended for seamless use across the v2.0 ICDR and v2.1 CDR, since the scientific basis is fully consistent.”
§ Satellite-based time-series of sea-surface temperature since 1981 for climate applications > Usage Notes > Will the climate data record be extended in time?
boosteddirect- Asserted: passes — The authors put it forward as true.
- Checkable: passes — It can be checked against evidence.
- Load-bearing: passes — The paper’s conclusions depend on it.
- Based: passes — The paper gives a reason why it holds.
Probably not a substantial claim. It may state two separate claims as one.
- Also stated in: § Will the climate data record be extended in time? · boosted
What the paper did — it cites no source for this, so there is none to check. The quote shows it is in the paper.
In the paper
“The automated inspection was applied to all 465,302 L2P SST products and the same number of L3U SST products.”
§ Satellite-based time-series of sea-surface temperature since 1981 for climate applications > Technical Validation > Verification results
plain- Asserted: passes — The authors put it forward as true.
- Checkable: passes — It can be checked against evidence.
- Load-bearing: fails — The paper’s conclusions may not depend on it.
- Based: passes — The paper gives a reason why it holds.
Probably not a substantial claim. The paper’s conclusions may not depend on it. It may state two separate claims as one.
What the paper did — it cites no source for this, so there is none to check. The quote shows it is in the paper.
In the paper
“To further secure the objectivity of validation results, the personnel performing the validation analysis were independent of the teams undertaking the remote sensing research and product generation.”
§ Satellite-based time-series of sea-surface temperature since 1981 for climate applications > Technical Validation > Validation against in situ measurements
plain- Asserted: passes — The authors put it forward as true.
- Checkable: passes — It can be checked against evidence.
- Load-bearing: fails — The paper’s conclusions may not depend on it.
- Based: passes — The paper gives a reason why it holds.
Probably not a substantial claim. The paper’s conclusions may not depend on it.
- Rests on an assumption: Independence of validation personnel from remote sensing and product generation teams secures the objectivity of validation results.
What the paper did — it cites no source for this, so there is none to check. The quote shows it is in the paper.
In the paper
“The SST CCI analysis (in which no in situ measurements are assimilated) was also validated ‘depth-depth’, in accordance to the definition of the analysis.”
§ Satellite-based time-series of sea-surface temperature since 1981 for climate applications > Technical Validation > Validation against in situ measurements
plain- Asserted: passes — The authors put it forward as true.
- Checkable: passes — It can be checked against evidence.
- Load-bearing: fails — The paper’s conclusions may not depend on it.
- Based: passes — The paper gives a reason why it holds.
Probably not a substantial claim. The paper’s conclusions may not depend on it.
A conclusion the paper draws from its own results — it cites no other source for it, so there is none to check. The quote shows it is in the paper.
In the paper
“that will do not affect the usability of the dataset.”
§ Satellite-based time-series of sea-surface temperature since 1981 for climate applications > Technical Validation > Verification results
plain- Asserted: passes — The authors put it forward as true.
- Checkable: fails — It may be too vague to check against evidence.
- Load-bearing: fails — The paper’s conclusions may not depend on it.
- Based: passes — The paper gives a reason why it holds.
Probably not a substantial claim. It may be too vague to check against evidence. The paper’s conclusions may not depend on it.
The authors state this as an assumption.
In the cloud detection calculation, P(x|c) is assumed equal to P(x).
“This expression simplifies assuming P(x|c) = P(x), since the background state has length scales of ~100 km and does not resolve cloud structures at the finer scales ~1 to ~10 km relevant to the cloudiness of individual pixels.”
The authors state this as an assumption.
The smooth-atmosphere-but-variable-SST assumption: TCWV for the centre pixel and surrounding clear pixels are identical.
“The smooth-atmosphere-but-variable-SST assumption is imposed by fixing the TCWV for the centre pixel and the surrounding clear pixels to be identical (hence only one TCWV term in z).”
The paper relies on this without support.
Many users seek an estimate of SST at depths of order tens of centimetres.
“many users seek an estimate of SST at depths of order tens of centimetres, whether because this makes the observations compatible with many historic in situ SSTs from drifting buoys and bucket measurements, or because this depth is more comparable to the upper layer of an ocean model.”
The paper relies on this without support.
Users typically treat the gridded SST as a value representative of the cell as a whole.
“users typically treat the gridded SST as a value representative of the cell as a whole”
The authors state this as an assumption.
The errors in the new SSTs are uncorrelated within the analysis system.
“For computational simplicity, the errors in the new SSTs are assumed to be uncorrelated within the analysis system.”
The paper relies on this without support.
The degree of independence between the measurements being compared is important in interpreting validation results.
“In interpreting validation results, the degree of independence between the measurements being compared is important.”
The paper relies on this without support.
Independence of validation personnel from remote sensing and product generation teams secures the objectivity of validation results.
“To further secure the objectivity of validation results, the personnel performing the validation analysis were independent of the teams undertaking the remote sensing research and product generation.”
Claims other papers make about this one
Each is checked against this paper’s own text: does it say what the citing paper says it does?
The source backs part of the claim, not all of it — or backs it for a different population, condition or comparison.
In the citing paper
“This dataset is to the maximum degree possible independent of in-situ observations2.”
From Tendencies, variability and persistence of sea surface temperature anomalies (2020) · cites this paper as [2]
Experimental — accuracy not yet measuredThe source backs part of the claim, not all of it — or backs it for a different population, condition or comparison.
In the citing paper
“The dataset is strengthened with respect to other analysis products by the inclusion of data from the Along-Track Scanning Radiometer instruments, designed specifically to retrieve surface temperature rather than for more general meteorological applications.”
From Tendencies, variability and persistence of sea surface temperature anomalies (2020) · cites this paper as [2]
Experimental — accuracy not yet measuredThe source backs part of the claim, not all of it — or backs it for a different population, condition or comparison.
In the citing paper
“Where dust events are not flagged as cloud in the retrieval, they tend to bias the retrieved SST cold2,61,62 and can cause an artificial timescale in the SSTA correlation, which then appears as short-term SSTA persistence.”
From Tendencies, variability and persistence of sea surface temperature anomalies (2020) · cites this paper as [2]
Experimental — accuracy not yet measuredThe source backs part of the claim, not all of it — or backs it for a different population, condition or comparison.
In the citing paper
“This is an artefact of the SST data, where the retrieval is not robust to high concentrations of desert dust.”
From Tendencies, variability and persistence of sea surface temperature anomalies (2020) · cites this paper as [2]
Experimental — accuracy not yet measuredThe cited source says what the claim attributes to it.
In the citing paper
“Where dust events are not flagged as cloud in the retrieval, they tend to bias the retrieved SST cold2,61,62 and can cause an artificial timescale in the SSTA correlation, which then appears as short-term SSTA persistence.”
From Tendencies, variability and persistence of sea surface temperature anomalies (2020) · cites this paper as [2]
The check wasn’t confident either way, so it gives no verdict — never disputed.
In the citing paper
“The temporary rise in uncertainties in 2000–01 results from instrument issues2”
From Tendencies, variability and persistence of sea surface temperature anomalies (2020) · cites this paper as [2]
Experimental — accuracy not yet measured
Self-check
Percentages, sums and reported differences re-computed from the paper’s own numbers.
Each contradiction between two passages listed here was confirmed by an independent check.
Rated minor: it would not touch a result — a value no result rests on, a p-value that stays on the same side of the significance level, or a conflict that is clerical, resolved elsewhere in the paper, or outside its own findings.
In the paper
§ Satellite-based time-series of sea-surface temperature since 1981 for climate applications > Methods > Cloud detection
“SSTs are evaluated for those pixels for which the posterior probability of clear sky, P(c|y, x), exceeds 90% (case of ATSR series) or 99% (case of AVHRR series).”
§ Satellite-based time-series of sea-surface temperature since 1981 for climate applications > Methods > Quality indication
“The Pclear threshold of 0.90 for designation as QL > 3 is for the ATSRs and AVHRRs at night-time, and for AVHRRs observations during daytime is instead 0.99.”
Citations
Cites
The ERA‐Interim reanalysis: configuration and performance of the data assimilation system
Dee, D. P., Uppala, S. M., Simmons, A. J., Berrisford, P., Poli, P., Kobayashi, S., Andrae, U., Balmaseda, M. A., Balsamo, G., Bauer, P., et al. (2011) · Quarterly Journal of the Royal Meteorological Society · doi:10.1002/qj.828 · Cited by 24,480
The HITRAN2016 molecular spectroscopic database
Gordon, I. E., Rothman, L. S., Hill, C., Kochanov, R. V., Tan, Y., Bernath, P. F., Birk, M., Boudon, V., Campargue, A., Chance, K. V., et al. (2017) · Journal of Quantitative Spectroscopy and Radiative Transfer · doi:10.1016/j.jqsrt.2017.06.038 · Cited by 7,721
The HITRAN 2008 molecular spectroscopic database
Rothman, L. S., Gordon, I. E., Barbe, A., Benner, D. C., Bernath, P. F., Birk, M., Boudon, V., Brown, L. R., Campargue, A., Champion, J. P., et al. (2009) · Journal of Quantitative Spectroscopy and Radiative Transfer · doi:10.1016/j.jqsrt.2009.02.013 · Cited by 3,339
Atmospheric radiative transfer modeling: a summary of the AER codes
Clough, S. A., Shephard, M. W., Mlawer, E. J., Delamere, J. S., Iacono, M. J., Cady‐Pereira, K., Boukabara, S., & Brown, P. D. (2004) · Journal of Quantitative Spectroscopy and Radiative Transfer · doi:10.1016/j.jqsrt.2004.05.058 · Cited by 2,005
The Operational Sea Surface Temperature and Sea Ice Analysis (OSTIA) system
Donlon, C. J., Martin, M., Stark, J., Roberts-Jones, J., Fiedler, E., & Wimmer, W. (2012) · Remote Sensing of Environment · doi:10.1016/j.rse.2010.10.017 · Cited by 1,394
Self-citationEvaluation of the ECMWF ocean reanalysis system ORAS4
Balmaseda, M., Mogensen, K. S., & Weaver, A. (2012) · Quarterly Journal of the Royal Meteorological Society · doi:10.1002/qj.2063 · Cited by 1,066
An update on the RTTOV fast radiative transfer model (currently at version 12)
Saunders, R. W., Hocking, J., Turner, E., Rayer, P. J., Rundle, D. A., Brunel, P., Vidot, J., Roquet, P., Matricardi, M., Geer, A., et al. (2018) · Geoscientific model development · doi:10.5194/gmd-11-2717-2018 · Cited by 618
Titchner, H., & Rayner, N. A. (2014) · Journal of Geophysical Research Atmospheres · doi:10.1002/2013jd020316 · Cited by 533
Development and recent evaluation of the MT_CKD model of continuum absorption
Mlawer, E. J., Payne, V. H., Moncet, J., et al. (2012) · Philosophical Transactions of the Royal Society A Mathematical Physical and Engineering Sciences · doi:10.1098/rsta.2011.0295 · Cited by 482
Kennedy, J., Rayner, N. A., Smith, R. O., Parker, D. E., & Saunby, M. (2011) · Journal of Geophysical Research Atmospheres · doi:10.1029/2010jd015218 · Cited by 378
Liu, G., Heron, S., Eakin, C., Muller-Karger, F., Vega-Rodriguez, M., Guild, L., De La Cour, J., Geiger, E., Skirving, W., Burgess, T., et al. (2014) · Remote Sensing · doi:10.3390/rs61111579 · Cited by 337
Slopes of the sea surface deduced from photographs of sun glitter
Cox, C. (1956) · eScholarship (California Digital Library) · Cited by 336
Uncertainty information in climate data records from Earth observation
Merchant, C. J., Paul, F., Popp, T., Ablain, M., Bontemps, S., Defourny, P., Hollmann, R., Lavergne, T., Laeng, A., de Leeuw, G., et al. (2017) · Earth System Science Data · doi:10.5194/essd-9-511-2017 · Cited by 201
Self-citationMartin, M. J., Dash, P., Ignatov, A. M., Banzon, V. F., Beggs, H., Brasnett, B., Cayula, J.-F., Cummings, J. A., Donlon, C. J., Gentemann, C. L., et al. (2012) · Deep Sea Research Part II Topical Studies in Oceanography · doi:10.1016/j.dsr2.2012.04.013 · Cited by 182
Deriving an inter-sensor consistent calibration for the AVHRR solar reflectance data record
Heidinger, A. K., Straka, W. C., Molling, C. C., Sullivan, J. T., & Wu, X. (2010) · International Journal of Remote Sensing · doi:10.1080/01431161.2010.496472 · Cited by 159
Multi‐satellite measurements of large diurnal warming events
Gentemann, C. L., Minnett, P. J., Le Borgne, P., & Merchant, C. J. (2008) · Geophysical Research Letters · doi:10.1029/2008gl035730 · Cited by 155
Self-citationMerchant, C. J., Harris, A. R., Maturi, E., & Maccallum, S. (2005) · Quarterly Journal of the Royal Meteorological Society · doi:10.1256/qj.05.15 · Cited by 146
Self-citationLamarche, C., Santoro, M., Bontemps, S., d’Andrimont, R., Radoux, J., Giustarini, L., Brockmann, C., Wevers, J., Defourny, P., & Arinò, O. (2017) · Remote Sensing · doi:10.3390/rs9010036 · Cited by 140
Measurements of the oceanic thermal skin effect
Minnett, P. J., Smith, M., & Ward, B. (2011) · Deep Sea Research Part II: Topical Studies in Oceanography · doi:10.1016/j.dsr2.2010.10.024 · Cited by 129
Merchant, C. J., Embury, O., Le Borgne, P., & Bellec, B. (2006) · Remote Sensing of Environment · doi:10.1016/j.rse.2006.03.007 · Cited by 124
Self-citationAssessing recent warming using instrumentally homogeneous sea surface temperature records
Hausfather, Z., Cowtan, K., Clarke, D. C., Jacobs, P., Richardson, M., & Rohde, R. (2017) · Science Advances · doi:10.1126/sciadv.1601207 · Cited by 119
Evaluation and selection of SST regression algorithms for JPSS VIIRS
Petrenko, B., Ignatov, A. M., Kihai, Y., Stroup, J., & Dash, P. (2014) · Journal of Geophysical Research Atmospheres · doi:10.1002/2013jd020637 · Cited by 113
Merchant, C. J., Harris, A. R., Murray, M. J., & Závody, A. M. (1999) · Journal of Geophysical Research: Oceans · doi:10.1029/1999jc900105 · Cited by 112
Self-citationMeasurements of the evolution of the Mt. Pinatubo aerosol cloud by ISAMS
Lambert, A., Grainger, R. G., Remedios, J. J., Rodgers, C. D., Corney, M., & Taylor, F. W. (1993) · Geophysical Research Letters · doi:10.1029/93gl00827 · Cited by 110
Embury, O., Merchant, C. J., & Corlett, G. K. (2012) · Remote Sensing of Environment · doi:10.1016/j.rse.2011.02.028 · Cited by 97
Self-citationA Call for New Approaches to Quantifying Biases in Observations of Sea Surface Temperature
Kent, E. C., Kennedy, J. J., Smith, T. M., Hirahara, S., Huang, B., Kaplan, A., Parker, D. E., Atkinson, C. P., Berry, D. I., Carella, G., et al. (2017) · Bulletin of the American Meteorological Society · doi:10.1175/bams-d-15-00251.1 · Cited by 97
Self-citationApplying principles of metrology to historical Earth observations from satellites
Mittaz, J., Merchant, C. J., & Woolliams, E. R. (2019) · Metrologia · doi:10.1088/1681-7575/ab1705 · Cited by 96
Self-citationBaran, A. J., & Foot, J. S. (1994) · Journal of Geophysical Research Atmospheres · doi:10.1029/94jd02044 · Cited by 91
Merchant, C. J., Harris, A. R., Roquet, H., & Le Borgne, P. (2009) · Geophysical Research Letters · doi:10.1029/2009gl039843 · Cited by 91
Self-citationThe 1982 El Chichón Volcano eruptions — A satellite perspective
Matson, M. (1984) · Journal of Volcanology and Geothermal Research · doi:10.1016/0377-0273(84)90054-4 · Cited by 65
Fiedler, E., Mao, C., Good, S., Waters, J. C., & Martin, M. J. (2019) · Quarterly Journal of the Royal Meteorological Society · doi:10.1002/qj.3644 · Cited by 57
Embury, O., Merchant, C. J., & Filipiak, M. J. (2012) · Remote Sensing of Environment · doi:10.1016/j.rse.2010.10.016 · Cited by 53
Self-citationMerchant, C. J., Borgne, P. L., Roquet, H., & Legendre, G. (2013) · Remote Sensing of Environment · doi:10.1016/j.rse.2012.12.019 · Cited by 52
Self-citationBulgin, C. E., Embury, O., Corlett, G., & Merchant, C. J. (2016) · Remote Sensing of Environment · doi:10.1016/j.rse.2016.02.022 · Cited by 46
Self-citationRetrievals of sea surface temperature from infrared imagery: origin and form of systematic errors
Merchant, C. J., Horrocks, L. A., Eyre, J. R., & O'carroll, A. G. (2006) · Quarterly Journal of the Royal Meteorological Society · doi:10.1256/qj.05.143 · Cited by 43
Self-citationBulgin, C. E., Embury, O., & Merchant, C. J. (2016) · Remote Sensing of Environment · doi:10.1016/j.rse.2016.02.021 · Cited by 40
Self-citationClimatological diurnal variability in sea surface temperature characterized from drifting buoy data
Morak‐Bozzo, S., Merchant, C. J., Kent, E. C., Berry, D. I., & Carella, G. (2016) · Geoscience Data Journal · doi:10.1002/gdj3.35 · Cited by 39
Self-citationGlobal validation of the along‐track scanning radiometer against drifting buoys
Harris, A. R., & Saunders, M. A. (1996) · Journal of Geophysical Research Atmospheres · doi:10.1029/96jc00317 · Cited by 34
Carrea, L., Embury, O., & Merchant, C. J. (2015) · Geoscience Data Journal · doi:10.1002/gdj3.32 · Cited by 31
Self-citationGood, S. A., Embury, O., Bulgin, C. E., et al. (2019) · NERC Environmental Data Service · doi:10.5285/62c0f97b1eac4e0197a674870afe1ee6 · Cited by 31
Self-citationBulgin, C., Mittaz, J., Embury, O., Eastwood, S., & Merchant, C. (2018) · Remote Sensing · doi:10.3390/rs10010097 · Cited by 29
Self-citationAn infrared desert dust index for the Along-Track Scanning Radiometers
Good, E. J., Kong, X., Embury, O., Merchant, C. J., & Remedios, J. J. (2012) · Remote Sensing of Environment · doi:10.1016/j.rse.2010.06.016 · Cited by 26
Self-citationUncertainty propagation in observational references to climate model scales
Bellprat, O., Massonnet, F., Siegert, S., Prodhomme, C., Macias-Gómez, D., Guemas, V., & Doblas-Reyes, F. (2017) · Remote Sensing of Environment · doi:10.1016/j.rse.2017.06.034 · Cited by 25
A Novel Framework to Harmonise Satellite Data Series for Climate Applications
Giering, R., Quast, R., Mittaz, J. P. D., Hunt, S. E., Harris, P. M., Woolliams, E. R., & Merchant, C. J. (2019) · Remote Sensing · doi:10.3390/rs11091002 · Cited by 21
Self-citationComparison of SST Diurnal Variation Models Over the Tropical Warm Pool Region
Zhang, H., Beggs, H., Merchant, C. J., Wang, X. H., Majewski, L., Kiss, A. E., Rodríguez, J., Thorpe, L., Gentemann, C., & Brunke, M. (2018) · Journal of Geophysical Research: Oceans · doi:10.1029/2017jc013517 · Cited by 21
Self-citationSimulation and Inversion of Satellite Thermal Measurements
Merchant, C. J., & Embury, O. (2014) · Experimental methods in the physical sciences · doi:10.1016/b978-0-12-417011-7.00015-5 · Cited by 14
Self-citationRefractive indices (500-3500 cm-) and emissivity (600-3350 cm-1) of pure water and seawater
Embury, O., Merchant, C. J., & Filipiak, M. J. (2008) · University of Edinburgh · doi:10.7488/ds/162 · Cited by 11
Self-citationCarella, G., Morris, A. K. R., Pascal, R. W., Yelland, M. J., Berry, D. I., Morak‐Bozzo, S., Merchant, C. J., & Kent, E. C. (2017) · Quarterly Journal of the Royal Meteorological Society · doi:10.1002/qj.3078 · Cited by 10
Self-citationEmbury, O., Bulgin, C. E., & Mittaz, J. P. D. (2019) · NERC Environmental Data Service · doi:10.5285/916b93aaf1474ce793171a33ca4c5026 · Cited by 6
Self-citationGSICS quarterly. Volume 10, number 2 (2016)
Global Space-Based Inter-Calibration System Coordination Center. (2016) · NOAA Institutional Repository · doi:10.7289/v5gt5k7s · Cited by 6
Embury, O., Bulgin, C. E., & Mittaz, J. P. D. (2019) · NERC Environmental Data Service · doi:10.5285/5db2099606b94e63879d841c87e654ae · Cited by 3
Self-citationEmbury, O., Bulgin, C. E., & Mittaz, J. P. D. (2019) · NERC Environmental Data Service · doi:10.5285/373638ed9c434e78b521cbe01ace5ef7 · Cited by 3
Self-citationEmbury, O., Bulgin, C. E., & Mittaz, J. P. D. (2019) · NERC Environmental Data Service · doi:10.5285/2282b4aeb9f24bc3a1e0961e4d545427 · Cited by 2
Self-citationESA SST CCI v2.1: Code to plot content of example data products
Embury, O. (2019) · Figshare · doi:10.6084/m9.figshare.9777659 · Cited by 2
Self-citationEmbury, O., Bulgin, C. E., & Mittaz, J. P. D. (2019) · NERC Environmental Data Service · doi:10.5285/42f7230ab55641cdac1bba84eabd446a · Cited by 2
Self-citationEmbury, O., Bulgin, C. E., & Mittaz, J. P. D. (2019) · NERC Environmental Data Service · doi:10.5285/7db4459605da4665b6ab9a7102fb4875 · Cited by 1
Self-citationESA SST CCI v2.1: Code to plot content of example data products
Embury, O. (2019) · figshare · doi:10.6084/m9.figshare.9777659.v1
Self-citation
Cited by
Sorted by citations
Friedlingstein, P., O’Sullivan, M., Jones, M. W., Andrew, R. M., Gregor, L., Hauck, J., Quéré, C. L., Luijkx, I. T., Olsen, A. S., Peters, G. P., et al. (2022) · Earth system science data · doi:10.5194/essd-14-4811-2022 · Cited by 2,167
Friedlingstein, P., O'Sullivan, M., Jones, M. W., Andrew, R. M., Bakker, D. C. E., Hauck, J., Landschützer, P., Le Quéré, C., Luijkx, I. T., Peters, G. P., et al. (2023) · Earth System Science Data · doi:10.5194/essd-15-5301-2023 · Cited by 1,500
Improvements of the Daily Optimum Interpolation Sea Surface Temperature (DOISST) Version 2.1
Huang, B., Liu, C., Banzon, V. F., Freeman, E., Graham, G., Hankins, B., Smith, T., & Zhang, H. (2020) · Journal of Climate · doi:10.1175/jcli-d-20-0166.1 · Cited by 1,406
“These products include the Met Office Hadley Centre Ice and SST (HadISST; Rayner et al. 2003), Weekly Optimum Interpolation SST (WOISST; Reynolds et al. 2002), Daily Optimum Interpolation, version 2.0 (DOISST v2.”
InfluentialDigitalization to achieve sustainable development goals: Steps towards a Smart Green Planet
Mondéjar, M. E., Avtar, R., Díaz, H. L. B., Dubey, R. K., Esteban, J., Gómez‐Morales, A., Hallam, B. J., Mbungu, N. T., Okolo, C. C., Prasad, K. A., et al. (2021) · The Science of The Total Environment · doi:10.1016/j.scitotenv.2021.148539 · Cited by 988
Good, S., Fiedler, E., Mao, C., Martin, M. J., Maycock, A., Reid, R., Roberts-Jones, J., Searle, T., Waters, J., While, J., et al. (2020) · Remote Sensing · doi:10.3390/rs12040720 · Cited by 585
“The system is also used to create historical datasets of foundation SST (the dataset resulting from an old version of the OSTIA system is described in [6]) and as part of ESA’s Climate Change Initiative to generate fields that represent the daily average SST at 20 cm depth [7,8].”
MethodSelf-citation
Metadata
- Authors
- Merchant, C. J., Embury, O., Bulgin, C. E., Block, T., Corlett, G. K., Fiedler, E., Good, S. A., Mittaz, J., Rayner, N. A., Berry, D., Eastwood, S., Taylor, M., Tsushima, Y., Waterfall, A., Wilson, R., & Donlon, C.
- Venue
- Scientific Data
- Published
- 2019-10-22
- Volume
- 6
- Issue
- 1
- Pages
- 223-223
- ISSN
- 2052-4463 (ISSN-L)
- PMC
- PMC6805873
- OpenAlex
- W2981879507
- Semantic Scholar
- dca25a4b98ec1bc0da3ba566e7258358e647ccbe
- Cited by
- 520
- References
- 56
- Citations by year
- 2026: 27 · 2025: 88 · 2024: 89 · 2023: 94 · 2022: 111 · 2021: 77 · 2020: 27 · 2019: 4
- Type
- data paper
- Language
- en
- Open access
- gold
- doi.org
- Locations
- Scientific Data (publishedVersion, cc-by)
- PubMed (publishedVersion)
- CentAUR (University of Reading) (acceptedVersion, cc-by)
- UEA Digital Repository (University of East Anglia) (acceptedVersion, cc-by)
- PubMed Central (submittedVersion, cc-by)
- DOAJ (DOAJ: Directory of Open Access Journals) (submittedVersion)
- ePubs (Science and Technology Facilities Council, Research Councils UK) (submittedVersion)
- Funders
- European Space Agency (4000109848/13/I-NB)
- Topics
- Physical Sciences › Earth and Planetary Sciences › Oceanography › Oceanographic and Atmospheric Processes
- Physical Sciences › Environmental Science › Global and Planetary Change › Climate variability and models
- Physical Sciences › Earth and Planetary Sciences › Oceanography › Ocean Waves and Remote Sensing
- Keywords
- sea surface temperature, satellite SST, climate data record, thermal infrared radiance, drifting buoys, skin temperature, sea surface temperature anomalies, marine heatwaves, ocean variability, ocean model evaluation
About these checks
Registry, retraction, Cites and statistics results are computed, not judged, with one exception: a printed reference that no index lists is read once by a model before it counts as a citation error. Claims are extracted by a model and kept only when their quote appears verbatim in the text; each cited source is then checked, with a model’s help, for whether it says what the claim relies on. Those verdicts can be wrong — read the claim’s quote and the cited source before relying on one.
A language model drew the claims from the paper on 2026-10-16, under version 3 of the claim definition (model deepseek-v4.1-flash, prompt extract-v3).
A second model labelled each claim on 2026-10-16 (model jev-1.13-20260917, definition revision gold-guideline-v0.2).
Cited sources are checked with a language model’s help (gpt-6-sol).
Statistics and arithmetic are recomputed, not judged.
Confidence bands are shown only for fields calibrated on our annotated test set. None is calibrated yet, so no band is shown.
What counts as a claim ›How we measure confidence ›How we check this ›
Are you an author, or do you see a problem with this page? Request a review
