

The DOI matches its Crossref record; 59 of the 59 references it cites were found in a registry or an index.
Brain Cell Type Specific Gene Expression and Co-expression Network Architectures
Open accessAbstract
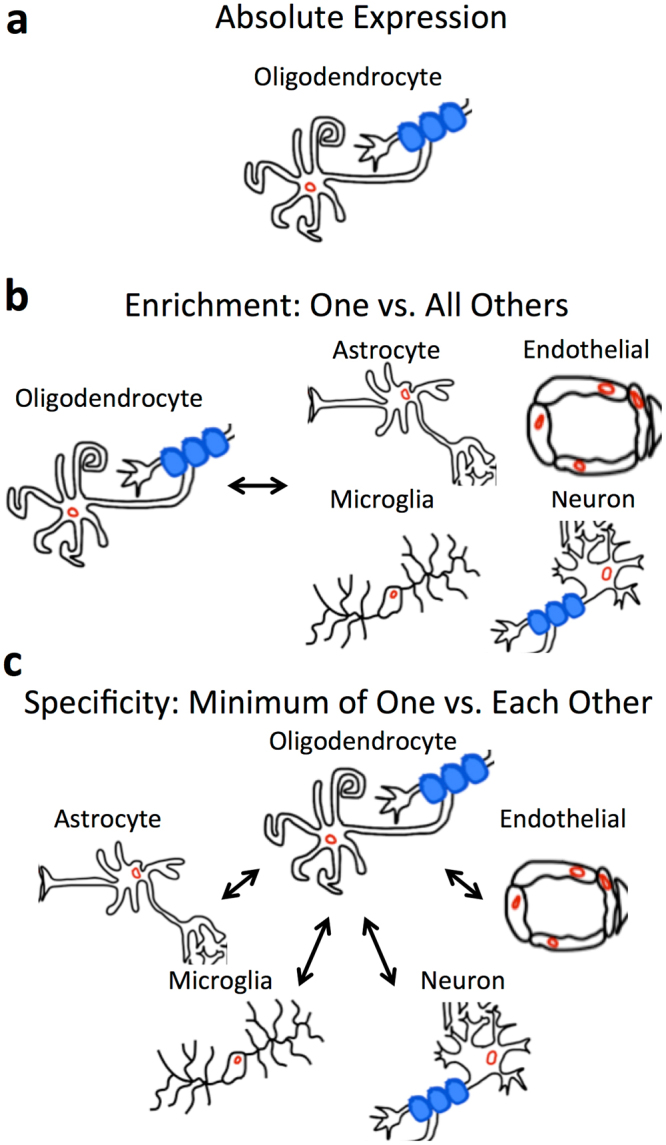
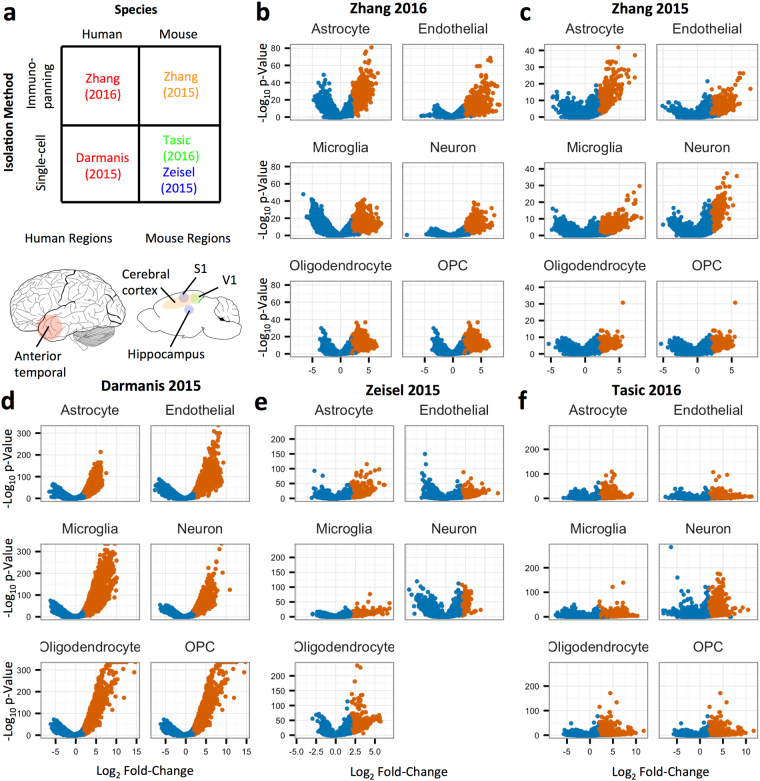
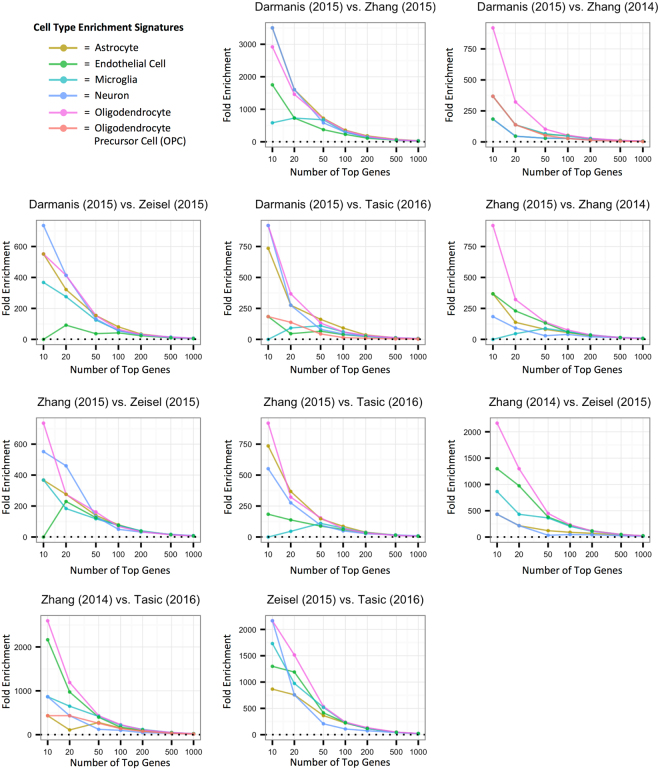
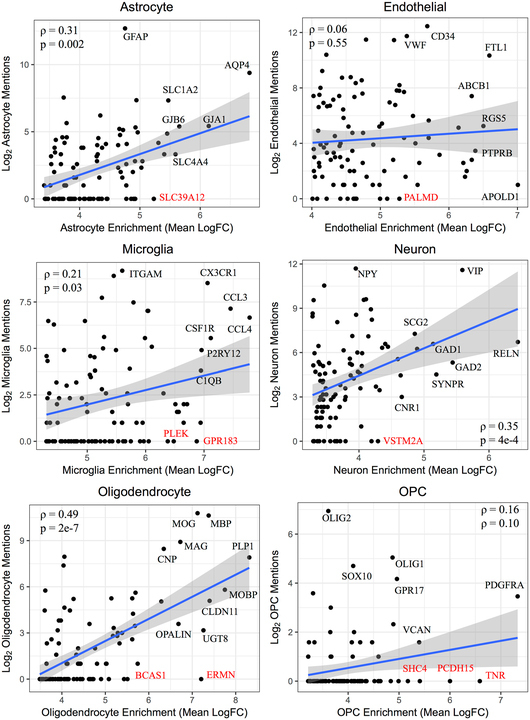
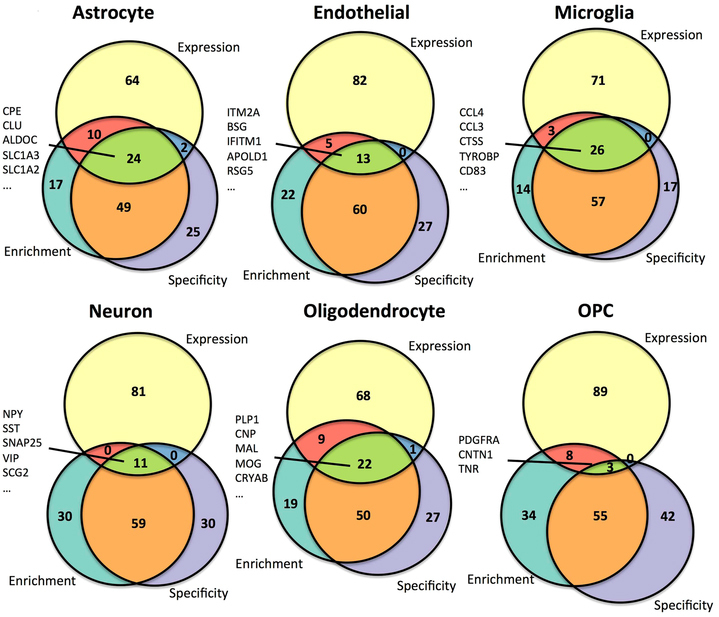
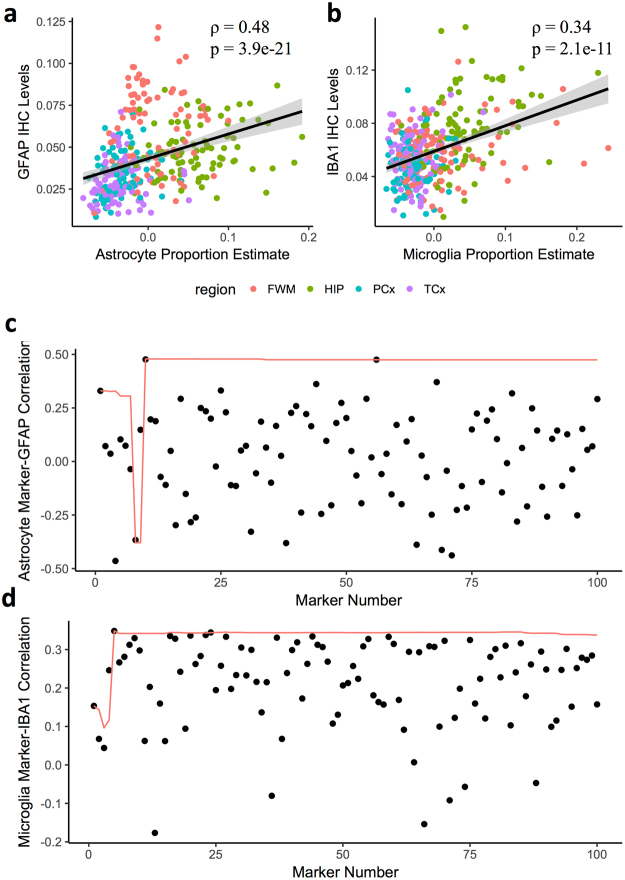
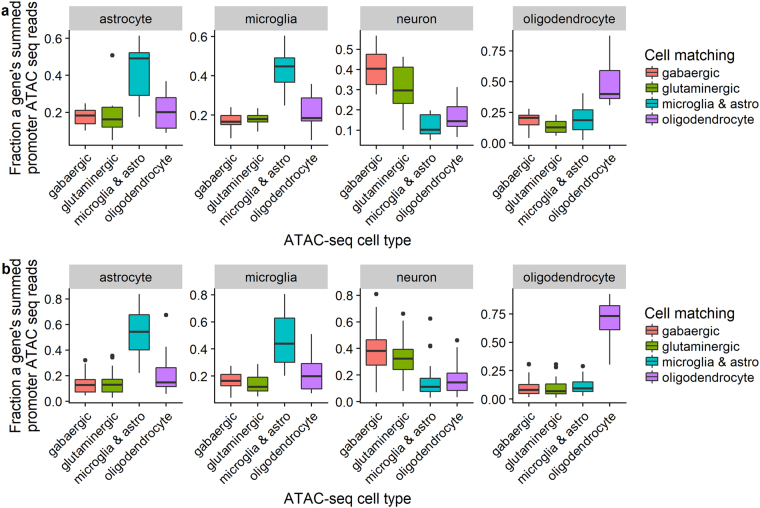
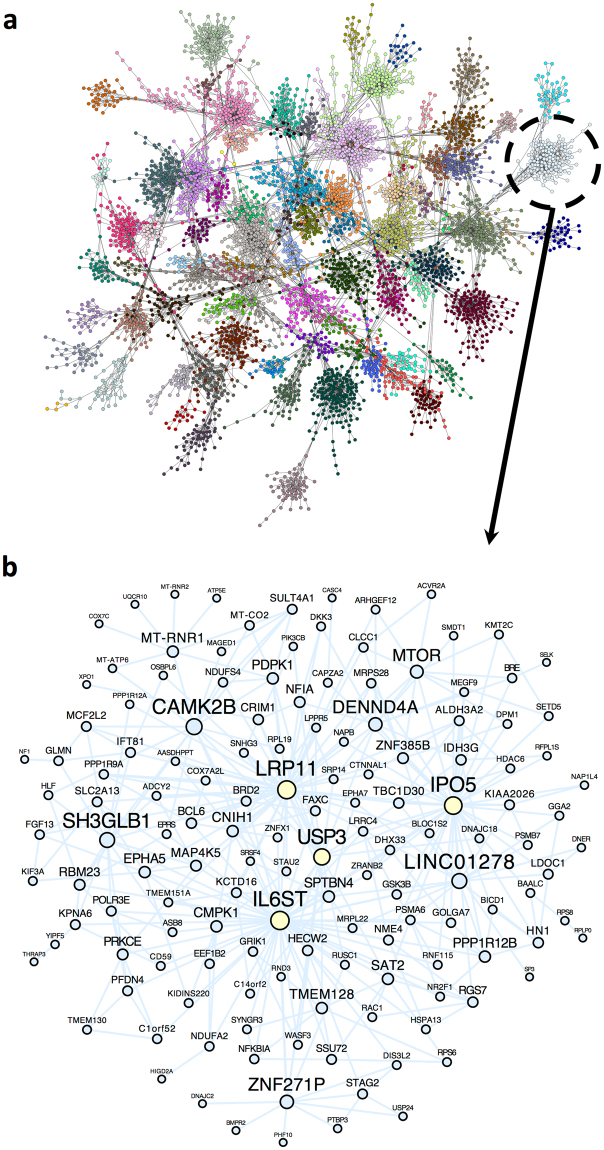
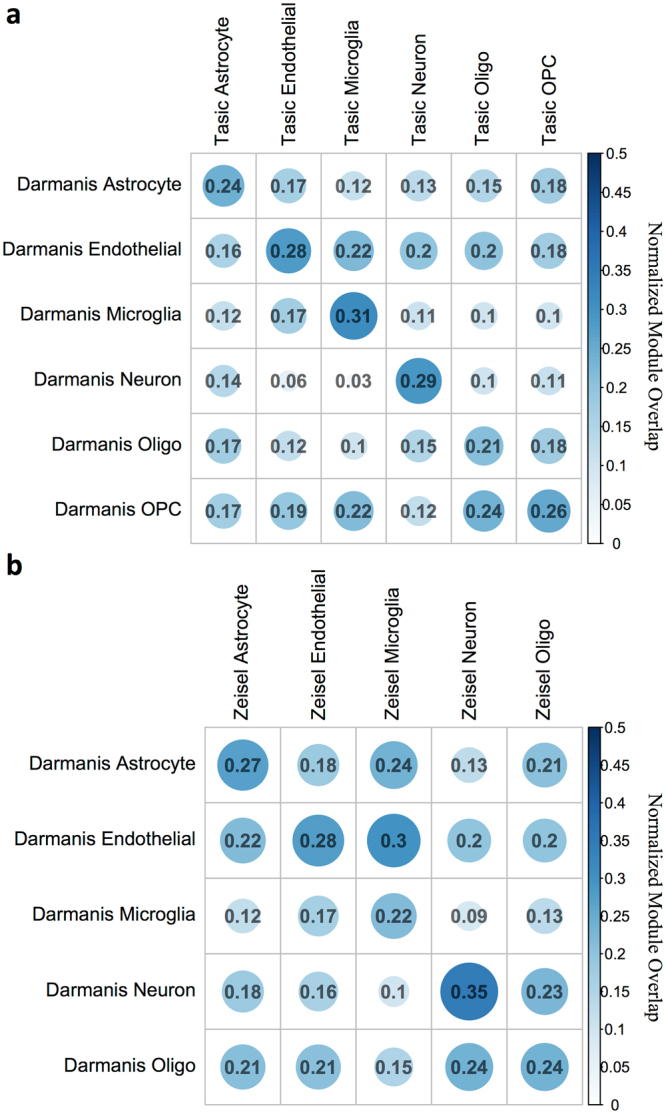
Elucidating brain cell type specific gene expression patterns is critical towards a better understanding of how cell-cell communications may influence brain functions and dysfunctions. We set out to compare and contrast five human and murine cell type-specific transcriptome-wide RNA expression data sets that were generated within the past several years. We defined three measures of brain cell type-relative expression including specificity, enrichment, and absolute expression and identified corresponding consensus brain cell “signatures,” which were well conserved across data sets. We validated that the relative expression of top cell type markers are associated with proxies for cell type proportions in bulk RNA expression data from postmortem human brain samples. We further validated novel marker genes using an orthogonal ATAC-seq dataset. We performed multiscale coexpression network analysis of the single cell data sets and identified robust cell-specific gene modules. To facilitate the use of the cell type-specific genes for cell type proportion estimation and deconvolution from bulk brain gene expression data, we developed an R package, BRETIGEA. In summary, we identified a set of novel brain cell consensus signatures and robust networks from the integration of multiple datasets and therefore transcend limitations related to technical issues characteristic of each individual study.
Overview
The claims and statistics of this paper haven’t been checked yet.
Run the check — free, no account needed. It reads the open-access text and checks the sources it cites.
Integrity signals
Registry
Cites
Statistics
Figures
Verification
Claims the paper makes
The claims and statistics of this paper haven’t been checked yet.
Run the check — free, no account needed. It reads the open-access text and checks the sources it cites.
Claims other papers make about this one
Each is checked against this paper’s own text: does it say what the citing paper says it does?
The source backs part of the claim, not all of it — or backs it for a different population, condition or comparison.
In the citing paper
“The cell clusters were annotated manually using marker genes that were conserved between both conditions as astrocytes, microglia, neurons, endothelial cells, ependymal cells, and mixed glia (Supplementary Data 1) (Arneson et al., 2018;McKenzie et al., 2018).”
From Single-cell resolution analysis of the crosstalk between chemogenically activated astrocytes and microglia (2020) · cites this paper as McKenzie et al., 2018
Experimental — accuracy not yet measuredThe cited source says what the claim attributes to it.
In the citing paper
“Canonical CNS cell type markers were compiled from previous studies66–69.”
From APOE4 to APOE2 allelic switching in mice improves Alzheimer’s disease-related metabolic signatures, neuropathology and cognition (2025) · cites this paper as [66]
The cited source says what the claim attributes to it.
In the citing paper
“To estimate the cell-type proportion of bulk tissue RNA-seq data used in this study, we perform a cell-type deconvolution on each sample using the brain cell–type marker signatures provided by the BRETIGEA R package (26).”
From Molecular subtyping of Alzheimer’s disease using RNA sequencing data reveals novel mechanisms and targets (2021) · cites this paper as [26]
The cited source says what the claim attributes to it.
In the citing paper
“All cell clusters were annotated manually based on marker genes that were conserved between the saccharin group and the CNO group and gene lists present in literature (Arneson et al., 2018;McKenzie et al., 2018).”
From Single-cell resolution analysis of the crosstalk between chemogenically activated astrocytes and microglia (2020) · cites this paper as McKenzie et al., 2018
The cited source says what the claim attributes to it.
In the citing paper
“We used a consensus top ranked cell type-specific marker set from a recent meta-analysis of multiple cell type-specific and single cell RNAseq datasets (McKenzie et al., 2018).”
From Cholesterol and matrisome pathways dysregulated in astrocytes and microglia (2022) · cites this paper as McKenzie et al., 2018
Self-check
Percentages, sums and reported differences re-computed from the paper’s own numbers.
The self-check needs the paper’s full text.
Citations
Cites
Controlling the False Discovery Rate: A Practical and Powerful Approach to Multiple Testing
Benjamini, Y., & Hochberg, Y. (1995) · Journal of the Royal Statistical Society Series B: Statistical Methodology · doi:10.1111/j.2517-6161.1995.tb02031.x · Cited by 109,482
STAR: ultrafast universal RNA-seq aligner
Dobin, A., Davis, C. A., Schlesinger, F., Drenkow, J., Zaleski, C., Jha, S., Batut, P., Chaisson, M., & Gingeras, T. R. (2013) · Bioinformatics · doi:10.1093/bioinformatics/bts635 · Cited by 51,709
Robinson, M. D., McCarthy, D. J., & Smyth, G. K. (2010) · Bioinformatics · doi:10.1093/bioinformatics/btp616 · Cited by 41,364
featureCounts: an efficient general purpose program for assigning sequence reads to genomic features
Liao, Y., Smyth, G. K., & Shi, W. (2014) · Bioinformatics · doi:10.1093/bioinformatics/btt656 · Cited by 27,219
Tissue-based map of the human proteome
Uhlén, M., Fagerberg, L., Hallström, B. M., Lindskog, C., Oksvold, P., Mardinoglu, A., Sivertsson, Å., Kampf, C., Sjöstedt, E., Asplund, A., et al. (2015) · Science · doi:10.1126/science.1260419 · Cited by 15,286
Highly parallel genome-wide expression profiling of individual cells using nanoliter droplets.
Macosko, E. Z., Basu, A., Satija, R., Nemesh, J., Shekhar, K., Goldman, M., Tirosh, I., Bialas, A. R., Kamitaki, N., Martersteck, E. M., et al. (2015) · Cell · doi:10.1016/j.cell.2015.05.002 · Cited by 7,110
Astrocytes: Biology and pathology
Sofroniew, M. V., & Vinters, H. V. (2010) · Acta Neuropathologica · doi:10.1007/s00401-009-0619-8 · Cited by 5,196
Zhang, Y., Chen, K., Sloan, S. A., Bennett, M. L., Scholze, A. R., O'Keeffe, S., Phatnani, H. P., Guarnieri, P., Caneda, C., Ruderisch, N., et al. (2014) · The Journal of Neuroscience · doi:10.1523/jneurosci.1860-14.2014 · Cited by 4,875
Cahoy, J. D., Emery, B., Kaushal, A., Foo, L. C., Zamanian, J. L., Christopherson, K. S., Xing, Y., Lubischer, J. L., Krieg, P. A., Krupenko, S. A., et al. (2008) · The Journal of Neuroscience · doi:10.1523/jneurosci.4178-07.2008 · Cited by 3,129
Cell types in the mouse cortex and hippocampus revealed by single-cell RNA-seq
Zeisel, A., Muñoz-Manchado, A. B., Codeluppi, S., Lönnerberg, P., La Manno, G., Juréus, A., Marques, S., Munguba, H., He, L., Betsholtz, C., et al. (2015) · Science · doi:10.1126/science.aaa1934 · Cited by 3,124
Cited by
Sorted by citations
Items 201–300 of 492
So, S. W., Nixon, J. P., Bernlohr, D., & Butterick, T. A. (2023) · International Journal of Molecular Sciences · doi:10.3390/ijms24043381 · Cited by 11
“Estimate surrogate cell type proportions variables were calculated with BRETIGEA [138]; input gene-level expression calculated by summing transcript TPMs per gene, and output with mouse species and separate runs with 20, 50, and 200 markers for all six cell types (astrocytes, endothelial cells, microglia, neurons, oli…”
MethodContribution of Glial Cells to Polyglutamine Diseases: Observations from Patients and Mouse Models
Cvetanović, M., & Gray, M. (2023) · Neurotherapeutics · doi:10.1007/s13311-023-01357-5 · Cited by 12
Mwikali, K., Mwangi, S., Pance, A., Ochola‐Oyier, L. I., Kariuki, S. M., Newton, C. R. J. C., Bejon, P., Rayner, J. C., & Abdi, A. I. (2024) · Science Advances · doi:10.1126/sciadv.adl2256 · Cited by 11
“Sub-sequently, we used Fisher’s exact test to analyze the gene overlap be-tween the clusters and reference lists of published cell type–specific markers ( 31 , 32 ).”
Reising, J. P., Phillips, W. S., Ramadan, N., & Herlenius, E. (2022) · Frontiers in Neural Circuits · doi:10.3389/fncir.2022.826497 · Cited by 12
Belonwu, S., Li, Y., Bunis, D. G., Rao, A. A., Solsberg, C. W., Oskotsky, T., Taubes, A. L., Grone, B. P., Zalocusky, K. A., Fragiadakis, G. K., et al. (2022) · Frontiers in Aging Neuroscience · doi:10.3389/fnagi.2022.749991 · Cited by 13
“Briefly, Grubman et al. (2019) used Seurat’s AddModuleScore function to calculate association scores using lists of brain cell type markers of an unspecified number from the BRETIGEA (McKenzie et al., 2018) package.”
MethodLi, M., & Larsen, P. A. (2023) · Alzheimer s & Dementia · doi:10.1002/alz.12979 · Cited by 10
A single-nuclei RNA sequencing study of Mendelian and sporadic AD in the human brain
Del-Aguila, J. L., Li, Z., Dube, U., Mihindukulasuriya, K. A., Budde, J. P., Fernandez, M. V., Ibanez, L., Bradley, J., Wang, F., Bergmann, K., et al. (2019) · doi:10.1101/593756 · Cited by 12
A role for astrocytic miR-129-5p in frontotemporal dementia
Kaurani, L., Pradhan, R., Schröder, S., Burkhardt, S., Schuetz, A.-L., Krüger, D. M., Pena, T., Heutink, P., Sananbenesi, F., & Fischer, A. (2025) · Translational Psychiatry · doi:10.1038/s41398-025-03338-y · Cited by 10
“Gene expression speci fi c to neurons, astrocytes, and microglia was investigated using published single-cell data [30]. miR-129-5p and miR-212-5p expression in human neurons and astrocytes was investigated using published cell type speci fi c data [31].”
Zito, A., & Lee, J. T. (2024) · Proceedings of the National Academy of Sciences · doi:10.1073/pnas.2312757121 · Cited by 12
Fisher, D. W., Dunn, J. T., Keszycki, R. M., Rodríguez, G., Bennett, D. A., Wilson, R. S., & Dong, H. (2024) · Translational Psychiatry · doi:10.1038/s41398-024-02878-z · Cited by 12
Characterization of spinal cord tissue-derived extracellular vesicles in neuroinflammation
Jank, L., Kesharwani, A., Ryu, T., Joshi, D., Ladakis, D. C., Smith, M. D., Singh, S., Arab, T., Witwer, K. W., Calabresi, P. A., et al. (2024) · Journal of Neuroinflammation · doi:10.1186/s12974-024-03147-y · Cited by 10
“Protein grouping was performed with a strict parsi-mony principle to generate the final protein groups [23].”
BackgroundMethodAgeing-related changes in the regulation of microglia and their interaction with neurons
Rommy von Bernhardi, M., & Eugenín, J. L. (2024) · Neuropharmacology · doi:10.1016/j.neuropharm.2024.110241 · Cited by 10
Huang, X., Jannu, A. J., Song, Z., Jury, N., Lasagna‐Reeves, C. A., Initiative, A. D. N., Johnson, T. S., Huang, K., & Zhang, J. (2025) · Alzheimer s & Dementia · doi:10.1002/alz.14241 · Cited by 14
Dai, L., Weiss, R. B., Dunn, D. M., Ramirez, A., Paul, S., & Korenberg, J. R. (2021) · Human Molecular Genetics · doi:10.1093/hmg/ddab041 · Cited by 10
Kimble, A. L., Silva, J., Omar, O. M., Murphy, M. D., Hensel, J. A., Nicholas, S.-A. E., Jellison, E. R., Reese, B., & Murphy, P. A. (2021) · Laboratory Investigation · doi:10.1038/s41374-021-00698-z · Cited by 11
Boot, J. R., Rosser, G., Kancheva, D., Vinel, C., Lim, Y. M., Pomella, N., Zhang, X., Guglielmi, L., Sheer, D., Barnes, M. R., et al. (2022) · eLife · doi:10.7554/elife.77335 · Cited by 10
Deconvolution reveals cell-type-specific transcriptomic changes in the aging mouse brain
Ren, Y., Wang, X., Zhang, S., Hu, H., Quicksall, Z., Lee, S., Morganti, J. M., Johnson, L. A., Asmann, Y. W., & Zhao, N. (2023) · Scientific Reports · doi:10.1038/s41598-023-44183-7 · Cited by 12
“…from each brain cell type from the BRETI-GEA R package, which compared and contrasted five human and mouse cell type-specific transcriptomics data-sets to identify consensus brain cell-type marker genes 9 , (2) brain single cell RNA sequencing expression profiles from the Human Brain Atlas v22.”
MethodMakhlouf, M., de Souza, D. G., Kurian, S. M., Bellaver, B., Ellis, H., Kuboki, A., Al-Naama, A., Hasnah, R., Venturin, G. T., da Costa, J. C., et al. (2023) · Molecular Metabolism · doi:10.1016/j.molmet.2023.101837 · Cited by 11
Robust RNA-Seq of aRNA-amplified single cell material collected by patch clamp
Kim, J. M., Camarena, A., Walker, C., Lin, M. Y., Wolseley, V., Souaiaia, T., Thornton, M. E., Grubbs, B. H., Chow, R. H.-P., Evgrafov, O. V., et al. (2020) · Scientific Reports · doi:10.1038/s41598-020-58715-y · Cited by 10
Models for Monocytic Cells in the Tumor Microenvironment
Lee, S. W. L., Adriani, G., Kamm, R. D., & Gillrie, M. R. (2020) · Advances in experimental medicine and biology · doi:10.1007/978-3-030-35723-8_7 · Cited by 11
Carneiro-Nascimento, S., Powell, W., Uebel, M., Buerge, M., Sigrist, H., Patterson, M., Pryce, C. R., & Opacka‐Juffry, J. (2021) · IBRO Neuroscience Reports · doi:10.1016/j.ibneur.2020.11.001 · Cited by 15
Fisher, D. W., Tulloch, J., Yu, C., & Tsuang, D. W. (2023) · Journal of Alzheimer s Disease Reports · doi:10.3233/adr220114 · Cited by 9
“As differences in the abundances of different cells may bias transcriptomic or methylomic results, we used BRETIGEA [47] to estimate the relative abundance of 6 different cell types—astrocytes, endothelial cells, microglia, neurons, oligodendrocytes, and oligodendrocyte precursor cells—among the 5…”
Temporal Pole Responds to Subtle Changes in Local Thyroid Hormone Signaling
Marcelino, C. P., McAninch, E. A., Fernandes, G. W., Bocco, B. M. L. C., Ribeiro, M. O., & Bianco, A. C. (2020) · Journal of the Endocrine Society · doi:10.1210/jendso/bvaa136 · Cited by 10
A single cell brain atlas in human Alzheimer’s diseasePreprint
Grubman, A., Chew, G., Ouyang, J. F., Sun, G., Choo, X. Y., McLean, C., Simmons, R. K., Buckberry, S., Vargas-Landín, D. B., Pflueger, J., et al. (2019) · bioRxiv (Cold Spring Harbor Laboratory) · doi:10.1101/628347 · Cited by 10
Su, W., Liu, Y., Lam, A. J., Hao, X., Baudry, M., & Bi, X. (2023) · Scientific Reports · doi:10.1038/s41598-023-45769-x · Cited by 9
“Taking advantage of recently reported cell type specific genes 39 , we estimated specific cell type contributions to the DEGs, using genes specific to neurons, astrocytes, microglia, endothelial cells, oligodendrocytes, and oligodendrocyte precursor cells.”
MethodParag, R. R., Yamamoto, T., Saito, K., Zhu, D., Yang, L., & Meir, E. G. V. (2024) · Molecular Neurobiology · doi:10.1007/s12035-024-04293-3 · Cited by 11
“To probe for the Adgrb1 expression profile in different mouse brain cell populations, we queried exon-level usage and transcript-specific expression of Adgrb1 in bulk RNAseq datasets [36, 37].”
Alcohol induces concentration‐dependent transcriptomic changes in oligodendrocytes
Bazzi, S. A., Maguire, C. P., Mayfield, R. D., & Melamed, E. (2025) · Addiction Biology · doi:10.1111/adb.70012 · Cited by 9
“17 For oligodendrocyte cell type subpopulation enrichment, marker genes from Pandey et al, 2022 were used with mean normalized variance stabilized counts of all samples.”
Brain Gene Expression Profiling of Individuals With Dual Diagnosis Who Died by Suicide
Cabrera‐Mendoza, B., Fresno, C., Monroy‐Jaramillo, N., Fries, G. R., Walss‐Bass, C., Glahn, D. C., Ostrosky‐Wegman, P., Mendoza, A. D. G., Martínez‐Magaña, J. J., Romero-Pimentel, A. L., et al. (2019) · Journal of Dual Diagnosis · doi:10.1080/15504263.2019.1692160 · Cited by 9
“In brain tissue of mice (McKenzie et al., 2018) and human patients with psychiatric disorders, it has been suggested that gene expression changes can be attributed to alterations in the relative cell abundance (Ramaker et al., 2017; Toker, Mancarci, Tripathy, & Pavlidis, 2018).”
BackgroundBig data analytics in single‐cell transcriptomics: Five grand opportunities
Bhattacharya, N., Nelson, C. C., Ahuja, G., & Sengupta, D. (2021) · Wiley Interdisciplinary Reviews Data Mining and Knowledge Discovery · doi:10.1002/widm.1414 · Cited by 8
“Clustering enables finding differentially expressed genes between distinct cell lineages and conducting co-expression analysis across the individual clusters (Kharchenko, Silberstein, & Scadden, 2014; McKenzie et al., 2018; van Dam, Võsa, van der Graaf, Franke, & de Magalh ~ aes, 2018).”
BackgroundCell Type-Specific Gene Network-Based Analysis Depicts the Heterogeneity of Autism Spectrum Disorder
Guan, J., Lin, Y., & Ji, G. (2020) · Frontiers in Cellular Neuroscience · doi:10.3389/fncel.2020.00059 · Cited by 9
“Calculation of Cell Type Specificity of Genes To identify cell type-specific genemodules, we first calculated cell type specificity of genes using a method similar to that in the study of (McKenzie et al., 2018), where specificity was defined as the minimum fold change in expression between the cell type of interest a…”
MethodNelson, M. E., Riva, S. G., & Cvejic, A. (2021) · bioRxiv (Cold Spring Harbor Laboratory) · doi:10.1101/2021.04.08.438978 · Cited by 9
“[37] Micro Inpp5d Selectively expressed in brain microglia and has been reported to be associated with late-onset Alzheimer’s disease.”
BackgroundProteomic evidence of depression-associated astrocytic dysfunction in the human male olfactory bulb
Rahimian, R., Perlman, K., Fakhfouri, G., Mpai, R., Richard, V. R., Hercher, C., Penney, L., Davoli, M. A., Nagy, C., Zahedi, R. P., et al. (2024) · Brain Behavior and Immunity · doi:10.1016/j.bbi.2024.08.016 · Cited by 9
HOXD12 defines an age-related aggressive subtype of oligodendroglioma
Nuechterlein, N., Cimino, S., Shelbourn, A., Ha, V., Arora, S., Rajan, S., Shapiro, L. G., Holland, E. C., Aldape, K., McGranahan, T. M., et al. (2024) · Acta Neuropathologica · doi:10.1007/s00401-024-02802-1 · Cited by 9
“17, 18) [48, 53, 75, 81, 84].”
van Hijfte, L., Geurts, M., de Heer, I. J., Ghisai, S. A., Balcioglu, H. E., Hoogstrate, Y., Vallentgoed, W., Head, R., Luning, R., van den Bosch, T. P. P., et al. (2025) · Nature Communications · doi:10.1038/s41467-025-56441-5 · Cited by 8
A Taxonomy of Neuroscientific Strategies Based on Interaction Orders
Neri, M., Brovelli, A., Castro, S., Fraisopi, F., Gatica, M., Herzog, R. A., Mediano, P. A. M., Mindlin, I., Petri, G., Bor, D., et al. (2025) · European Journal of Neuroscience · doi:10.1111/ejn.16676 · Cited by 11
Neocortical tau propagation is a mediator of clinical heterogeneity in Alzheimer’s disease
Chongtham, A., Ramakrishnan, A., Farinas, M., Broekaart, D. W. M., Seo, J. H., Zhu, C. W., Sano, M., Shen, L., & Pereira, A. C. (2025) · Molecular Psychiatry · doi:10.1038/s41380-025-02998-y · Cited by 10
Faura, J., Heeman, B., Pottier, C. P., Baker, M., DeJesus‐Hernandez, M., Küçükali, F., Heiß, L., Wynants, S., den Broeck, M. V., Rijk, P. D., et al. (2025) · Acta Neuropathologica · doi:10.1007/s00401-025-02901-7 · Cited by 9
“Then, cell proportions were calculated with the R package DSA [81] using specific cell markers for each cell type from the R package BRETIGEA [45], as we described before [59].”
Genetic foundations of interindividual neurophysiological variability
Castanheira, J. D. S., Poli, J., Hansen, J. Y., Mišić, B., & Baillet, S. (2025) · Science Advances · doi:10.1126/sciadv.ads7544 · Cited by 8
“To determine the types of cells corresponding to these genes, we analyzed gene sets that are preferentially expressed in seven cell types as determined by RNA sequencing studies ( 37 – 42 ).”
Jank, L., Kumar, M. K. S., Ryu, T., Thapa, R., Gololobova, O. A., Niepokny, T. D., Calabresi, P. A., Witwer, K. W., Dutta, R., Na, C. H., et al. (2025) · Journal of Extracellular Vesicles · doi:10.1002/jev2.70197 · Cited by 8
“To determine if the cells contributing to the EV pool change in MS, we carried out CNS cell deconvolution analyses on the EV proteomics data using CIBERSORTx (Newman et al. 2019; Sutton et al. 2022; Zhang et al. 2016) and BRETIGEA (McKenzie et al. 2018).”
InfluentialDetailed Analysis of Dorsal-Ventral Gradients of Gene Expression in the Hippocampus of Adult Rats
Beletskiy, A., Positselskaya, E., Vinarskaya, A. K., Spivak, Y. S., Dobryakova, Y. V., Tyulenev, I., Markevich, V. A., & Bolshakov, A. P. (2022) · International Journal of Molecular Sciences · doi:10.3390/ijms23179948 · Cited by 8
“Heatmap showing DE genes, present in lists of top 30 most expressed cell-type-specific genes from [19].”
BackgroundMethodInfluentialNarendra, S., Klengel, C., Hamzeh, B., Patel, D., Otten, J., Lardenoije, R., Newman, E. L., Miczek, K. A., Klengel, T., Ressler, K. J., et al. (2022) · Translational Psychiatry · doi:10.1038/s41398-022-02231-2 · Cited by 8
“Furthermore, since differences in cell type proportions can be a major source of variation in gene expression profiles, we used a computational cell type deconvolution tool, BRETIGEA [35] to estimate the abundances of six relevant cell types, including neurons, astrocytes, microglia, oligodendrocyte precursor cells (O…”
MethodOcañas, S. R., Pham, K. D., Blankenship, H. E., Machalinski, A. H., Chucair‐Elliott, A. J., & Freeman, W. M. (2021) · bioRxiv (Cold Spring Harbor Laboratory) · doi:10.1101/2021.07.15.452509 · Cited by 8
“We first examined enrichment/depletion of previously published microglial, astrocytic, oligodendrocytic, neuronal, and endothelial markers in the transcriptomic profiles (Chucair-Elliott et al., 2020; McKenzie et al., 2018) (Supplemental Table 1).”
MethodLam, I., Ndayisaba, A., Lewis, A. J., Fu, Y., Sagredo, G. T., Zaccagnini, L., Sandoe, J., Sanz, R. L., Vahdatshoar, A., Martin, T. D., et al. (2022) · bioRxiv (Cold Spring Harbor Laboratory) · doi:10.1101/2022.11.08.515615 · Cited by 8
Grubman, A., Choo, X. Y., Chew, G., Ouyang, J. F., Sun, G., Croft, N. P., Rossello, F. J., Simmons, R., Buckberry, S., Landin, D. V., et al. (2019) · doi:10.1101/639054 · Cited by 7
Philtjens, S., Turnbull, M. T., Thedy, B. P., Moon, Y., & Kim, J. (2020) · doi:10.1101/2020.04.27.064881 · Cited by 7
Surana, P., Dutta, P., & Davuluri, R. V. (2024) · Bioinformatics · doi:10.1093/bioinformatics/btae475 · Cited by 7
“This highlights the crucial roles of both neuronal and nonneuronal cells, including astrocytes and oligodendrocytes, in maintaining brain functions and protective barriers (McKenzie et al. 2018, Jurga et al. 2021).”
BackgroundSplicing dysregulation in glioblastoma alters the function of cell migration‐related genes
Seong, M., Bak‐Gordon, P., Liu, Z., Canoll, P., & Manley, J. L. (2024) · Glia · doi:10.1002/glia.24630 · Cited by 8
“To this end, the top 1000 genes predominantly expressed in NB, NHAs and GBM, identified as described by McKenzie et al. (2018) using the above DESeq2 results (Figure 3a), were compared with brain subtype-specific genes (McKenzie et al., 2018; Zhang et al., 2014; Zhang et al., 2016).”
The lncRNA Gas5 is an activity-responsive scaffold that mediates cAMP-dependent synaptic plasticity
Chanda, K., Grinman, E., Clark, K., Sadhu, A., Raveendra, B., Swarnkar, S., & Puthanveettil, S. V. (2025) · Science Signaling · doi:10.1126/scisignal.adn2044 · Cited by 8
Costa, A. L., Doncevic, D., Wu, Y., Yang, L., Man, K.-H., Spreng, A.-S., Winter, H., Fletcher, M., Radlwimmer, B., & Herrmann, C. (2025) · Genome Biology · doi:10.1186/s13059-025-03670-y · Cited by 7
“RTK2-CIMP and IDH-CIMP targets were compared with two sets of brain markers [61, 62].”
Farahani, A., Liu, Z.-Q., Ceballos, E. G., Hansen, J. Y., Wennberg, K., Zeighami, Y., Dadar, M., Gauthier, C. J., Dagher, A., & Mišić, B. (2025) · PLoS Biology · doi:10.1371/journal.pbio.3003277 · Cited by 13
Naqvi, A. S., Sullivan, P. J., Corbett, R. J., Sehgal, P. D., Conkrite, K. L., Rathi, K. S., Ennis, B., Hayer, K. E., Zhang, B., Brown, M., et al. (2026) · Neuro-Oncology Pediatrics · doi:10.1093/neuped/wuag009 · Cited by 7
“This cluster was predominantly comprised of HGGs, representing 75% of the group ( Figure 2C) , along with a mix of additional histologies.”
Self-citationA Standardized Brain Molecular Atlas: A Resource for Systems Modeling and Simulation
Shichkova, P., Coggan, J. S., Markram, H., & Keller, D. X. (2021) · Frontiers in Molecular Neuroscience · doi:10.3389/fnmol.2021.604559 · Cited by 7
Carvalho, D. B., Díaz‐Amarilla, P., Dapueto, R., Santi, M. D., Duarte, P., Savio, E., Engler, H., Abin‐Carriquiry, J. A., & Arredondo, F. (2023) · Journal of Molecular Neuroscience · doi:10.1007/s12031-023-02105-2 · Cited by 7
“Tpd52l1 is associated with calcium signaling and cell cycle and Fzd2 is a Wnt receptor found selectively and highly expressed in mouse astrocytes (Boutros and Byrne 2005; Cahoy et al. 2008; McKenzie et al. 2018).”
BackgroundJeong, M., Choi, J., Jang, H., Sohn, D. H., Wang, Q., Lee, J., Li, Y., Lee, E. J., Fan, J., Pratelli, M., et al. (2023) · Neuron · doi:10.1016/j.neuron.2023.09.038 · Cited by 7
Specificity and efficiency of tamoxifen-mediated Cre induction is equivalent regardless of age
Kellogg, C. M., Pham, K. D., Ko, S.-H., Cox, J. E. J., Machalinski, A. H., Stout, M. B., Sharpe, A. L., Beckstead, M. J., Chucair‐Elliott, A. J., Ocañas, S. R., et al. (2023) · iScience · doi:10.1016/j.isci.2023.108413 · Cited by 10
“Assessment of cell marker lists developed by the field 45 showed equivalent enrichments of microglial markers in young and old mice, and from different induction ages.”
BackgroundMorphine-Driven m6A Epitranscriptomic Neuroadaptations in Primary Cortical Cultures
Dabrowski, K. R., & Daws, S. E. (2024) · Molecular Neurobiology · doi:10.1007/s12035-024-04219-z · Cited by 7
“…markers from a tool called BRETIGEA that seeks to perform “deconvolution” of gene expression datasets involving bulk-tissue samples, we calculated the average expression value for all samples of cortical cultures for genes known to be enriched in astrocytes, microglia, or neurons [39].”
Bartas, K., Nguyen, M. H., Zhao, W., Hui, M., Nie, Q., & Beier, K. T. (2025) · Scientific Reports · doi:10.1038/s41598-025-10795-4 · Cited by 15
Cocaine Administration and Its Abstinence Conditions Modulate Neuroglia
Gawlińska, K., Frankowska, M., Gawliński, D., Piechota, M., Korostyński, M., & Filip, M. (2020) · International Journal of Molecular Sciences · doi:10.3390/ijms21217970 · Cited by 7
“The top 20 cell-type-specific markers for astrocytes, oligodendrocytes, and microglia were identified on the basis of literature and analyzed [14].”
BackgroundKumar, K., Dixit, A. B., Tripathi, M., Dubey, V., Siraj, F., Sharma, M. C., Lalwani, S., Chandra, P. S., & Banerjee, J. (2022) · Functional & Integrative Genomics · doi:10.1007/s10142-022-00869-1 · Cited by 7
“types with distinct gene expression (McKenzie et al. 2018).”
Ayoub, C. A., Wagner, C. S., & Kuret, J. (2023) · PLoS Genetics · doi:10.1371/journal.pgen.1010681 · Cited by 8
Single-Cell Analysis of Sex and Gender Differences in the Human Brain During Development and Disease
Zelco, A., & Joshi, A. (2025) · Cellular and Molecular Neurobiology · doi:10.1007/s10571-025-01536-2 · Cited by 9
“We evaluated the cell type specificity of the SG-biased genes in each sex and dataset, using a reference (McKenzie et al. 2018).”
Yang, Q., Guo, Y., Jiao, H., & Shang, X. (2020) · BMC Bioinformatics · doi:10.1186/s12859-020-03547-w · Cited by 7
The architecture of brain co-expression reveals the brain-wide basis of disease susceptibilityPreprint
Hartl, C., Ramaswami, G., Pembroke, W. G., Muller, S., Pintacuda, G., Saha, A., Parsana, P., Battle, A. J., Lage, K., & Geschwind, D. H. (2020) · bioRxiv (Cold Spring Harbor Laboratory) · doi:10.1101/2020.03.05.965749 · Cited by 7
Molecular signatures of cognition and affectPreprint
Hansen, J. Y., Markello, R. D., Vogel, J. W., Seidlitz, J., Bzdok, D., & Mišić, B. (2020) · bioRxiv (Cold Spring Harbor Laboratory) · doi:10.1101/2020.07.16.203026 · Cited by 7
“[55] McKenzie, A.”
MethodWang, J., Roeder, K., & Devlin, B. (2020) · bioRxiv (Cold Spring Harbor Laboratory) · doi:10.1101/2020.08.05.238949 · Cited by 7
“Results are provided for the top 1000 marker genes, per cell type, identified by BRETIGEA (McKenzie et al., 2018). b,c) Using realistic simulations, correlation between truth and estimated CTS expression are computed to compare TCA (Rahmani et al., 2019) with bMIND and bMIND rp (using a rough prior).”
BackgroundMethodInfluentialKabiljo, R., Marriott, H., Hunt, G. P., Pfaff, A. L., Khleifat, A. A., Adey, B. N., Jones, A., Troakes, C., Quinn, J. P., Dobson, R., et al. (2023) · medRxiv · doi:10.1101/2023.05.05.23289551 · Cited by 7
Oatman, S. R., Reddy, J. S., Atashgaran, A., Wang, X., Min, Y., Quicksall, Z., Vanelderen, F., Carrasquillo, M. M., Liu, C.-C., Yamazaki, Y., et al. (2026) · Nature Communications · doi:10.1038/s41467-026-68864-9 · Cited by 6
“The top 100 genes from BRETIGEA 65 were used as the cell type speci fi c marker genes for these estimations.”
InfluentialDiener, C., Thüre, K., Engel, A., Hart, M., Keller, A., Meese, E. U., & Fischer, U. (2024) · European Journal of Cell Biology · doi:10.1016/j.ejcb.2024.151458 · Cited by 6
Molecular basis of neurodegeneration in a mouse model of Polr3-related disease
Moir, R. D., Merheb, E., Chiţu, V., Stanley, E. R., & Willis, I. M. (2024) · eLife · doi:10.7554/elife.95314.3 · Cited by 7
Li, L., Guo, Y., Zhang, X., Du, Z., Wang, Y., Yang, Z., Luo, Q.-W., Zhuo, F., Wei, T., Liu, Z., et al. (2025) · Advanced Science · doi:10.1002/advs.202514703 · Cited by 6
Lamoureux, L., Sajesh, B. V., Slota, J. A., Medina, S. J., Mayor, M., Frost, K. L., Warner, B. M., Manguiat, K., Wood, H., Kobasa, D., et al. (2022) · Viruses · doi:10.3390/v14061218 · Cited by 6
“Differentially expressed genes were annotated based on a list of known cell-typeenriched transcripts [33].”
BackgroundDecoding the role of transcriptomic clocks in the human prefrontal cortex
Martínez‐Magaña, J. J., Vlot, A. H. C., Sullivan, K. A., Jacobson, D. A., Krystal, J. H., Girgenti, M. J., Núñez-Ríos, D. L., Nagamatsu, S. T., Andrade-Brito, D., Merlet, J., et al. (2026) · iScience · doi:10.1016/j.isci.2026.116439 · Cited by 6
Adaptive alien genes are maintained amid a vanishing introgression footprint in a sea squirt
Touchard, F., Cerqueira, F., Bierne, N., & Viard, F. (2024) · Evolution Letters · doi:10.1093/evlett/qrae016 · Cited by 6
Knocking Out TAAR5: A Pathway to Enhanced Neurogenesis and Dopamine Signaling in the Striatum
Vaganova, A. N., Fesenko, Z. S., Efimova, E. V., Chekrygin, S. A., Shafranskaya, D. D., Prjibelski, A. D., Katolikova, N. V., & Gainetdinov, R. R. (2024) · Cells · doi:10.3390/cells13221910 · Cited by 8
“Notably [51], ten of these hub genes (except Bltp11 and Mprip) are overrepresented in adult neurons in line with the BRETIGEA (BRain cEll Type specIfic Gene Expression Analysis) gene signatures [52].”
Najafi, H., Naseri, M., Zahiri, J., Totonchi, M., & Sadeghizadeh, M. (2019) · ASN NEURO · doi:10.1177/1759091419854627 · Cited by 6
“…expression pattern of some selected genes which previously reported as specific markers of different cell types of central nervous system (such as Astrocytes, Oligodendrocytes, microglia, neurons and neural stem/progenitor cells) (Cahoy et al., 2008; Artegiani et al., 2017; McKenzie et al., 2018).”
BackgroundSong, X., Jiang, J., Tian, W., Zhan, F., Zhu, Z., Li, B., Tang, H., & Cao, L. H. (2021) · Molecular Medicine Reports · doi:10.3892/mmr.2021.12211 · Cited by 6
“neurons, oligodendrocytes, oligodendrocyte precursor cells, astrocytes and endothelial cells was obtained from the study of McKenzie et al (27) (Table SII).”
MethodInfluentialGene Co-Expression Network Modular Analysis Reveals Altered Immune Mechanisms in HIV-HAND
Petralia, M. C., Nicoletti, F., Tancheva, L. P., Kalfin, R. E., Fagone, P., & Mangano, K. (2022) · Brain Sciences · doi:10.3390/brainsci12101378 · Cited by 6
Pak, V., Adewale, Q., Bzdok, D., Dadar, M., Zeighami, Y., & Iturria‐Medina, Y. (2023) · eLife · doi:10.7554/elife.89368 · Cited by 21
Molecular Networks and Key Regulators of the Dysregulated Neuronal System in Alzheimer’s Disease
Wang, M., Li, A., Sekiya, M., Beckmann, N. D., Quan, X., Schrode, N., Fernando, M. B., Yu, A., Zhu, L., Cao, J., et al. (2019) · doi:10.1101/788323 · Cited by 6
Self-citationNoguchi, J., Watanabe, S., Oga, T., Isoda, R., Nakagaki, K., Sakai, K., Sumida, K., Hoshino, K., Saito, K., Miyawaki, I., et al. (2024) · Communications Biology · doi:10.1038/s42003-024-06345-9 · Cited by 5
Machine learning reveals novel targets for both glioblastoma and osteosarcoma
Li, N., Ward, M., Bashir, M., Cao, Y., Datta, A., Li, Z., & Zhang, S. (2025) · Heliyon · doi:10.1016/j.heliyon.2025.e42997 · Cited by 5
Martínez-Rivera, F. J., Holt, L. M., Minier-Toribio, A. M., Estill, M. S., Yeh, S.-Y., Tofani, S., Futamura, R., Browne, C. J., Mews, P., Shen, L., et al. (2025) · Nature Communications · doi:10.1038/s41467-025-58151-4 · Cited by 7
“For cell-type enrichment, DEG lists were integrated with a single-cell RNA-seq database 89 , which classi fi es genes enriched in astrocytes, endothelial cells, microglia, neurons, oligodendrocytes, or oligodendrocyte precursor cells.”
InfluentialPan-neurodegeneration proteomics reveals disease subtypes and molecular signatures
Shrestha, H. K., Sun, H., Yarbro, J. M., Lee, D., Liu, D., Wang, E., McReynolds, M. G., Zhang, N., Xie, B., Yang, S., et al. (2026) · Cell · doi:10.1016/j.cell.2026.02.026 · Cited by 11
Self-citationDopamine drives persistent remodelling of the maternal brain
O’Chan, J. C., Salvo, G. D., Cunningham, A. M., Dutta, S., Brindley, E., Weekley, B. H., Chen, W., Iyer, R. R., Wan, E., Zhang, C., et al. (2026) · Nature · doi:10.1038/s41586-026-10509-4 · Cited by 7
“0.4) 79 with default markers.”
InfluentialRadulescu, E., Chen, Q., Pergola, G., Eagles, N. J., Stolz, J. M., Shin, J. H., Hyde, T. M., Kleinman, J. E., & Weinberger, D. R. (2023) · PLoS Genetics · doi:10.1371/journal.pgen.1010989 · Cited by 6
“Notably, gene expression and especially co-expression networks are sensitive to effects of demographic and biological factors like age, sex [17–18], cell composition [19–20], treatment [21] and technical artifacts (e.g., tissue degradation) [22].”
BackgroundAranda, S., Muntané, G., & Vilella, E. (2024) · Translational Psychiatry · doi:10.1038/s41398-024-02823-0 · Cited by 5
“0.3 [29].”
MethodInfluentialKim, I. B., Kim, M.-H., Jung, S., Kim, W. K., Lee, J., Ju, Y. S., Webster, M. J., Kim, J. H., Kim, J., Kim, H. J., et al. (2024) · Experimental & Molecular Medicine · doi:10.1038/s12276-024-01284-1 · Cited by 5
Miedema, S. S. M., Rajicic, A., Mol, M. O., Paliukhovich, I., Klaassen, R. V., van Buuren, R., Li, K. W., Koopmans, F., Seelaar, H., van Rooij, J., et al. (2025) · Acta Neuropathologica Communications · doi:10.1186/s40478-025-02077-x · Cited by 5
“Cell type enrichment analysis can help to stratify data from mixed cell populations, without the need for physical cell sorting [2, 31].”
Li, P., Wei, J., & Zhu, Y. (2023) · Briefings in Bioinformatics · doi:10.1093/bib/bbad417 · Cited by 5
“Deconvolution of cell type-specific signatures To assess the ability of CellGO to accurately identify cell type-specific pathways, we assembled a query gene set consisting of the top 50 marker genes for each cell type from an independent study (79) (Supplementary Table S2).”
Early life phenobarbital exposure dysregulates the hippocampal transcriptome
Quinlan, S., Khan, T., McFall, D. J., Campos-Rodríguez, C., & Forcelli, P. A. (2024) · Frontiers in Pharmacology · doi:10.3389/fphar.2024.1340691 · Cited by 6
A Mouse Model of Sporadic Alzheimer’s Disease with Elements of Major Depression
Бобкова, Н. В., Chuvakova, L. N., Kovalev, V. I., Zhdanova, D. Y., Chaplygina, A. V., Rezvykh, A. P., & Evgen’ev, M. B. (2024) · Molecular Neurobiology · doi:10.1007/s12035-024-04346-7 · Cited by 5
“A Cell-specific profiling of differentially expressed genes in the OBX mice: Each gene was assigned to one of 6 major cell types abundant in the CNS [93]: Astrocyte, Endotheliocyte, Microglia, Neuron, oligodendrocyte, and OPC (X-axis).”
Tayran, H., Yılmaz, E., Bhattarai, P., Min, Y., Wang, X., Ma, Y., Nelson, N. N., Kassara, N., Coşacak, M. İ., Dogru, R. M., et al. (2024) · Alzheimer s & Dementia · doi:10.1002/alz.089273 · Cited by 6
TREM2 R47H exacerbates immune response in Alzheimer’s disease brainPreprint
Korvatska, O., Kiianitsa, K., Ratushny, A., Matsushita, M., Beeman, N., Chien, W.-M., Satoh, J.-I., Dorschner, M., Keene, C., Bammler, T., et al. (2018) · bioRxiv · doi:10.1101/499319 · Cited by 4
Single Nuclei Transcriptome Reveals Perturbed Brain Vascular Molecules in Alzheimer’s DiseasePreprint
İş, Ö., Wang, X., Patel, T., Quicksall, Z., Heckman, M. G., White, L. J., Lewis‐Tuffin, L. J., Deniz, K., Tutor‐New, F. Q., Carnwath, T., et al. (2021) · bioRxiv (Cold Spring Harbor Laboratory) · doi:10.1101/2021.12.28.474255 · Cited by 5
Cell type heterogeneity in gene co-expression networks: implications for toxicological research
Bruns, I. B., Li, Y., Stevens, J. L., van de Water, B., & Callegaro, G. (2025) · Briefings in Bioinformatics · doi:10.1093/bib/bbaf421 · Cited by 5
“For example, McKenzie et al. conducted a gene co-expression analysis on single-cell data from both human and mouse brains, a nd identified co-expression networks enriched with cell type–specific markers [79].”
Protein fingerprints of brain-derived extracellular vesicles predict types of tau pathology
Espourteille, J., Barve, A., Zufferey, V., Leroux, É., Perbet, R., Bégard, S., Caillierez, R., Maurage, C., Toni, N., Buée, L., et al. (2025) · Alzheimer's Research & Therapy · doi:10.1186/s13195-025-01865-w · Cited by 4
“After annotation, according to the McKenzie et al. database, glial abundance was determined by summing the abundance of astrocytic, oligo-dendrocytic, and microglial material [26].”
InfluentialPrimate gut microbiota induce evolutionarily salient changes in mouse neurodevelopment
DeCasien, A. R., Aronoff, J. E., Mallott, E. K., Kuthyar, S., Chitta, S., Layden, B. T., Sardaro, M. L. S., Gray, S. B., Williams, L. E., Liechty, E. R., et al. (2026) · Proceedings of the National Academy of Sciences · doi:10.1073/pnas.2426232122 · Cited by 4
Digby, Z., Diamond, C., Wescott, H., Smolak, P. J., Thornton, P., Lindsay, N. A., Gabel, C. A., Clarke, N. P., & Watt, A. P. (2026) · ACS Chemical Neuroscience · doi:10.1021/acschemneuro.5c00843 · Cited by 4
DRLM: A Robust Drug Representation Learning Method and its Applications
Fu, H., Zhao, C., Niu, X., & Zhang, W. (2022) · IEEE Transactions on Computational Biology and Bioinformatics · doi:10.1109/tcbb.2022.3213979 · Cited by 4
“Signifi-cantly, the differences of gene expression profiles across multiple cell types, which is called cell specificity [21], and technical noise increase computational challenges for researchers to learn robust drug representations.”
BackgroundPreziosa, P., Storelli, L., Tedone, N., Margoni, M., Mistri, D., Azzimonti, M., Filippi, M., & Rocca, M. A. (2024) · Molecular Psychiatry · doi:10.1038/s41380-024-02452-5 · Cited by 4
Metadata
- Authors
- McKenzie, A. T., Wang, M., Hauberg, M. E., Fullard, J. F., Kozlenkov, A., Keenan, A., Hurd, Y. L., Dracheva, S., Casaccia, P., Roussos, P., & Zhang, B.
- Affiliations
- Icahn School of Medicine at Mount Sinai (US)
- Aarhus University (DK)
- James J. Peters VA Medical Center (US)
- City University of New York (US)
- Corresponding author
- Zhang, Bin
- ORCID
- Venue
- Scientific Reports
- Published
- 2018-06-11
- Volume
- 8
- Issue
- 1
- Pages
- 8868-8868
- ISSN
- 2045-2322 (ISSN-L)
- PMC
- PMC5995803
- OpenAlex
- W2806989085
- Cited by
- 481
- References
- 59
- Citations by year
- 2026: 41 · 2025: 59 · 2024: 84 · 2023: 70 · 2022: 60 · 2021: 78 · 2020: 56 · 2019: 28 · 2018: 5
- FWCI
- 15.03
- Type
- journal article
- Language
- en
- Update notices
- correction (2021-09-24)
- Open access
- gold
- doi.org
- Locations
- Scientific Reports (publishedVersion, cc-by)
- Europe PMC (PubMed Central) (publishedVersion, cc-by)
- PubMed Central (publishedVersion, cc-by)
- PubMed (publishedVersion)
- DOAJ (DOAJ: Directory of Open Access Journals) (submittedVersion, cc-by-sa)
- Scopus (Elsevier) (submittedVersion)
- Funders
- U.S. Department of Veterans Affairs (I01 BX002876, I01BX002395, I01 BX003625)
- Lundbeckfonden (R155-2014-1724, R248‐2017‐2003)
- National Institutes of Health
- National Institute on Aging (R01AG057907, F30AG052261, R01AG046170, U01AG046170, RF1AG054014, RF1AG057440, U01AG052411, R01AG050986)
- National Institute of Mental Health (R01MH109677)
- National Institute on Drug Abuse (P01DA008227)
- National Institute of Neurological Disorders and Stroke (R37NS042925, R01NS052738)
- Topics
- Life Sciences › Biochemistry, Genetics and Molecular Biology › Molecular Biology › Single-cell and spatial transcriptomics
- Life Sciences › Biochemistry, Genetics and Molecular Biology › Molecular Biology › Gene expression and cancer classification
- Life Sciences › Biochemistry, Genetics and Molecular Biology › Molecular Biology › Bioinformatics and Genomic Networks
- Keywords
- cell type markers, co-expression network, single-cell transcriptomics, cell type deconvolution, cell type signatures, intercellular communication, postmortem brain
- MeSH terms
- Animals, Female, Genetic Markers, Humans, Male, Mice, Inbred C57BL, Neuroglia, Neurons, Temporal Lobe, Gene Expression Profiling, Databases, Nucleic Acid, Endothelial Cells, Mice, Gene Regulatory Networks, Single-Cell Analysis, Transcriptome, Datasets as Topic
About these checks
Registry, retraction, Cites and statistics results are computed, not judged, with one exception: a printed reference that no index lists is read once by a model before it counts as a citation error. Claims are extracted by a model and kept only when their quote appears verbatim in the text; each cited source is then checked, with a model’s help, for whether it says what the claim relies on. Those verdicts can be wrong — read the claim’s quote and the cited source before relying on one.
Statistics and arithmetic are recomputed, not judged.
Confidence bands are shown only for fields calibrated on our annotated test set. None is calibrated yet, so no band is shown.
What counts as a claim ›How we measure confidence ›How we check this ›
Are you an author, or do you see a problem with this page? Request a review
