

The DOI matches its Crossref record; 5 of the 5 references it cites were found in a registry or an index.
The 14q32 maternally imprinted locus is a major source of longitudinally stable circulating microRNAs as measured by small RNA sequencing
Abstract
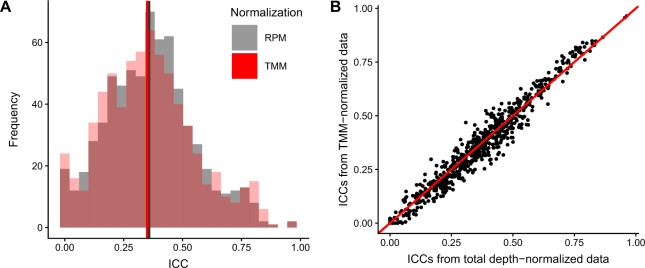
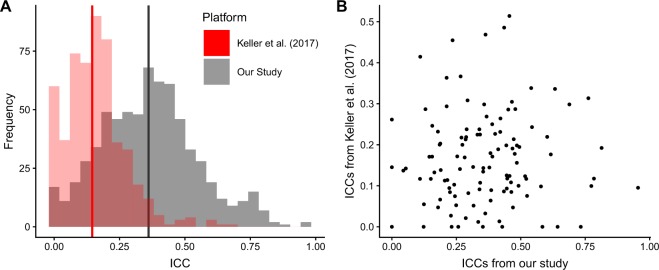
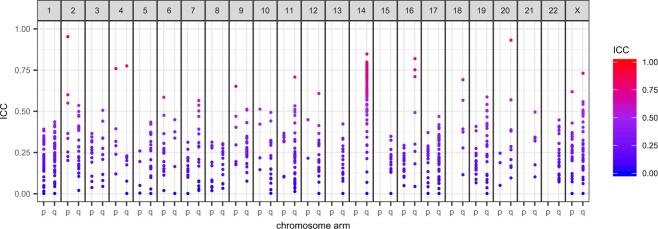
Understanding the normal temporal variation of serum molecules is a critical factor for identifying useful candidate biomarkers for the diagnosis and prognosis of chronic disease. Using small RNA sequencing in a longitudinal study of 66 women with no history of cancer, we determined the distribution and dynamics (via intraclass correlation coefficients, ICCs) of the miRNA profile over 3 time points sampled across 2–5 years in the course of the screening trial, UKCTOCS. We were able to define a subset of longitudinally stable miRNAs (ICC >0.75) that were individually discriminating of women who had no cancer over the study period. These miRNAs were dominated by those originating from the C14MC cluster that is subject to maternal imprinting. This assessment was not significantly affected by common confounders such as age, BMI or time to centrifugation nor alternative methods to data normalisation. Our analysis provides important benchmark data supporting the development of miRNA biomarkers for the impact of life-course exposure as well as diagnosis and prognostication of chronic disease.
Overview
The claims and statistics of this paper haven’t been checked yet.
Run the check — free, no account needed. It reads the open-access text and checks the sources it cites.
Integrity signals
Registry
Cites
Statistics
Figures
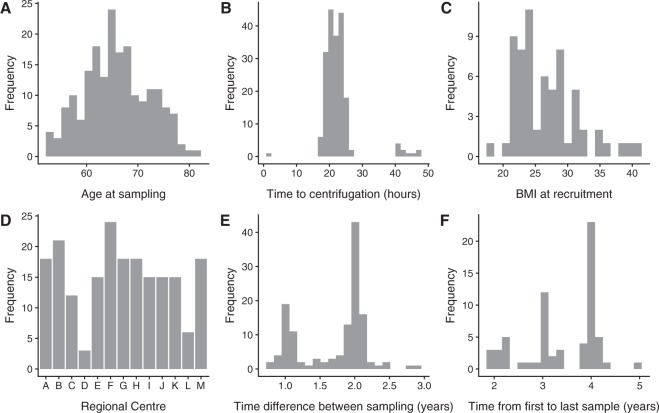
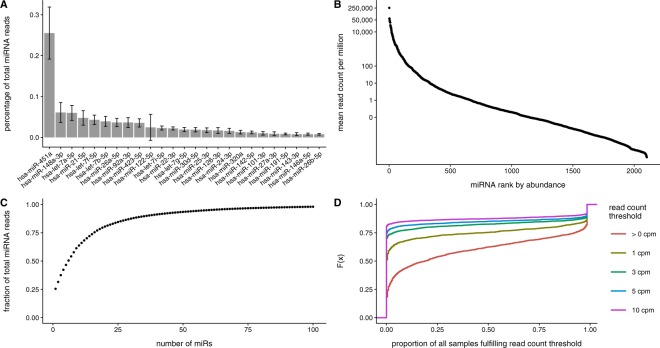
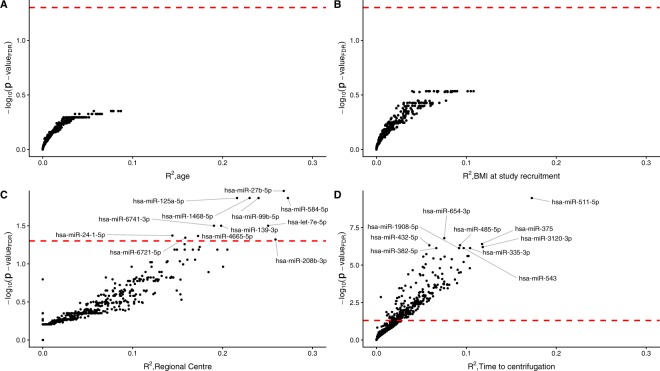
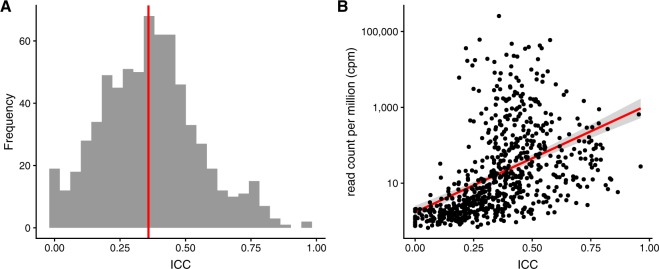
Verification
Claims the paper makes
The claims and statistics of this paper haven’t been checked yet.
Run the check — free, no account needed. It reads the open-access text and checks the sources it cites.
Claims other papers make about this one
Each is checked against this paper’s own text: does it say what the citing paper says it does?
In the citing paper
“More recently, miRNAs of this cluster were found to be among the most longitudinally stable miRNAs, indicating that they are ideal biomarkers to monitor the progression pathophysiological states including PD, reiterating the importance of the current findings. 45”
From Validation of differentially expressed brain‐enriched microRNAs in the plasma of PD patients (2020) · cites this paper as [45]
Self-check
Percentages, sums and reported differences re-computed from the paper’s own numbers.
The self-check needs the paper’s full text.
Citations
Cites
A guideline of selecting and reporting intraclass correlation coefficients for reliability research
Koo, T. K., & Li, M. Y. (2016) · Journal of Chiropractic Medicine · doi:10.1016/j.jcm.2016.02.012 · Cited by 31,709
A Mammalian microRNA Expression Atlas Based on Small RNA Library Sequencing
Landgraf, P., Rusu, M., Sheridan, R., Sewer, A., Iovino, N., Aravin, A., Pfeffer, S., Rice, A., Kamphorst, A. O., Landthaler, M., et al. (2007) · Cell · doi:10.1016/j.cell.2007.04.040 · Cited by 3,626
Distribution of miRNA expression across human tissues
Ludwig, N., Leidinger, P., Becker, K., Backes, C., Fehlmann, T., Pallasch, C., Rheinheimer, S., Meder, B., Stähler, C., Meese, E., et al. (2016) · Nucleic Acids Research · doi:10.1093/nar/gkw116 · Cited by 968
Blood Cell Origin of Circulating MicroRNAs: A Cautionary Note for Cancer Biomarker Studies
Pritchard, C. C., Kroh, E., Wood, B., Arroyo, J. D., Dougherty, K. J., Miyaji, M. M., Tait, J. F., & Tewari, M. (2012) · Cancer Prevention Research · doi:10.1158/1940-6207.capr-11-0370 · Cited by 879
Recruitment to multicentre trials—lessons from UKCTOCS: descriptive study
Menon, U., Gentry-Maharaj, A., Ryan, A., Sharma, A., Burnell, M., Hallett, R., Lewis, S., Lopez, A., Godfrey, K., Oram, D., et al. (2008) · BMJ · doi:10.1136/bmj.a2079 · Cited by 151
Self-citation
Research works printed but not linked: 54
- Bartel, D. P. MicroRNAs: target recognition and regulatory functions. Cell 136(2), 215–33 (2009). · DOI · Paper page
- Baek, D. et al. The impact of microRNAs on protein output. Nature 455(7209), 64–71 (2008). · DOI · Paper page
- Carleton, M., Cleary, M. A. & Linsley, P. S. MicroRNAs and cell cycle regulation. Cell Cycle 6(17), 2127–32 (2007). · DOI
- Jovanovic, M. & Hengartner, M. O. miRNAs and apoptosis: RNAs to die for. Oncogene 25(46), 6176–87 (2006). · DOI
- Koufaris, C. et al. Systematic integration of molecular profiles identifies miR-22 as a regulator of lipid and folate metabolism in breast cancer cells. Oncogene 35(21), 2766–76 (2016). · DOI
- Stefani, G. & Slack, F. J. Small non-coding RNAs in animal development. Nat Rev Mol Cell Biol 9(3), 219–30 (2008). · DOI
- Mouradian, M. M. MicroRNAs in Parkinson’s disease. Neurobiol Dis 46(2), 279–84 (2012). · DOI
- Condorelli, G., Latronico, M. V. & Cavarretta, E. microRNAs in cardiovascular diseases: current knowledge and the road ahead. J Am Coll Cardiol 63(21), 2177–87 (2014). · DOI
- Lu, J. et al. MicroRNA expression profiles classify human cancers. Nature 435(7043), 834–8 (2005). · DOI
- Rosenfeld, N. et al. MicroRNAs accurately identify cancer tissue origin. Nat Biotechnol 26(4), 462–9 (2008). · DOI · Paper page
- Mitchell, P. S. et al. Circulating microRNAs as stable blood-based markers for cancer detection. Proc Natl Acad Sci USA 105(30), 10513–8 (2008). · DOI · Paper page
- Bianchi, F. et al. A serum circulating miRNA diagnostic test to identify asymptomatic high-risk individuals with early stage lung cancer. EMBO Mol Med 3(8), 495–503 (2011). · DOI
- Redell, J. B. et al. Human traumatic brain injury alters plasma microRNA levels. J Neurotrauma 27(12), 2147–56 (2010). · DOI
- de Candia, P. et al. A unique plasma microRNA profile defines type 2 diabetes progression. PLoS One 12(12), e0188980 (2017). · DOI · Paper page
- He, Y. et al. Current State of Circulating MicroRNAs as Cancer Biomarkers. Clin Chem 61(9), 1138–55 (2015). · DOI
- Pogribny, I. P. MicroRNAs as biomarkers for clinical studies. Exp Biol Med (Maywood) 243(3), 283–290 (2018). · DOI
- Jarry, J. et al. The validity of circulating microRNAs in oncology: five years of challenges and contradictions. Mol Oncol 8(4), 819–29 (2014). · DOI
- Tiberio, P. et al. Challenges in using circulating miRNAs as cancer biomarkers. Biomed Res Int 2015, 731479 (2015). · DOI
- Murray, M. J., Huddart, R. A. & Coleman, N. The present and future of serum diagnostic tests for testicular germ cell tumours. Nat Rev Urol 13(12), 715–725 (2016). · DOI
- Terbuch, A. et al. MiR-371a-3p Serum Levels Are Increased in Recurrence of Testicular Germ Cell Tumor Patients. Int J Mol Sci 19(10) (2018). · DOI
- Kim, M. et al. MIR144 and MIR451 regulate human erythropoiesis via RAB14. Br J Haematol 168(4), 583–97 (2015). · DOI
- Benetatos, L. et al. The microRNAs within the DLK1-DIO3 genomic region: involvement in disease pathogenesis. Cell Mol Life Sci 70(5), 795–814 (2013). · DOI
- Seitz, H. et al. A large imprinted microRNA gene cluster at the mouse Dlk1-Gtl2 domain. Genome Res 14(9), 1741–8 (2004). · DOI · Paper page
- Leidinger, P. et al. Longitudinal study on circulating miRNAs in patients after lung cancer resection. Oncotarget 6(18): p. 16674–85 (2015). · DOI
- Meerson, A. & Ploug, T. Assessment of six commercial plasma small RNA isolation kits using qRT-PCR and electrophoretic separation: higher recovery of microRNA following ultracentrifugation. Biology Methods and Protocols 1(1), bpw003–bpw003 (2016). · DOI
- Williams, Z. et al. Comprehensive profiling of circulating microRNA via small RNA sequencing of cDNA libraries reveals biomarker potential and limitations. Proc Natl Acad Sci USA 110(11), 4255–60 (2013). · DOI
- Cheloufi, S. et al. A dicer-independent miRNA biogenesis pathway that requires Ago catalysis. Nature 465(7298), 584–9 (2010). · DOI · Paper page
- Cifuentes, D. et al. A novel miRNA processing pathway independent of Dicer requires Argonaute2 catalytic activity. Science 328(5986), 1694–8 (2010). · DOI
- Dore, L. C. et al. A GATA-1-regulated microRNA locus essential for erythropoiesis. Proc Natl Acad Sci USA 105(9), 3333–8 (2008). · DOI · Paper page
- Rasmussen, K. D. et al. The miR-144/451 locus is required for erythroid homeostasis. J Exp Med 207(7), 1351–8 (2010). · DOI · Paper page
- Blondal, T. et al. Assessing sample and miRNA profile quality in serum and plasma or other biofluids. Methods 59(1), S1–6 (2013). · DOI
- Guo, Z. et al. Genome-wide survey of tissue-specific microRNA and transcription factor regulatory networks in 12 tissues. Sci Rep 4, 5150 (2014). · DOI · Paper page
- Witwer, K. W. & Halushka, M. K. Toward the promise of microRNAs - Enhancing reproducibility and rigor in microRNA research. RNA Biol 13(11), 1103–1116 (2016). · DOI · Paper page
- Juzenas, S. et al. A comprehensive, cell specific microRNA catalogue of human peripheral blood. Nucleic Acids Res 45(16), 9290–9301 (2017). · DOI · Paper page
- Ameling, S. et al. Associations of circulating plasma microRNAs with age, body mass index and sex in a population-based study. BMC Med Genomics 8, 61 (2015). · DOI · Paper page
- Majid, S. et al. Regulation of minichromosome maintenance gene family by microRNA-1296 and genistein in prostate cancer. Cancer Res 70(7), 2809–18 (2010). · DOI
- Gaedicke, S. et al. Vitamin E dependent microRNA regulation in rat liver. FEBS Lett 582(23–24), 3542–6 (2008). · DOI
- Bollati, V. et al. Exposure to metal-rich particulate matter modifies the expression of candidate microRNAs in peripheral blood leukocytes. Environ Health Perspect 118(6), 763–8 (2010). · DOI · Paper page
- Cao, Y. et al. MicroRNA-dependent regulation of PTEN after arsenic trioxide treatment in bladder cancer cell line T24. Tumour Biol 32(1), 179–88 (2011). · DOI
- Avissar-Whiting, M. et al. Bisphenol A exposure leads to specific microRNA alterations in placental cells. Reprod Toxicol 29(4), 401–6 (2010). · DOI
- Rounge, T. B. et al. microRNA Biomarker Discovery and High-Throughput DNA Sequencing Are Possible Using Long-term Archived Serum Samples. Cancer Epidemiol Biomarkers Prev 24(9), 1381–7 (2015). · DOI
- Mestdagh, P. et al. Evaluation of quantitative miRNA expression platforms in the microRNA quality control (miRQC) study. Nat Methods 11(8), 809–15 (2014). · DOI · Paper page
- Ogata, T. & Kagami, M. Kagami-Ogata syndrome: a clinically recognizable upd(14)pat and related disorder affecting the chromosome 14q32.2 imprinted region. J Hum Genet 61(2), 87–94 (2016). · DOI
- Tsang, E. K. et al. Small RNA Sequencing in Cells and Exosomes Identifies eQTLs and 14q32 as a Region of Active Export. G3 (Bethesda) 7(1), 31–39 (2017). · DOI
- Morales-Prieto, D. M. et al. Pregnancy-associated miRNA-clusters. J Reprod Immunol 97(1), 51–61 (2013). · DOI
- Mansego, M. L. et al. DNA methylation of miRNA coding sequences putatively associated with childhood obesity. Pediatr Obes 12(1), 19–27 (2017). · DOI
- Okamoto, K. et al. A Series of microRNA in the Chromosome 14q32.2 Maternally Imprinted Region Related to Progression of Non-Alcoholic Fatty Liver Disease in a Mouse Model. PLoS One 11(5), e0154676 (2016). · DOI
- Nadal, E. et al. A MicroRNA cluster at 14q32 drives aggressive lung adenocarcinoma. Clin Cancer Res 20(12), 3107–17 (2014). · DOI
- Uppal, A. et al. 14q32-encoded microRNAs mediate an oligometastatic phenotype. Oncotarget 6(6), 3540–52 (2015). · DOI
- Strub, G. M. et al. Endothelial and circulating C19MC microRNAs are biomarkers of infantile hemangioma. JCI Insight 1(14), e88856 (2016). · DOI
- Formosa, A. et al. MicroRNAs, miR-154, miR-299-5p, miR-376a, miR-376c, miR-377, miR-381, miR-487b, miR-485-3p, miR-495 and miR-654-3p, mapped to the 14q32.31 locus, regulate proliferation, apoptosis, migration and invasion in metastatic prostate cancer cells. Oncogene 33(44), 5173–82 (2014). · DOI
- Menon, U. et al. Risk Algorithm Using Serial Biomarker Measurements Doubles the Number of Screen-Detected Cancers Compared With a Single-Threshold Rule in the United Kingdom Collaborative Trial of Ovarian Cancer Screening. J Clin Oncol 33(18), 2062–71 (2015). · DOI
- Menon, U. et al. Sensitivity and specificity of multimodal and ultrasound screening for ovarian cancer, and stage distribution of detected cancers: results of the prevalence screen of the UK Collaborative Trial of Ovarian Cancer Screening (UKCTOCS). Lancet Oncol 10(4), 327–40 (2009). · DOI
- Nakagawa, S. & Schielzeth, H. A general and simple method for obtaining R2 from generalized linear mixed-effects models. Methods in Ecology and Evolution 4(2), 133–142 (2013). · DOI · Paper page
Cited by
Sorted by citations
Validation of differentially expressed brain‐enriched microRNAs in the plasma of PD patients
Ravanidis, S., Bougea, A., Papagiannakis, N., Koros, C., Simitsi, A. M., Pachi, I., Breza, M., Stefanis, L., & Doxakis, E. (2020) · Annals of Clinical and Translational Neurology · doi:10.1002/acn3.51146 · Cited by 63
Metadata
- Authors
- Valbuena, G. N., Apostolidou, S., Roberts, R., Barnes, J., Alderton, W., Harper, L., Jacobs, I., Menon, U., & Keun, H. C.
- Venue
- Scientific Reports
- Published
- 2019-10-31
- Volume
- 9
- Issue
- 1
- ISSN
- 2045-2322
- PMC
- PMC6823392
- Cited by
- 13
- References
- 5
- Language
- en
- Funders
- Cancer Research UK (C19335/A22544, C1479/A2884)
- RCUK | Medical Research Council (G9901012, G0801228)
About these checks
Registry, retraction, Cites and statistics results are computed, not judged, with one exception: a printed reference that no index lists is read once by a model before it counts as a citation error. Claims are extracted by a model and kept only when their quote appears verbatim in the text; each cited source is then checked, with a model’s help, for whether it says what the claim relies on. Those verdicts can be wrong — read the claim’s quote and the cited source before relying on one.
Statistics and arithmetic are recomputed, not judged.
Confidence bands are shown only for fields calibrated on our annotated test set. None is calibrated yet, so no band is shown.
What counts as a claim ›How we measure confidence ›How we check this ›
Are you an author, or do you see a problem with this page? Request a review
