

The DOI matches its Crossref record; 28 of the 28 references it cites were found in a registry or an index.
The human-specific paralogs SRGAP2B and SRGAP2C differentially modulate SRGAP2A-dependent synaptic development
Open accessPublished version of a preprint
Abstract
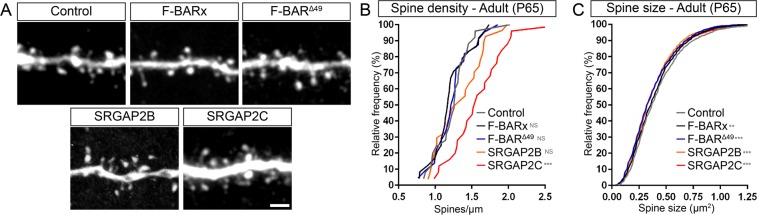
Human-specific gene duplications (HSGDs) have recently emerged as key modifiers of brain development and evolution. However, the molecular mechanisms underlying the function of HSGDs remain often poorly understood. In humans, a truncated duplication of SRGAP2A led to the emergence of two human-specific paralogs: SRGAP2B and SRGAP2C. The ancestral copy SRGAP2A limits synaptic density and promotes maturation of both excitatory (E) and inhibitory (I) synapses received by cortical pyramidal neurons (PNs). SRGAP2C binds to and inhibits all known functions of SRGAP2A leading to an increase in E and I synapse density and protracted synapse maturation, traits characterizing human cortical neurons. Here, we demonstrate how the evolutionary changes that led to the emergence of SRGAP2 HSGDs generated proteins that, in neurons, are intrinsically unstable and, upon hetero-dimerization with SRGAP2A, reduce SRGAP2A levels in a proteasome-dependent manner. Moreover, we show that, despite only a few non-synonymous mutations specifically targeting arginine residues, SRGAP2C is unique compared to SRGAP2B in its ability to induce long-lasting changes in synaptic density throughout adulthood. These mutations led to the ability of SRGAP2C to inhibit SRGAP2A function and thereby contribute to the emergence of human-specific features of synaptic development during evolution.
Overview
The claims and statistics of this paper haven’t been checked yet.
Free: it reads the open-access text and checks the first 5 claims that cite a source we can check. Create a free account to check every claim.
Integrity signals
Registry
Cites
Statistics
Figures


Verification
Claims the paper makes
The claims and statistics of this paper haven’t been checked yet.
Free: it reads the open-access text and checks the first 5 claims that cite a source we can check. Create a free account to check every claim.
Claims other papers make about this one
Each is checked against this paper’s own text: does it say what the citing paper says it does?
The source backs part of the claim, not all of it — or backs it for a different population, condition or comparison.
In the citing paper
“This approach was validated in deep-layer 5/6 human CPNs differentiated in vitro from pluripotent stem cells (PSCs) (Figures S1A and S1B), leading to a reduction in the levels of SRGAP2B/C proteins and thereby, as predicted by previous results,27,30 to increased levels of the ancestral protein SRGAP2A (Figure S1C).”
From Synaptic neoteny of human cortical neurons requires species-specific balancing of SRGAP2-SYNGAP1 cross-inhibition (2024) · cites this paper as [27]
Experimental — accuracy not yet measuredThe source backs part of the claim, not all of it — or backs it for a different population, condition or comparison.
In the citing paper
“Forced expression of SRGAP2B or SRGAP2C in developing mouse CPNs phenocopies a partial loss of SRGAP2A function, resulting in delayed synaptic maturation and increased density of excitatory and inhibitory synapses.24,27,29”
From Synaptic neoteny of human cortical neurons requires species-specific balancing of SRGAP2-SYNGAP1 cross-inhibition (2024) · cites this paper as [27]
Experimental — accuracy not yet measuredThe source backs part of the claim, not all of it — or backs it for a different population, condition or comparison.
In the citing paper
“At the molecular level, we found that downregulation of SRGAP2B/C increases SRGAP2A synaptic protein levels in human CPNs, as previously suggested in heterologous systems.27,28”
From Synaptic neoteny of human cortical neurons requires species-specific balancing of SRGAP2-SYNGAP1 cross-inhibition (2024) · cites this paper as [27]
Experimental — accuracy not yet measuredThe cited source says what the claim attributes to it.
In the citing paper
“SRGAP2B and SRGAP2C can form unstable heterodimers with SRGAP2A24 and are degraded by the proteasome in neurons.27,28”
From Synaptic neoteny of human cortical neurons requires species-specific balancing of SRGAP2-SYNGAP1 cross-inhibition (2024) · cites this paper as [27]
Self-check
Percentages, sums and reported differences re-computed from the paper’s own numbers.
The self-check needs the paper’s full text.
Citations
Cites
Matsuzaki, M., Ellis-Davies, G. C. R., Nemoto, T., Miyashita, Y., Iino, M., & Kasai, H. (2001) · Nature Neuroscience · doi:10.1038/nn736 · Cited by 1,802 · cited 1×
“When analyzing spine head size, which is linearly proportional to postsynaptic AMPA receptor content and therefore classically used as an index of synaptic maturation [18–20], we”
A novel source of arterial valve cells linked to bicuspid aortic valve without raphe in mice
Eley, L., Alqahtani, A. M., MacGrogan, D., Richardson, R. V., Murphy, L., Salguero-Jimenez, A., Sintes Rodriguez San Pedro, M., Tiurma, S., McCutcheon, L., Gilmore, A., et al. (2018) · eLife · doi:10.7554/elife.34110 · Cited by 1,138
Harris, K., & Stevens, J. (1989) · The Journal of Neuroscience · doi:10.1523/jneurosci.09-08-02982.1989 · Cited by 1,073 · cited 1×
“When analyzing spine head size, which is linearly proportional to postsynaptic AMPA receptor content and therefore classically used as an index of synaptic maturation [18–20], we”
Diversity of Human Copy Number Variation and Multicopy Genes
Sudmant, P. H., Kitzman, J. O., Antonacci, F., Alkan, C., Malig, M., Tsalenko, A., Sampas, N., Bruhn, L., Shendure, J., 1000 Genomes Project, et al. (2010) · Science · doi:10.1126/science.1197005 · Cited by 667
Human-specific gene ARHGAP11B promotes basal progenitor amplification and neocortex expansion
Florio, M., Albert, M., Taverna, E., Namba, T., Brandl, H., Lewitus, E., Haffner, C., Sykes, A., Wong, F. K., Peters, J., et al. (2015) · Science · doi:10.1126/science.aaa1975 · Cited by 632
A humanized version of Foxp2 affects cortico-basal ganglia circuits in mice
Enard, W., Gehre, S., Hammerschmidt, K., Hölter, S. M., Blass, T., Somel, M., Brückner, M. K., Schreiweis, C., Winter, C., Sohr, R., et al. (2009) · Cell · doi:10.1016/j.cell.2009.03.041 · Cited by 605
Human-Specific NOTCH2NL Genes Affect Notch Signaling and Cortical Neurogenesis
Fiddes, I. T., Lodewijk, G. A., Mooring, M., Bosworth, C. M., Ewing, A. D., Mantalas, G. L., Novak, A. M., van den Bout, A., Bishara, A., Rosenkrantz, J. L., et al. (2018) · Cell · doi:10.1016/j.cell.2018.03.051 · Cited by 595 · cited 2×
“regulating brain development [2–4,8,22,23].”
Ultrastructure of dendritic spines: correlation between synaptic and spine morphologies
Arellano, J. I. (2007) · Frontiers in Neuroscience · doi:10.3389/neuro.01.1.1.010.2007 · Cited by 529
Evolution of the Human Nervous System Function, Structure, and Development
Sousa, A. M. M., Meyer, K. A., Santpere, G., Gulden, F. O., & Sestan, N. (2017) · Cell · doi:10.1016/j.cell.2017.06.036 · Cited by 517 · cited 1×
“Recently, significant progress has been made in cataloging human-specific genetic changes, especially with respect to evolution of the human brain [1].”
BackgroundHuman-Specific NOTCH2NL Genes Expand Cortical Neurogenesis through Delta/Notch Regulation
Suzuki, I. K., Gacquer, D., Van Heurck, R., Kumar, D., Wojno, M., Bilheu, A., Herpoel, A., Lambert, N., Cheron, J., Polleux, F., et al. (2018) · Cell · doi:10.1016/j.cell.2018.03.067 · Cited by 471
Self-citation
Cited by
An epigenetic barrier sets the timing of human neuronal maturation
Ciceri, G., Baggiolini, A., Cho, H. S., Kshirsagar, M., Benito-Kwiecinski, S., Walsh, R. M., Aromolaran, K. A., Gonzalez-Hernandez, A. J., Munguba, H., Koo, S. Y., et al. (2024) · Nature · doi:10.1038/s41586-023-06984-8 · Cited by 240
“By contrast, human paralogues of the postsynaptic SRGAP2A gene 52 are specifically associated with protracted synaptogenesis and spine morphogenesis by modulating ancestral gene function 53–55 .”
Developmental mechanisms underlying the evolution of human cortical circuits
Vanderhaeghen, P., & Polleux, F. (2023) · Nature Reviews Neuroscience · doi:10.1038/s41583-023-00675-z · Cited by 173
Self-citationA human-specific modifier of cortical connectivity and circuit function
Schmidt, E. R. E., Zhao, H. T., Park, J. M., Dipoppa, M., Monsalve-Mercado, M. M., Dahan, J. B., Rodgers, C. C., Lejeune, A., Hillman, E. M. C., Miller, K. D., et al. (2021) · Nature · doi:10.1038/s41586-021-04039-4 · Cited by 82
Self-citationHuman neuronal maturation comes of age: cellular mechanisms and species differences
Wallace, J. L., & Pollen, A. A. (2024) · Nature Reviews Neuroscience · doi:10.1038/s41583-023-00760-3 · Cited by 82
Cellular and Molecular Mechanisms Linking Human Cortical Development and Evolution
Libé-Philippot, B., & Vanderhaeghen, P. (2021) · Annual Review of Genetics · doi:10.1146/annurev-genet-071719-020705 · Cited by 78
Metadata
- Authors
- Schmidt, E. R. E., Kupferman, J. V., Stackmann, M., & Polleux, F.
- Affiliations
- Mortimer B. Zuckerman Mind Brain Behavior Institute (US)
- Corresponding author
- Polleux, Franck
- Venue
- Scientific Reports
- Published
- 2019-12-10
- Volume
- 9
- Issue
- 1
- Pages
- 18692-18692
- ISSN
- 2045-2322 (ISSN-L)
- PMC
- PMC6904453
- OpenAlex
- W2995487222
- Cited by
- 55
- References
- 28
- Citations by year
- 2026: 6 · 2025: 7 · 2024: 14 · 2023: 13 · 2022: 5 · 2021: 8 · 2020: 2
- FWCI
- 2.26
- Type
- journal article
- Language
- en
- Open access
- gold
- doi.org
- Licence
- cc-by
- creativecommons.org/licenses/by/4.0 (tdm)
- creativecommons.org/licenses/by/4.0 (vor)
- Locations
- Scientific Reports (publishedVersion, cc-by)
- bioRxiv (Cold Spring Harbor Laboratory) (acceptedVersion, cc-by-nc-nd)
- PubMed Central (publishedVersion, cc-by)
- PubMed (publishedVersion)
- DOAJ (DOAJ: Directory of Open Access Journals) (submittedVersion)
- Funders
- U.S. Department of Health & Human Services | NIH | National Institute of Neurological Disorders and Stroke (NS067557)
- Topics
- Life Sciences › Biochemistry, Genetics and Molecular Biology › Genetics › Genetics and Neurodevelopmental Disorders
- Life Sciences › Neuroscience › Cellular and Molecular Neuroscience › Neuroscience and Neuropharmacology Research
- Life Sciences › Neuroscience › Developmental Neuroscience › Neurogenesis and neuroplasticity mechanisms
- Keywords
- synaptic development, synaptic density, synapse maturation, excitatory and inhibitory synapses, cortical pyramidal neurons, protein instability, proteasomal degradation, heterodimerization, non-synonymous mutations, human brain evolution, brain development
- MeSH terms
- Animals, Humans, Neurons, Synapses, Pyramidal Cells, Evolution, Molecular, Gene Duplication, GTPase-Activating Proteins, Organogenesis, Cell Line, Tumor, Mice, Primary Cell Culture
About these checks
Registry, retraction, Cites and statistics results are computed, not judged, with one exception: a printed reference that no index lists is read once by a model before it counts as a citation error. Claims are extracted by a model and kept only when their quote appears verbatim in the text; each cited source is then checked, with a model’s help, for whether it says what the claim relies on. Those verdicts can be wrong — read the claim’s quote and the cited source before relying on one.
Statistics and arithmetic are recomputed, not judged.
Confidence bands are shown only for fields calibrated on our annotated test set. None is calibrated yet, so no band is shown.
What counts as a claim ›How we measure confidence ›How we check this ›
Are you an author, or do you see a problem with this page? Request a review
How to cite
Cite CoChat for the checks on this page, and the paper for its own findings.
- This page
- CoChat. (2026). Citation check: The human-specific paralogs SRGAP2B and SRGAP2C differentially modulate SRGAP2A-dependent synaptic development. https://app.cochat.ai/papers/10.1038/s41598-019-54887-4
- The paper
- Schmidt, E. R. E., Kupferman, J. V., Stackmann, M., & Polleux, F. (2019). The human-specific paralogs SRGAP2B and SRGAP2C differentially modulate SRGAP2A-dependent synaptic development. Scientific Reports. https://doi.org/10.1038/s41598-019-54887-4
Data sources
Bibliographic data: Semantic Scholar, OpenAlex, Crossref.
Contains information from the Semantic Scholar Academic Graph Datasets, made available under the ODC Attribution License (ODC-BY 1.0).
Semantic Scholar’s data is described in: Kinney, R., et al. (2023). The Semantic Scholar Open Data Platform. arXiv:2301.10140.
