

The DOI matches its Crossref record; 63 of the 63 references it cites were found in a registry or an index.
Modulation of Wnt/β-catenin signaling promotes blood-brain barrier phenotype in cultured brain endothelial cells
Open accessAbstract
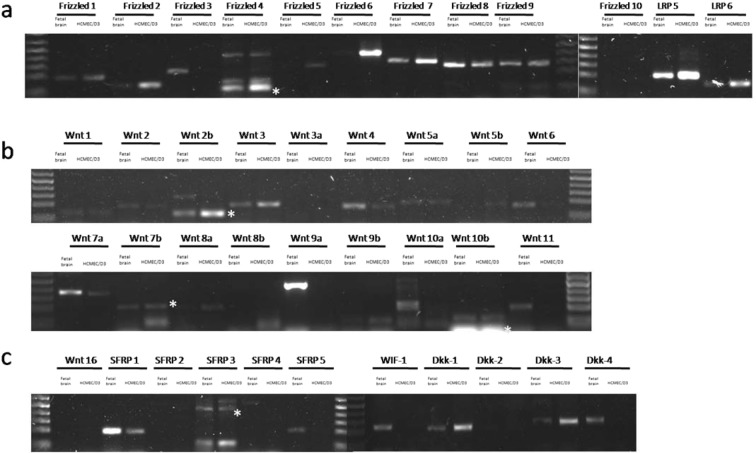
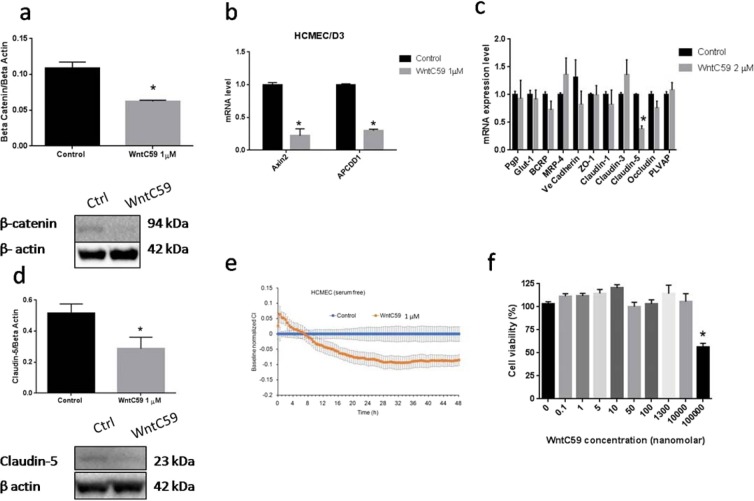
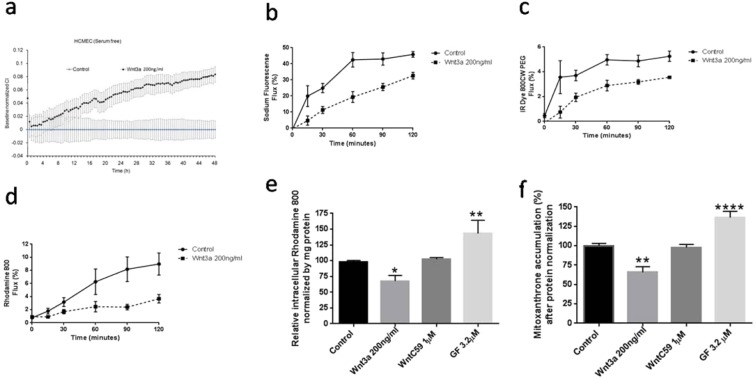
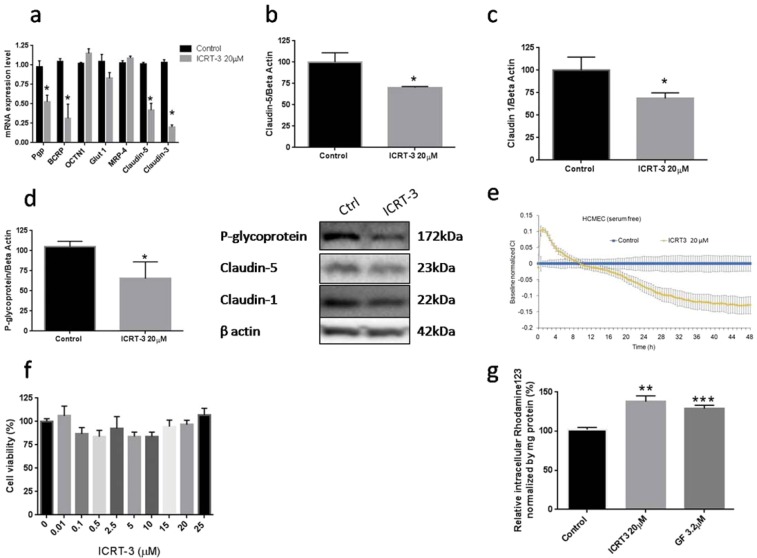
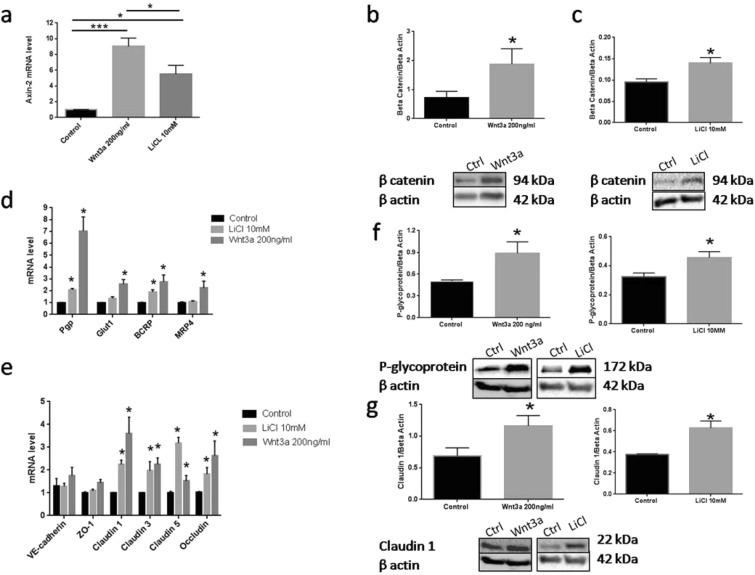
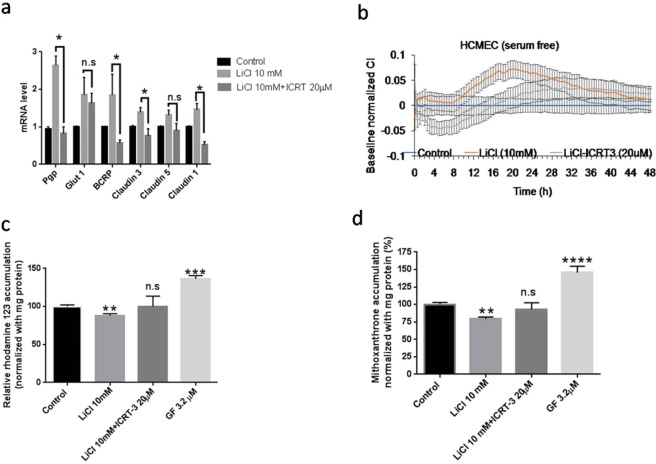
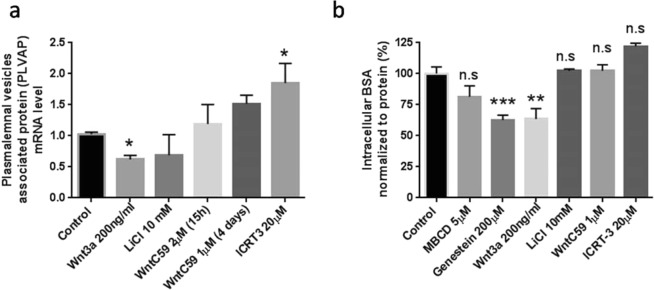
Wnt/β-catenin signaling is important for blood-brain barrier (BBB) development and is implicated in BBB breakdown under various pathophysiological conditions. In the present study, a comprehensive characterization of the relevant genes, transport and permeability processes influenced by both the autocrine and external activation of Wnt signaling in human brain endothelial cells was examined using hCMEC/D3 culture model. The hCMEC/D3 expressed a full complement of Wnt ligands and receptors. Preventing Wnt ligand release from hCMEC/D3 produced minimal changes in brain endothelial function, while inhibition of intrinsic/autocrine Wnt/β-catenin activity through blocking β-catenin binding to Wnt transcription factor caused more modest changes. In contrast, activation of Wnt signaling using exogenous Wnt ligand (Wnt3a) or LiCl (GSK3 inhibitor) improved the BBB phenotypes of the hCMEC/D3 culture model, resulting in reduced paracellular permeability, and increased P-glycoprotein (P-gp) and breast cancer resistance associated protein (BCRP) efflux transporter activity. Further, Wnt3a reduced plasmalemma vesicle associated protein (PLVAP) and vesicular transport activity in hCMEC/D3. Our data suggest that this in vitro model of the BBB has a more robust response to exogenous activation of Wnt/β-catenin signaling compared to autocrine activation, suggesting that BBB regulation may be more dependent on external activation of Wnt signaling within the brain microvasculature.
Overview
The claims and statistics of this paper haven’t been checked yet.
Run the check — free, no account needed. It reads the open-access text and checks the sources it cites.
Integrity signals
Registry
Cites
Statistics
Figures
Verification
Claims the paper makes
The claims and statistics of this paper haven’t been checked yet.
Run the check — free, no account needed. It reads the open-access text and checks the sources it cites.
Claims other papers make about this one
Each is checked against this paper’s own text: does it say what the citing paper says it does?
The cited source says what the claim attributes to it.
In the citing paper
“Consistently, exogenous Wnt activation enhances endothelial barrier function, 77 suggesting that ApoE3Ch‐EVs may act as modulators of this pathway.”
From Plasma extracellular vesicles from APOE3 Christchurch carriers display a protective phenotype in early stages of autosomal dominant Alzheimer's disease (2026) · cites this paper as [77]
Self-check
Percentages, sums and reported differences re-computed from the paper’s own numbers.
The self-check needs the paper’s full text.
Citations
Cites
Structure and function of the blood–brain barrier
Abbott, N. J., Patabendige, A. A. K., Dolman, D. E. M., Yusof, S. R., & Begley, D. J. (2010) · Neurobiology of Disease · doi:10.1016/j.nbd.2009.07.030 · Cited by 5,185
Daneman, R., & Prat, A. (2015) · Cold Spring Harbor Perspectives in Biology · doi:10.1101/cshperspect.a020412 · Cited by 3,437
Convergence of Wnt, ß-Catenin, and Cadherin Pathways
Nelson, W. J., & Nusse, R. (2004) · Science · doi:10.1126/science.1094291 · Cited by 2,537
Wnt Signaling: Multiple Pathways, Multiple Receptors, and Multiple Transcription Factors
Gordon, M. D., & Nusse, R. (2006) · Journal of Biological Chemistry · doi:10.1074/jbc.r600015200 · Cited by 1,333
Blood‐brain barrier‐specific properties of a human adult brain endothelial cell line
Weksler, B. B., Subileau, E.-A., Perrière, N., Charneau, P., Holloway, K. E., Leveque, M., Tricoire-Leignel, H., Nicotra, A., Bourdoulous, S., Turowski, P., et al. (2005) · The FASEB Journal · doi:10.1096/fj.04-3458fje · Cited by 1,325
Lithium inhibits glycogen synthase kinase-3 activity and mimics wingless signalling in intact cells
Stambolic, V., Ruel, L., & Woodgett, J. R. (1996) · Current Biology · doi:10.1016/s0960-9822(02)70790-2 · Cited by 1,321
Functional morphology of the blood–brain barrier in health and disease
Liebner, S., Dijkhuizen, R. M., Reiss, Y., Plate, K. H., Agalliu, D., & Constantin, G. (2018) · Acta Neuropathologica · doi:10.1007/s00401-018-1815-1 · Cited by 872
Wnt/β-catenin signaling controls development of the blood–brain barrier
Liebner, S., Corada, M., Bangsow, T., Babbage, J., Taddei, A., Czupalla, C. J., Reis, M., Felici, A., Wolburg, H., Fruttiger, M., et al. (2008) · The Journal of Cell Biology · doi:10.1083/jcb.200806024 · Cited by 860
Helms, H. C., Abbott, N. J., Burek, M., Cecchelli, R., Couraud, P.-O., Deli, M. A., Förster, C., Galla, H. J., Romero, I. A., Shusta, E. V., et al. (2016) · Journal of Cerebral Blood Flow & Metabolism · doi:10.1177/0271678x16630991 · Cited by 843
Monounsaturated Fatty Acid Modification of Wnt Protein: Its Role in Wnt Secretion
Takada, R., Satomi, Y., Kurata, T., Ueno, N., Norioka, S., Kondoh, H., Takao, T., & Takada, S. (2006) · Developmental Cell · doi:10.1016/j.devcel.2006.10.003 · Cited by 807
The hCMEC/D3 cell line as a model of the human blood brain barrier
Weksler, B., Romero, I. A., & Couraud, P.-O. (2013) · Fluids and Barriers of the CNS · doi:10.1186/2045-8118-10-16 · Cited by 753
Wnt/β-catenin signaling is required for CNS, but not non-CNS, angiogenesis
Daneman, R., Agalliu, D., Zhou, L., Kuhnert, F., Kuo, C. J., & Barres, B. A. (2009) · Proceedings of the National Academy of Sciences · doi:10.1073/pnas.0805165106 · Cited by 753
The Use of Inhibitors to Study Endocytic Pathways of Gene Carriers: Optimization and Pitfalls
Vercauteren, D., Vandenbroucke, R. E., Jones, A. T., Rejman, J., Demeester, J., Smedt, S. C. D., Sanders, N. N., & Braeckmans, K. (2009) · Molecular Therapy · doi:10.1038/mt.2009.281 · Cited by 694
The R-spondin/Lgr5/Rnf43 module: regulator of Wnt signal strength
de Lau, W., Peng, W. C., Gros, P., & Clevers, H. (2014) · Genes & Development · doi:10.1101/gad.235473.113 · Cited by 656
Secreted and transmembrane wnt inhibitors and activators
Cruciat, C.-M., & Niehrs, C. (2013) · Cold Spring Harbor Perspectives in Biology · doi:10.1101/cshperspect.a015081 · Cited by 646
Canonical Wnt Signaling Regulates Organ-Specific Assembly and Differentiation of CNS Vasculature
Stenman, J. M., Rajagopal, J., Carroll, T. J., Ishibashi, M., McMahon, J., & McMahon, A. P. (2008) · Science · doi:10.1126/science.1164594 · Cited by 641
Emerging roles of Wnts in the adult nervous system
Inestrosa, N. C., & Arenas, E. (2009) · Nature reviews. Neuroscience · doi:10.1038/nrn2755 · Cited by 622
Doble, B. W., Patel, S., Wood, G. A., Kockeritz, L. K., & Woodgett, J. R. (2007) · Developmental Cell · doi:10.1016/j.devcel.2007.04.001 · Cited by 458
Norrin/Frizzled4 Signaling in Retinal Vascular Development and Blood Brain Barrier Plasticity
Wang, Y., Rattner, A., Zhou, Y., Williams, J., Smallwood, P. M., & Nathans, J. (2012) · Cell · doi:10.1016/j.cell.2012.10.042 · Cited by 406
Surrogate Wnt agonists that phenocopy canonical Wnt and β-catenin signalling
Janda, C. Y., Dang, L. T., You, C., Chang, J., de Lau, W., Zhong, Z. A., Yan, K. S., Marecic, O., Siepe, D., Li, X., et al. (2017) · Nature · doi:10.1038/nature22306 · Cited by 403
Proffitt, K. D., Madan, B., Ke, Z., Pendharkar, V. V., Ding, L., Lee, M. A., Hannoush, R. N., & Virshup, D. M. (2012) · Cancer Research · doi:10.1158/0008-5472.can-12-2258 · Cited by 389
Wnts as ligands: processing, secretion and reception
Mikels, A. J., & Nusse, R. (2006) · Oncogene · doi:10.1038/sj.onc.1210053 · Cited by 370
Canonical WNT signaling components in vascular development and barrier formation
Zhou, Y., Wang, Y., Tischfield, M. A., Williams, J., Smallwood, P. M., Rattner, A., Taketo, M. M., & Nathans, J. (2014) · Journal of Clinical Investigation · doi:10.1172/jci76431 · Cited by 356
A Stable and Reproducible Human Blood-Brain Barrier Model Derived from Hematopoietic Stem Cells
Cecchelli, R., Aday, S., Sevin, E., Almeida, C., Culot, M., Dehouck, L., Coisne, C., Engelhardt, B., Dehouck, M.-P., & Ferreira, L. (2014) · PLoS ONE · doi:10.1371/journal.pone.0099733 · Cited by 349
Gonsalves, F. C., Klein, K., Carson, B. B., Katz, S., Ekas, L. A., Evans, S., Nagourney, R., Cardozo, T., Brown, A. M. C., & DasGupta, R. (2011) · Proceedings of the National Academy of Sciences · doi:10.1073/pnas.1017496108 · Cited by 337
Poller, B., Gutmann, H., Krähenbühl, S., Weksler, B. B., Romero, I. A., Couraud, P., Tuffin, G., Drewe, J., & Huwyler, J. (2008) · Journal of Neurochemistry · doi:10.1111/j.1471-4159.2008.05730.x · Cited by 318
de Lau, W. B. M., Snel, ., & Clevers, H. C. (2012) · Genome biology · doi:10.1186/gb-2012-13-3-242 · Cited by 309
Activity-dependent synaptic Wnt release regulates hippocampal long term potentiation
Chen, J., Park, C. S., & Tang, S.-J. (2006) · Journal of Biological Chemistry · doi:10.1074/jbc.m511920200 · Cited by 298
Lim, R. G., Quan, C., Reyes-Ortiz, A. M., Lutz, S. E., Kedaigle, A. J., Gipson, T. A., Wu, J., Vatine, G. D., Stocksdale, J., Casale, M. S., et al. (2017) · Cell Reports · doi:10.1016/j.celrep.2017.04.021 · Cited by 253
Tran, K. A., Zhang, X., Predescu, D., Huang, X., Machado, R. F., Göthert, J. R., Malik, A. B., Valyi-Nagy, T., & Zhao, Y.-Y. (2016) · Circulation · doi:10.1161/circulationaha.115.015982 · Cited by 219
Scholz, B., Korn, C., Wojtarowicz, J., Mogler, C., Augustin, I., Boutros, M., Niehrs, C., & Augustin, H. G. (2016) · Developmental Cell · doi:10.1016/j.devcel.2015.12.015 · Cited by 193
ABC transporters at the blood–brain barrier
Mahringer, A., & Fricker, G. (2016) · Expert Opinion on Drug Metabolism & Toxicology · doi:10.1517/17425255.2016.1168804 · Cited by 181
Reduction in paracrine Wnt3 factors during aging causes impaired adult neurogenesis
Okamoto, M., Inoue, K., Iwamura, H., Terashima, K., Soya, H., Asashima, M., & Kuwabara, T. (2011) · The FASEB Journal · doi:10.1096/fj.11-184697 · Cited by 171
Wang, Y., Cho, C., Williams, J., Smallwood, P. M., Zhang, C., Junge, H. J., & Nathans, J. (2018) · Proceedings of the National Academy of Sciences · doi:10.1073/pnas.1813217115 · Cited by 169
Lim, J. C., Kania, K., Wijesuriya, H. C., Chawla, S., Sethi, J. K., Pułaski, Ł., Romero, I. A., Couraud, P. O., Weksler, B. B., Hladky, S. B., et al. (2008) · Journal of Neurochemistry · doi:10.1111/j.1471-4159.2008.05537.x · Cited by 163
Wnts in adult brain: from synaptic plasticity to cognitive deficiencies
Oliva, C. A., Vargas, J. Y., & Inestrosa, N. C. (2013) · Frontiers in Cellular Neuroscience · doi:10.3389/fncel.2013.00224 · Cited by 162
Franco, C. A., Jones, M. L., Bernabéu, M. O., Vion, A.-C., Barbacena, P., Fan, J., Mathivet, T., Fonseca, C. G., Ragab, A., Yamaguchi, T. P., et al. (2016) · eLife · doi:10.7554/elife.07727 · Cited by 154
Endothelial Wnt/β-catenin signaling reduces immune cell infiltration in multiple sclerosis
Lengfeld, J. E., Lutz, S. E., Smith, J. R., Diaconu, C., Scott, C., Kofman, S. B., Choi, C., Walsh, C. M., Raine, C. S., Agalliu, I., et al. (2017) · Proceedings of the National Academy of Sciences · doi:10.1073/pnas.1609905114 · Cited by 152
Wnt/β-catenin Signaling in Normal and Cancer Stem Cells
Valkenburg, K. C., Graveel, C. R., Diegel, C. R., Zhong, Z. A., & Williams, B. O. (2011) · Cancers · doi:10.3390/cancers3022050 · Cited by 144
Fontaine, M., Elmquist, W. F., & Miller, D. W. (1996) · Life Sciences · doi:10.1016/0024-3205(96)00483-3 · Cited by 133
Self-citationEndothelial cell-derived non-canonical Wnt ligands control vascular pruning in angiogenesis
Korn, C., Scholz, B., Hu, J., Srivastava, K., Wojtarowicz, J., Arnsperger, T., Adams, R. H., Boutros, M., Augustin, H. G., & Augustin, I. (2014) · Development · doi:10.1242/dev.104422 · Cited by 133
Vu, K., Weksler, B., Romero, I., Couraud, P.-O., & Gelli, A. (2009) · Eukaryotic Cell · doi:10.1128/ec.00240-09 · Cited by 124
Bardelmeijer, H. A., Beijnen, J. H., Brouwer, K. R., Rosing, H., Nooijen, W. J., Schellens, J. H. M., & van Tellingen, O. (2000) · PubMed · Cited by 121
Paolinelli, R., Corada, M., Ferrarini, L., Devraj, K., Artus, C., Czupalla, C. J., Rudini, N., Maddaluno, L., Papa, E., Engelhardt, B., et al. (2013) · PLoS ONE · doi:10.1371/journal.pone.0070233 · Cited by 120
Mapping of Wnt‐Frizzled interactions by multiplex CRISPR targeting of receptor gene families
Voloshanenko, O., Gmach, P., Winter, J., Kranz, D., & Boutros, M. (2017) · The FASEB Journal · doi:10.1096/fj.201700144r · Cited by 118
Plasmalemma vesicle-associated protein: A crucial component of vascular homeostasis
Guo, L., Zhang, H., Hou, Y., Wei, T., & Liu, J. (2016) · Experimental and Therapeutic Medicine · doi:10.3892/etm.2016.3557 · Cited by 115
Goodwin, A. M., Sullivan, K., & D'Amore, P. A. (2006) · Developmental Dynamics · doi:10.1002/dvdy.20939 · Cited by 111
Shue, E. H., Carson-Walter, E. B., Liu, Y., Winans, B., Ali, Z. S., Chen, J., & Walter, K. A. (2008) · BMC Neuroscience · doi:10.1186/1471-2202-9-29 · Cited by 109
Klein, D., Demory, A., Peyre, F., Krøll, J., Augustin, H. G., Helfrich, W., Kzhyshkowska, J. G., Schledzewski, K., Arnold, B., & Goerdt, S. (2008) · Hepatology · doi:10.1002/hep.22084 · Cited by 109
Liu, L., Wan, W., Xia, S., Kalionis, B., & Li, Y. (2014) · Neurochemistry International · doi:10.1016/j.neuint.2014.05.004 · Cited by 96
Dyrna, F. G. E., Hanske, S., Krueger, M. C., & Bechmann, I. (2013) · Journal of Neuroimmune Pharmacology · doi:10.1007/s11481-013-9473-5 · Cited by 92
Abcg2/Bcrp1 Mediates the Polarized Transport of Antiretroviral Nucleosides Abacavir and Zidovudine
Pan, G., Giri, N., & Elmquist, W. F. (2007) · Drug Metabolism and Disposition · doi:10.1124/dmd.106.014274 · Cited by 90
Lack of endothelial diaphragms in fenestrae and caveolae of mutant Plvap-deficient mice
Herrnberger, L., Seitz, R., Kuespert, S., Bösl, M. R., Fuchshofer, R., & Tamm, E. R. (2012) · Histochemistry and Cell Biology · doi:10.1007/s00418-012-0987-3 · Cited by 76
Teng, Z., Kuang, X., Wang, J., & Zhang, X. (2013) · Journal of Virological Methods · doi:10.1016/j.jviromet.2013.06.034 · Cited by 64
Kulczar, C. D., Lubin, K. E., Lefebvre, S., Miller, D. W., & Knipp, G. T. (2017) · Journal of Pharmacy and Pharmacology · doi:10.1111/jphp.12803 · Cited by 62
Self-citationPinzón‐Daza, M. L., Salaroglio, I. C., Kopecka, J., Garzón, R., Couraud, P., Ghigo, D., & Riganti, C. (2014) · Journal of Cerebral Blood Flow & Metabolism · doi:10.1038/jcbfm.2014.100 · Cited by 56
On, N. H., & Miller, D. W. (2014) · Current Pharmaceutical Design · doi:10.2174/13816128113199990458 · Cited by 47
Self-citationHarati, R., Bénech, H., Villégier, A., & Mabondzo, A. M. (2012) · Molecular Pharmaceutics · doi:10.1021/mp300334r · Cited by 46
Morphogens and blood-brain barrier function in health and disease
Wevers, N. R., & de Vries, H. E. (2015) · Tissue Barriers · doi:10.1080/21688370.2015.1090524 · Cited by 42
Nguyen, H., Mejia, E. M., Chang, W., Wang, Y., Watson, E. J., On, N. H., Miller, D. W., & Hatch, G. M. (2016) · Journal of Neurochemistry · doi:10.1111/jnc.13753 · Cited by 26
Self-citationLuhmann, U. F. O., Neidhardt, J., Kloeckener‐Gruissem, B., Schäfer, N., Glaus, E., Feil, S., & Berger, W. (2008) · European Journal of Neuroscience · doi:10.1111/j.1460-9568.2008.06237.x · Cited by 21
On, N. H., Chen, F., Hinton, M., & Miller, D. W. (2011) · Pharmaceutical Research · doi:10.1007/s11095-011-0478-6 · Cited by 19
Self-citationDifferential internalization of brick shaped iron oxide nanoparticles by endothelial cells
Sun, Z., Worden, M., Wroczynskyj, Y., Manna, P. K., Thliveris, J. A., van Lierop, J., Hegmann, T., & Miller, D. W. (2016) · Journal of Materials Chemistry B · doi:10.1039/c6tb01480a · Cited by 11
Self-citation
Cited by
Sorted by citations
Takata, F., Nakagawa, S., Matsumoto, J., & Dohgu, S. (2021) · Frontiers in Cellular Neuroscience · doi:10.3389/fncel.2021.661838 · Cited by 651
Vojdani, A., Vojdani, E., & Kharrazian, D. (2021) · Frontiers in Immunology · doi:10.3389/fimmu.2020.617089 · Cited by 322
Activation of Wnt/β-catenin pathway mitigates blood–brain barrier dysfunction in Alzheimer’s disease
Wang, Q., Huang, X., Su, Y., Yin, G., Wang, S., Yu, B., Li, H., Qi, J., Chen, H., Zeng, W., et al. (2022) · Brain · doi:10.1093/brain/awac236 · Cited by 226
Juvale, I. I. A., Hamid, A. A. A., Halim, K. B. A., & Has, A. T. C. (2022) · Heliyon · doi:10.1016/j.heliyon.2022.e09777 · Cited by 215
Schulz, J., Hartz, A. M. S., & Bauer, B. (2023) · Pharmacological Reviews · doi:10.1124/pharmrev.120.000025 · Cited by 116
Metadata
- Authors
- Laksitorini, M. D., Yathindranath, V., Xiong, W., Hombach-Klonisch, S., & Miller, D. W.
- Affiliations
- Universitas Gadjah Mada (ID)
- University of Manitoba (CA)
- Health Sciences Centre (CA)
- Corresponding author
- Miller, Donald W.
- Venue
- Scientific Reports
- Published
- 2019-12-23
- Volume
- 9
- Issue
- 1
- Pages
- 19718-19718
- ISSN
- 2045-2322 (ISSN-L)
- PMC
- PMC6928218
- OpenAlex
- W2997752650
- Cited by
- 105
- References
- 63
- Citations by year
- 2026: 13 · 2025: 9 · 2024: 21 · 2023: 12 · 2022: 21 · 2021: 19 · 2020: 10
- FWCI
- 5.50
- Type
- journal article
- Language
- en
- Open access
- gold
- doi.org
- Locations
- Scientific Reports (publishedVersion, cc-by)
- Europe PMC (PubMed Central) (publishedVersion, cc-by)
- PubMed Central (publishedVersion, cc-by)
- PubMed (publishedVersion)
- DOAJ (DOAJ: Directory of Open Access Journals) (submittedVersion)
- Funders
- Manitoba Health Research Council
- University of Manitoba
- Canadian Breast Cancer Foundation
- Cancer Research Society
- Topics
- Life Sciences › Neuroscience › Neurology › Barrier Structure and Function Studies
- Health Sciences › Medicine › Oncology › Drug Transport and Resistance Mechanisms
- Life Sciences › Biochemistry, Genetics and Molecular Biology › Molecular Biology › Wnt/β-catenin signaling in development and cancer
- Keywords
- Wnt/β-catenin signaling, blood-brain barrier, brain endothelial cells, hCMEC/D3, Wnt3a, paracellular permeability, P-glycoprotein, ABCG2, efflux pumps, PLVAP, vesicle trafficking, GSK3 inhibition, blood-brain barrier disruption
- MeSH terms
- Blood-Brain Barrier, Cells, Cultured, Endocytosis, Gene Expression Regulation, Humans, Ligands, Membrane Proteins, Oxazoles, Phenotype, Receptors, Cell Surface, Lithium Chloride, Autocrine Communication, Endothelial Cells, Wnt Signaling Pathway
About these checks
Registry, retraction, Cites and statistics results are computed, not judged, with one exception: a printed reference that no index lists is read once by a model before it counts as a citation error. Claims are extracted by a model and kept only when their quote appears verbatim in the text; each cited source is then checked, with a model’s help, for whether it says what the claim relies on. Those verdicts can be wrong — read the claim’s quote and the cited source before relying on one.
Statistics and arithmetic are recomputed, not judged.
Confidence bands are shown only for fields calibrated on our annotated test set. None is calibrated yet, so no band is shown.
What counts as a claim ›How we measure confidence ›How we check this ›
Are you an author, or do you see a problem with this page? Request a review
