

The DOI matches its Crossref record; 49 of the 49 references it cites were found in a registry or an index.
COVID-19-mandated social restrictions unveil the impact of social time pressure on sleep and body clock
Open accessAbstract
In humans, sleep regulation is tightly linked to social times that assign local time to events, such as school, work, or meals. The impact of these social times, collectively-social time pressure, on sleep has been studied epidemiologically via quantification of the discrepancy between sleep times on workdays and those on work-free days. This discrepancy is known as the social jetlag (SJL). COVID-19-mandated social restrictions (SR) constituted a global intervention by affecting social times worldwide. We launched a Global Chrono Corona Survey (GCCS) that queried sleep-wake times before and during SR (preSR and inSR). 11,431 adults from 40 countries responded between April 4 and May 6, 2020. The final sample consisted of 7517 respondents (68.2% females), who had been 32.7 ± 9.1 (mean ± sd) days under SR. SR led to robust changes: mid-sleep time on workdays and free days was delayed by 50 and 22 min, respectively; sleep duration increased on workdays by 26 min but shortened by 9 min on free days; SJL decreased by ~ 30 min. On workdays inSR, sleep-wake times in most people approached those of their preSR free days. Changes in sleep duration and SJL correlated with inSR-use of alarm clocks and were larger in young adults. The data indicate a massive sleep deficit under pre-pandemic social time pressure, provide insights to the actual sleep need of different age-groups and suggest that tolerable SJL is about 20 min. Relaxed social time pressure promotes more sleep, smaller SJL and reduced use of alarm clocks.
Overview
The claims and statistics of this paper haven’t been checked yet.
Run the check — free, no account needed. It reads the open-access text and checks the sources it cites.
Integrity signals
Registry
Cites
Statistics
Figures
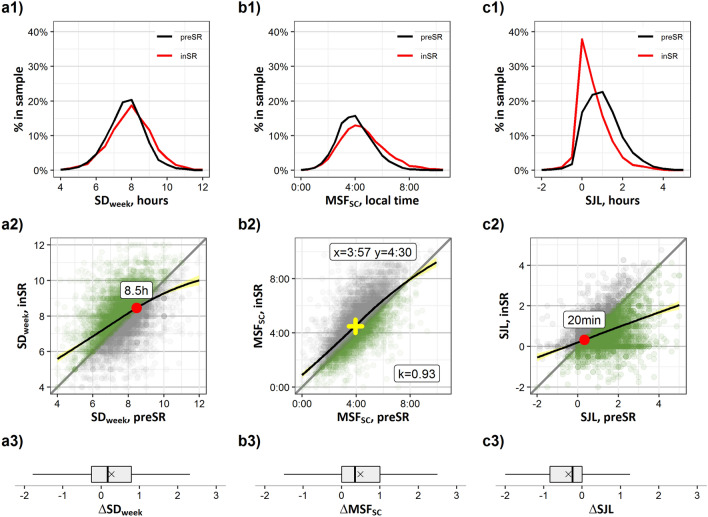
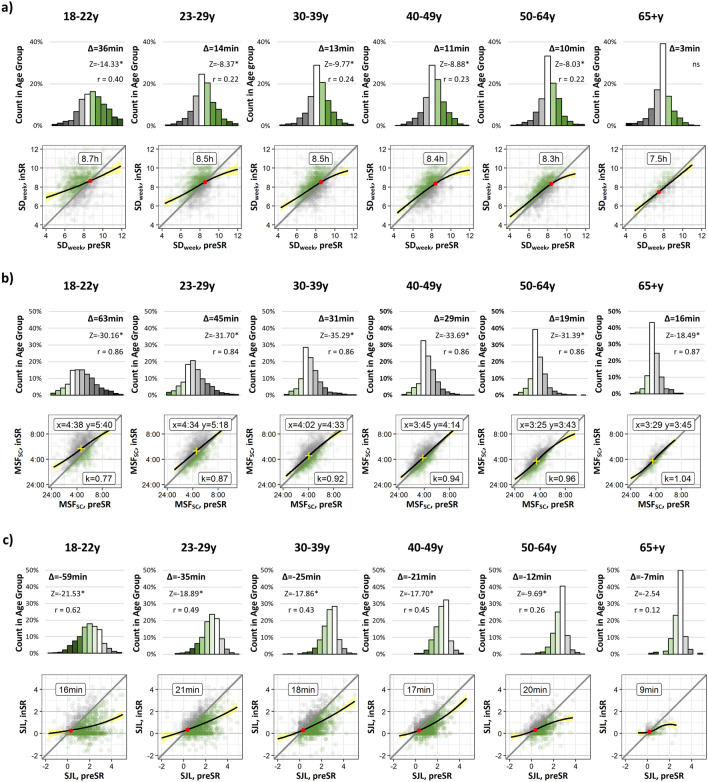
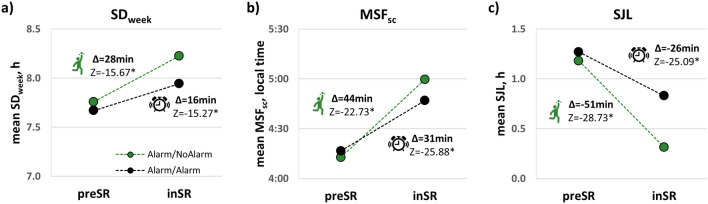
Verification
Claims the paper makes
The claims and statistics of this paper haven’t been checked yet.
Run the check — free, no account needed. It reads the open-access text and checks the sources it cites.
Claims other papers make about this one
Each is checked against this paper’s own text: does it say what the citing paper says it does?
In the citing paper
“The host immune response to SARS-CoV-2 infection, the persistent psychological stress before and during infection (Korman et al., 2020, Vai et al., 2020), and a possible direct viral infections of the central nervous system represent possible mechanisms to induce neuropsychiatric sequelae (Troyer et al., 2020).”
From Persistent psychopathology and neurocognitive impairment in COVID-19 survivors: effect of inflammatory biomarkers at three-month follow-up (2021) · cites this paper as Korman et al., 2020
Self-check
Percentages, sums and reported differences re-computed from the paper’s own numbers.
The self-check needs the paper’s full text.
Citations
Cites
Locally Weighted Regression: An Approach to Regression Analysis by Local Fitting
Cleveland, W. S., & Devlin, S. J. (1988) · Journal of the American Statistical Association · doi:10.1080/01621459.1988.10478639 · Cited by 5,893
A self-assessment questionnaire to determine morningness- eveningness in human circadian rhythms
Home, J. K. (1976) · Medical Entomology and Zoology · Cited by 4,783
(1976) · PubMed · Cited by 3,979
The Handbook of Research Synthesis.
Howel, D., Cooper, H., & Hedges, L. V. (1995) · Biometrics · doi:10.2307/2533295 · Cited by 3,657
Life between Clocks: Daily Temporal Patterns of Human Chronotypes
Roenneberg, T., Wirz-Justice, A., & Merrow, M. (2003) · Journal of Biological Rhythms · doi:10.1177/0748730402239679 · Cited by 2,662
Self-citationSocial Jetlag: Misalignment of Biological and Social Time
Wittmann, M., Dinich, J., Merrow, M., & Roenneberg, T. (2006) · Chronobiology International · doi:10.1080/07420520500545979 · Cited by 2,625
Self-citationA marker for the end of adolescence
Roenneberg, T., Kuehnle, T., Pramstaller, P. P., Ricken, J., Havel, M., Guth, A., & Merrow, M. (2004) · Current Biology · doi:10.1016/j.cub.2004.11.039 · Cited by 1,585
Self-citationEpidemiology of the human circadian clock
Roenneberg, T., Kuehnle, T., Juda, M., Kantermann, T., Allebrandt, K., Gordijn, M., & Merrow, M. (2007) · Sleep Medicine Reviews · doi:10.1016/j.smrv.2007.07.005 · Cited by 1,545
Self-citationRoenneberg, T., Allebrandt, K. V., Merrow, M., & Vetter, C. (2012) · Current Biology · doi:10.1016/j.cub.2012.03.038 · Cited by 1,407
Self-citationSleep in Adolescents: The Perfect Storm
Carskadon, M. A. (2011) · Pediatric Clinics of North America · doi:10.1016/j.pcl.2011.03.003 · Cited by 1,122
Chronotype and Social Jetlag: A (Self-) Critical Review
Roenneberg, T., Pilz, L. K., Zerbini, G., & Winnebeck, E. C. (2019) · Biology · doi:10.3390/biology8030054 · Cited by 803
Self-citationEntrainment of the Human Circadian Clock to the Natural Light-Dark Cycle
Wright, K. P., McHill, A. W., Birks, B. R., Griffin, B. R., Rusterholz, T., & Chinoy, E. D. (2013) · Current Biology · doi:10.1016/j.cub.2013.06.039 · Cited by 783
The aging clock: circadian rhythms and later life
Hood, S., & Amir, S. (2017) · Journal of Clinical Investigation · doi:10.1172/jci90328 · Cited by 645
Wever, R. (1979) · Topics in environmental physiology and medicine · doi:10.1007/978-1-4612-6142-1 · Cited by 623
Depression scores associate with chronotype and social jetlag in a rural population
Levandovski, R., Dantas, G., Fernandes, L. C., Caumo, W., Torres, I., Roenneberg, T., Hidalgo, M. P. L., & Allebrandt, K. V. (2011) · Chronobiology International · doi:10.3109/07420528.2011.602445 · Cited by 527
Self-citationThe circadian system of man—Results of experiments under temporal isolation
(1980) · Comparative Biochemistry and Physiology Part A Physiology · doi:10.1016/s0300-9629(80)80040-5 · Cited by 515
Chronotypes in the US–influence of age and sex
Fischer, D., Lombardi, D. A., Marucci-Wellman, H., & Roenneberg, T. (2017) · PLOS ONE · doi:10.1371/journal.pone.0178782 · Cited by 502
Self-citationDijk, D., Duffy, J. F., Riel, E., Shanahan, T. L., & Czeisler, C. A. (1999) · The Journal of Physiology · doi:10.1111/j.1469-7793.1999.0611v.x · Cited by 467
Social jetlag, chronotype, and cardiometabolic risk
Wong, P. M., Hasler, B. P., Kamarck, T. W., Muldoon, M. F., & Manuck, S. B. (2015) · The Journal of Clinical Endocrinology & Metabolism · doi:10.1210/jc.2015-2923 · Cited by 444
Social jetlag, obesity and metabolic disorder: investigation in a cohort study
Parsons, M. J., Moffitt, T. E., Gregory, A. M., Goldman-Mellor, S., Nolan, P. M., Poulton, R., & Caspi, A. (2015) · International Journal of Obesity · doi:10.1038/ijo.2014.201 · Cited by 426
Chronotype Modulates Sleep Duration, Sleep Quality, and Social Jet Lag in Shift-Workers
Juda, M., Vetter, C., & Roenneberg, T. (2013) · Journal of Biological Rhythms · doi:10.1177/0748730412475042 · Cited by 418
Self-citationSocial influences on mammalian circadian rhythms: animal and human studies
Mistlberger, R. E., & Skene, D. J. (2004) · Biological reviews/Biological reviews of the Cambridge Philosophical Society · doi:10.1017/s1464793103006353 · Cited by 402
Roenneberg, T., Daan, S., & Merrow, M. (2003) · Journal of Biological Rhythms · doi:10.1177/0748730403018003001 · Cited by 387
Self-citationEffects of the COVID-19 lockdown on human sleep and rest-activity rhythms
Blume, C., Schmidt, M. H., & Cajochen, C. (2020) · Current Biology · doi:10.1016/j.cub.2020.06.021 · Cited by 298
Sleep in university students prior to and during COVID-19 stay-at-home orders
Wright, K. P., Linton, S. K., Withrow, D., Casiraghi, L., Lanza, S. M., Iglesia, H. D. L., Vetter, C., & Depner, C. M. (2020) · Current Biology · doi:10.1016/j.cub.2020.06.022 · Cited by 293
Is Social Jetlag Associated with an Adverse Endocrine, Behavioral, and Cardiovascular Risk Profile?
Rutters, F., Lemmens, S. G., Adam, T. C., Bremmer, M. A., Elders, P. J., Nijpels, G., & Dekker, J. M. (2014) · Journal of Biological Rhythms · doi:10.1177/0748730414550199 · Cited by 274
Light and the Human Circadian Clock
Roenneberg, T., Kantermann, T., Juda, M., Vetter, C., & Allebrandt, K. V. (2013) · Handbook of experimental pharmacology · doi:10.1007/978-3-642-25950-0_13 · Cited by 244
Self-citationEffects of lockdown on human sleep and chronotype during the COVID-19 pandemic
Leone, M. J., Sigman, M., & Golombek, D. A. (2020) · Current Biology · doi:10.1016/j.cub.2020.07.015 · Cited by 231
Sleep and Circadian Rhythm Disruption in Social Jetlag and Mental Illness
Foster, R. G., Peirson, S. N., Wulff, K., Winnebeck, E., Vetter, C., & Roenneberg, T. (2013) · Progress in Molecular Biology and Translational Science · doi:10.1016/b978-0-12-396971-2.00011-7 · Cited by 224
Self-citationHandbook of Experimental Pharmacology
Leng, G., Dickson, S. L., Menzies, J. R. W., Skibicka, K. P., & Egecioglu, K. (2012) · Cited by 217
Kleitman, N. (1940) · The American Journal of the Medical Sciences · doi:10.1097/00000441-194002000-00041 · Cited by 203
Mismatch of Sleep and Work Timing and Risk of Type 2 Diabetes
Vetter, C., Devore, E. E., Ramin, C. A., Speizer, F. E., Willett, W. C., & Schernhammer, E. S. (2015) · Diabetes Care · doi:10.2337/dc15-0302 · Cited by 195
The Effects of Regularizing Sleep-Wake Schedules on Daytime Sleepiness
Manber, R., Bootzin, R. R., Acebo, C., & Carskadon, M. A. (1996) · Sleep · doi:10.1093/sleep/19.5.432 · Cited by 189
Wittmann, M., Paulus, M. P., & Roenneberg, T. (2009) · Substance Use & Misuse · doi:10.3109/10826080903498952 · Cited by 178
Self-citationSleep duration and mortality – Does weekend sleep matter?
Åkerstedt, T., Ghilotti, F., Grotta, A., Zhao, H., Adami, H., Lagerros, Y. T., & Bellocco, R. (2018) · Journal of Sleep Research · doi:10.1111/jsr.12712 · Cited by 159
The µMCTQ: An Ultra-Short Version of the Munich ChronoType Questionnaire
Ghotbi, N., Pilz, L. K., Winnebeck, E. C., Vetter, C., Zerbini, G., Lenssen, D., Frighetto, G., Salamanca, M., Costa, R., Montagnese, S., et al. (2019) · Journal of Biological Rhythms · doi:10.1177/0748730419886986 · Cited by 159
Self-citationSkeldon, A. C., Phillips, A. J. K., & Dijk, D.-J. (2017) · Scientific Reports · doi:10.1038/srep45158 · Cited by 155
Adams, S. K., Williford, D. N., Vaccaro, A., Kisler, T. S., Francis, A. R., & Newman, B. M. (2016) · International Journal of Adolescence and Youth · doi:10.1080/02673843.2016.1181557 · Cited by 119
A survey on social jetlag in Japan: a nationwide, cross-sectional internet survey
Komada, Y., Okajima, I., Kitamura, S., & Inoue, Y. (2019) · Sleep and Biological Rhythms · doi:10.1007/s41105-019-00229-w · Cited by 63
Self-citationKelly, R. M., Finn, J., Healy, U., Gallen, D., Sreenan, S., McDermott, J. H., & Coogan, A. N. (2019) · Sleep Medicine · doi:10.1016/j.sleep.2019.07.023 · Cited by 56
Social jetlag and menstrual symptoms among female university students
Komada, Y., Ikeda, Y., Sato, M., Kami, A., Masuda, C., & Shibata, S. (2018) · Chronobiology International · doi:10.1080/07420528.2018.1533561 · Cited by 54
Self-citationThe effects of chronotype, sleep schedule and light/dark pattern exposures on circadian phase
Figueiro, M. G., Plitnick, B., & Rea, M. S. (2014) · Sleep Medicine · doi:10.1016/j.sleep.2014.07.009 · Cited by 53
The alerting effect of the wake maintenance zone during 40 hours of sleep deprivation
de Zeeuw, J., Wisniewski, S., Papakonstantinou, A., Bes, F., Wahnschaffe, A., Zaleska, M., Kunz, D., & Münch, M. Y. (2018) · Scientific Reports · doi:10.1038/s41598-018-29380-z · Cited by 34
(2020) · Springer eBooks · doi:10.1007/978-981-15-3110-1 · Cited by 34
Korman, M., Levy, I., Maaravi-Hesseg, R., Eshed-Mantel, A., & Karni, A. (2019) · Frontiers in Psychology · doi:10.3389/fpsyg.2019.01397 · Cited by 13
Self-citationSaxvig, I. W., Wilhelmsen‐Langeland, A., Pallesen, S., Nordhus, I. H., Vedaa, Ø., & Bjorvatn, B. (2019) · Frontiers in Psychology · doi:10.3389/fpsyg.2019.02569 · Cited by 11
Zerbini, G. (2017) · University of Groningen research database (University of Groningen / Centre for Information Technology) · Cited by 7
Moon, H., Yoo, S. J., & Cho, Y. W. (2017) · Journal of the Neurological Sciences · doi:10.1016/j.jns.2017.08.841 · Cited by 4
An Investigation of Attention, Sleep, Impulsivity, and Employment in College Students
Clare, G. (2019) · NORMA · Cited by 2
Research works printed but not linked: 1
- Hume, K. I. & Mills, J. N. Rhythms of REM and slow-wave sleep in subjects living on abnormal time schedules. Waking Sleep. 1, 291–296 (1977).
Cited by
Sorted by citations
Mazza, M. G., Palladini, M., De Lorenzo, R., Magnaghi, C., Poletti, S., Furlan, R., Ciceri, F., Rovere-Querini, P., & Benedetti, F. (2021) · Brain, Behavior, and Immunity · doi:10.1016/j.bbi.2021.02.021 · Cited by 513
“The host immune response to SARS-CoV-2 infection, the persistent psychological stress before and during infection (Korman et al., 2020; Vai et al., 2020), and a possible direct viral infections of the central nervous system represent possible mechanisms to induce neuropsychiatric sequelae (Troyer et al.”
Insomnia, anxiety, and depression during the COVID-19 pandemic: An international collaborative study
Morin, C. M., Bjorvatn, B., Chung, F., Holzinger, B., Partinen, M., Penzel, T., Ivers, H., Wing, Y. K., Chan, N. Y., Merikanto, I., et al. (2021) · Sleep Medicine · doi:10.1016/j.sleep.2021.07.035 · Cited by 312
Social Jetlag and Related Risks for Human Health: A Timely Review
Caliandro, R., Streng, A. A., van Kerkhof, L. W. M., van der Horst, G. T. J., & Chaves, I. (2021) · Nutrients · doi:10.3390/nu13124543 · Cited by 231
Bhat, S., & Chokroverty, S. (2021) · Sleep Medicine · doi:10.1016/j.sleep.2021.07.021 · Cited by 153
How can social jetlag affect health?
Roenneberg, T. (2023) · Nature Reviews Endocrinology · doi:10.1038/s41574-023-00851-2 · Cited by 96
Self-citation
Metadata
- Authors
- Korman, M., Tkachev, V., Reis, C., Komada, Y., Kitamura, S., Gubin, D., Kumar, V., & Roenneberg, T.
- Affiliations
- Ariel University (IL)
- University of Lisbon (PT)
- Meiji Pharmaceutical University (JP)
- National Center of Neurology and Psychiatry (JP)
- Russian Academy of Sciences (RU)
- University of Delhi (IN)
- Technische Universität Darmstadt (DE)
- Corresponding author
- Korman, Maria
- ORCID
- Venue
- Scientific Reports
- Published
- 2020-12-17
- Volume
- 10
- Issue
- 1
- Pages
- 22225-22225
- ISSN
- 2045-2322 (ISSN-L)
- PMC
- PMC7746700
- OpenAlex
- W3112246049
- Cited by
- 161
- References
- 49
- Citations by year
- 2026: 9 · 2025: 18 · 2024: 32 · 2023: 31 · 2022: 28 · 2021: 43
- FWCI
- 24.65
- Type
- journal article
- Language
- en
- Open access
- gold
- doi.org
- Locations
- Scientific Reports (publishedVersion, cc-by)
- PubMed Central (publishedVersion, cc-by)
- PubMed (publishedVersion)
- DOAJ (DOAJ: Directory of Open Access Journals) (submittedVersion, cc-by-sa)
- Open access LMU (Ludwid Maxmilian's Universitat Munchen) (submittedVersion, cc-by)
- Portuguese National Funding Agency for Science, Research and Technology (RCAAP Project by FCT) (submittedVersion, other-oa)
- Tokyo Tech Research Repository (Tokyo Institute of Technology) (submittedVersion)
- Funders
- Ariel University
- Japan Society for the Promotion of Science (19K10994)
- Topics
- Social Sciences › Psychology › Experimental and Cognitive Psychology › Sleep and related disorders
- Life Sciences › Neuroscience › Endocrine and Autonomic Systems › Circadian rhythm and melatonin
- Social Sciences › Psychology › Experimental and Cognitive Psychology › Sleep and Work-Related Fatigue
- Keywords
- social jetlag, sleep timing, sleep duration, circadian rhythm
- MeSH terms
- Physical Distancing, COVID-19, SARS-CoV-2, Adolescent, Adult, Aged, Circadian Rhythm, Female, Humans, Interpersonal Relations, Male, Middle Aged, Surveys and Questionnaires, Sleep, Social Behavior, Time Factors, Jet Lag Syndrome, Young Adult
About these checks
Registry, retraction, Cites and statistics results are computed, not judged, with one exception: a printed reference that no index lists is read once by a model before it counts as a citation error. Claims are extracted by a model and kept only when their quote appears verbatim in the text; each cited source is then checked, with a model’s help, for whether it says what the claim relies on. Those verdicts can be wrong — read the claim’s quote and the cited source before relying on one.
Statistics and arithmetic are recomputed, not judged.
Confidence bands are shown only for fields calibrated on our annotated test set. None is calibrated yet, so no band is shown.
What counts as a claim ›How we measure confidence ›How we check this ›
Are you an author, or do you see a problem with this page? Request a review
