Cited by 42

The DOI matches its Crossref record; 8 of the 8 references it cites were found in a registry or an index.

Regulation of plasma triglyceride partitioning by adipose-derived ANGPTL4 in mice

Spitler, Kathryn M., Shetty, Shwetha K., Cushing, Emily M., Sylvers-Davie, Kelli L., Davies, Brandon S. J.·2021·Scientific Reports

Abstract

Elevated plasma triglyceride levels are associated with metabolic disease. Angiopoietin-like protein 4 (ANGPTL4) regulates plasma triglyceride levels by inhibiting lipoprotein lipase (LPL). Our aim was to investigate the role of adipocyte-specific deficiency of ANGPTL4 in mice during high fat diet feeding. Adipocyte-specific ANGPTL4 deficient mice were fed a high fat diet (60% kCal from fat) for either 12 weeks or 6 months. We performed plasma metabolic measurements, triglyceride clearance and uptake assays, LPL activity assays, and assessed glucose homeostasis. Mice lacking adipocyte ANGPTL4 recapitulated the triglyceride phenotypes of whole-body ANGPTL4 deficiency, including increased adipose LPL activity, lower plasma triglyceride levels, and increased uptake of triglycerides into adipose tissue. When fed a high fat diet (HFD), these mice continued to display enhanced adipose LPL activity and initially had improved glucose and insulin sensitivity. However, after 6 months on HFD, the improvements in glucose homeostasis were largely lost. Moreover, despite higher adipose LPL activity levels, mice lacking adipocyte ANGPTL4 no longer had increased triglyceride uptake into adipose compared to littermate controls after chronic high-fat feeding. These observations suggest that after chronic high-fat feeding LPL is no longer rate-limiting for triglyceride delivery to adipocytes. We conclude that while adipocyte-derived ANGPTL4 is an important regulator of plasma triglyceride levels and triglyceride partitioning under normal diet conditions, its role is diminished after chronic high-fat feeding.

Overview

The claims and statistics of this paper haven’t been checked yet.

Run the check — free, no account needed. It reads the open-access text and checks the sources it cites.

A few free checks a day · papers already verified open instantly · results are public

Integrity signals

Registry

Crossref · 10.1038/s41598-021-87020-5

Cites

8 of 8 references verified0 citation errors · 0 not checkable

Statistics

Figures

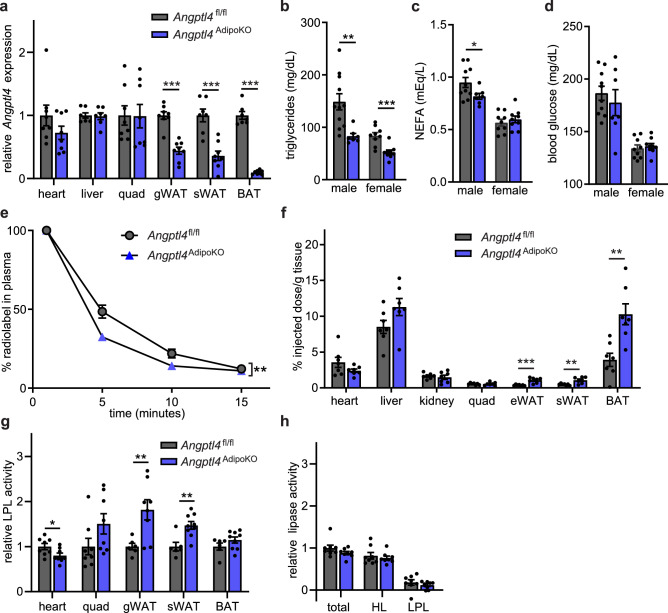
Figure 1 Characterization of mice with adipocyte-specific deletion of Angptl4. (a) mRNA expression of Angptl4 in liver, heart, quadriceps muscle (quad), gonadal white adipose tissue (gWAT), subcutaneous white adipose tissue (sWAT), and brown adipose tissues (BAT) from 8–12 week old female Angptl4fl/fl (n = 8) and Angptl4AdipoKO (n = 8) mice following a 6 h fast (mean ± SEM). (b–d) Fasting plasma triglyceride (b), non-esterified fatty acid (c), and blood glucose (d) levels in 8–12 week male and female Angptl4fl/fl and Angptl4AdipoKO mice following a 6 h fast (mean ± SEM; n = 7–11). (e, f) Fasted (6 h) female Angptl4fl/fl (n = 8) and Angptl4AdipoKO (n = 7) mice were injected intravenously with 3H-triglyceride–containing chylomicrons. (e) Clearance of radiolabel from the plasma 1, 5, 10, and 15 min after injection. Points represent percentage of radiolabel remaining in the plasma at the indicated time points compared to the 1 min time point (mean ± SEM). (f) Uptake of radiolabel after 15 min (% injected dose/g tissue) into the indicated tissues (mean ± SEM). (g) Heart, quadricep muscle (quad), gonadal white adipose tissue (gWAT), subcutaneous adipose tissue (sWAT), and brown adipose (BAT) tissue from fasted (6 h) female Angptl4fl/fl and Angptl4AdipoKO mice were harvested and lipase activity was measured (n = 6–9/group). (h) Liver was harvested from fasted (6 h) female Angptl4fl/fl and Angptl4AdipoKO mice (n = 8/group). Lipase activity was measured in the presence or absence of 1 M-NaCl to distinguish between hepatic and lipoprotein lipase. Bars show relative lipase activity in each tissue normalized to Angptl4fl/fl (mean ± SEM). *p < 0.05, **p < 0.01, ***p < 0.001 by t-test analysis (panels a–c, f, g) or repeated measures ANOVA (panel e).
Figure 1 Characterization of mice with adipocyte-specific deletion of Angptl4. (a) mRNA expression of Angptl4 in liver, heart, quadriceps muscle (quad), gonadal white adipose tissue (gWAT), subcutaneous white adipose tissue (sWAT), and brown adipose tissues (BAT) from 8–12 week old female Angptl4fl/fl (n = 8) and Angptl4AdipoKO (n = 8) mice following a 6 h fast (mean ± SEM). (b–d) Fasting plasma triglyceride (b), non-esterified fatty acid (c), and blood glucose (d) levels in 8–12 week male and female Angptl4fl/fl and Angptl4AdipoKO mice following a 6 h fast (mean ± SEM; n = 7–11). (e, f) Fasted (6 h) female Angptl4fl/fl (n = 8) and Angptl4AdipoKO (n = 7) mice were injected intravenously with 3H-triglyceride–containing chylomicrons. (e) Clearance of radiolabel from the plasma 1, 5, 10, and 15 min after injection. Points represent percentage of radiolabel remaining in the plasma at the indicated time points compared to the 1 min time point (mean ± SEM). (f) Uptake of radiolabel after 15 min (% injected dose/g tissue) into the indicated tissues (mean ± SEM). (g) Heart, quadricep muscle (quad), gonadal white adipose tissue (gWAT), subcutaneous adipose tissue (sWAT), and brown adipose (BAT) tissue from fasted (6 h) female Angptl4fl/fl and Angptl4AdipoKO mice were harvested and lipase activity was measured (n = 6–9/group). (h) Liver was harvested from fasted (6 h) female Angptl4fl/fl and Angptl4AdipoKO mice (n = 8/group). Lipase activity was measured in the presence or absence of 1 M-NaCl to distinguish between hepatic and lipoprotein lipase. Bars show relative lipase activity in each tissue normalized to Angptl4fl/fl (mean ± SEM). *p < 0.05, **p < 0.01, ***p < 0.001 by t-test analysis (panels a–c, f, g) or repeated measures ANOVA (panel e).CC BY · PubMed Central
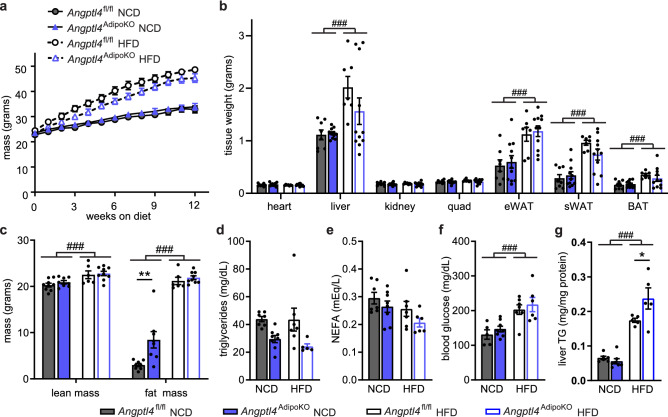
Figure 2 Body weights, fat mass, and metabolic phenotypes of Angptl4fl/fl and Angptl4AdipoKO mice. (a) Weekly body weights of male Angptl4fl/fl and Angptl4AdipoKO mice fed either a normal chow diet (NCD) or a high fat diet (HFD; 60% by kCal) for 12 weeks starting at 8 weeks of age (mean ± SEM; n = 12–19/group). (b) Tissues weights of heart, liver, kidney, quadriceps muscle (quad), epididymal white adipose (eWAT), subcutaneous white adipose tissue (sWAT), and brown adipose tissue (BAT) in male Angptl4fl/fl and Angptl4AdipoKO mice after 12 weeks on diet (mean ± SEM; n = 7–11group). (c) Lean muscle and fat mass of male Angptl4fl/fl and Angptl4AdipoKO mice as measured by NMR after 12 weeks on diet (mean ± SEM; n = 6–9/group). Plasma triglycerides (d), plasma non-esterified fatty acids (e), blood glucose (f), and liver triglycerides (g) of fasted (6 h) male Angptl4fl/fl and Angptl4AdipoKO mice at the end of 12 weeks on diet (mean ± SEM; n = 5–8/group). ###p < 0.001 for dietary differences by two-way ANOVA. *p < 0.05, **p < 0.01 for individual genotype-specific differences by multiple comparison after two-way ANOVA (Tukey correction).
Figure 2 Body weights, fat mass, and metabolic phenotypes of Angptl4fl/fl and Angptl4AdipoKO mice. (a) Weekly body weights of male Angptl4fl/fl and Angptl4AdipoKO mice fed either a normal chow diet (NCD) or a high fat diet (HFD; 60% by kCal) for 12 weeks starting at 8 weeks of age (mean ± SEM; n = 12–19/group). (b) Tissues weights of heart, liver, kidney, quadriceps muscle (quad), epididymal white adipose (eWAT), subcutaneous white adipose tissue (sWAT), and brown adipose tissue (BAT) in male Angptl4fl/fl and Angptl4AdipoKO mice after 12 weeks on diet (mean ± SEM; n = 7–11group). (c) Lean muscle and fat mass of male Angptl4fl/fl and Angptl4AdipoKO mice as measured by NMR after 12 weeks on diet (mean ± SEM; n = 6–9/group). Plasma triglycerides (d), plasma non-esterified fatty acids (e), blood glucose (f), and liver triglycerides (g) of fasted (6 h) male Angptl4fl/fl and Angptl4AdipoKO mice at the end of 12 weeks on diet (mean ± SEM; n = 5–8/group). ###p < 0.001 for dietary differences by two-way ANOVA. *p < 0.05, **p < 0.01 for individual genotype-specific differences by multiple comparison after two-way ANOVA (Tukey correction).CC BY · PubMed Central
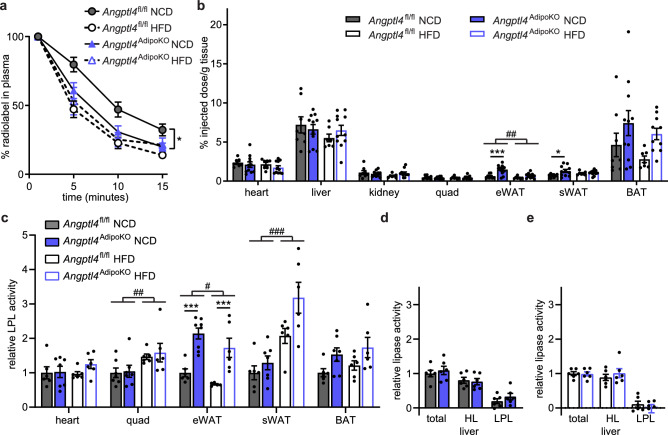
Figure 3 Chylomicron clearance and uptake and lipase activity in Angptl4AdipoKO mice. (a, b) At the conclusion of 12 weeks of either normal chow diet (NCD) or high fat diet (HFD) Angptl4fl/fl and Angptl4AdipoKO male mice (n = 7–10/group) were fasted (6 h) and injected intravenously with 3H-triglyceride–containing chylomicrons. (a) Clearance of radiolabel from the plasma 1, 5, 10, and 15 min after injection. Points represent percentage of radiolabel remaining in the plasma at the indicated time points compared to the 1-min time point (mean ± SEM). *p < 0.05 by repeated measures ANOVA. (b) Uptake of radiolabel (% injected dose/g tissue) into the indicated tissues after 15 min (mean ± SEM). ##p < 0.01 for dietary differences by two-way ANOVA. *p < 0.05, ***p < 0.001 for individual genotype-specific differences by multiple comparison after two-way ANOVA (Tukey correction). (c) Heart, quadricep muscle (quad), epididymal adipose tissue (eWAT), subcutaneous adipose tissue (sWAT), and brown adipose (BAT) tissue from fasted (6 h) male Angptl4fl/fl and Angptl4AdipoKO mice were harvested and lipase activity was measured (n = 6–8/group). (d, e) Liver was harvested from fasted (6 h) male Angptl4fl/fl and Angptl4AdipoKO mice (d, NCD groups and e, HFD groups) (n = 6/group). Lipase activity was measured in the presence or absence of 1 M NaCl to distinguish between hepatic and lipoprotein lipase. Bars show relative lipase activity in each tissue normalized to Angptl4fl/fl (mean ± SEM). #p < 0.05, ##p < 0.01, ###p < 0.001 for dietary differences by two-way ANOVA. ***p < 0.001 for individual genotype-specific differences by multiple comparison after two-way ANOVA (Tukey correction).
Figure 3 Chylomicron clearance and uptake and lipase activity in Angptl4AdipoKO mice. (a, b) At the conclusion of 12 weeks of either normal chow diet (NCD) or high fat diet (HFD) Angptl4fl/fl and Angptl4AdipoKO male mice (n = 7–10/group) were fasted (6 h) and injected intravenously with 3H-triglyceride–containing chylomicrons. (a) Clearance of radiolabel from the plasma 1, 5, 10, and 15 min after injection. Points represent percentage of radiolabel remaining in the plasma at the indicated time points compared to the 1-min time point (mean ± SEM). *p < 0.05 by repeated measures ANOVA. (b) Uptake of radiolabel (% injected dose/g tissue) into the indicated tissues after 15 min (mean ± SEM). ##p < 0.01 for dietary differences by two-way ANOVA. *p < 0.05, ***p < 0.001 for individual genotype-specific differences by multiple comparison after two-way ANOVA (Tukey correction). (c) Heart, quadricep muscle (quad), epididymal adipose tissue (eWAT), subcutaneous adipose tissue (sWAT), and brown adipose (BAT) tissue from fasted (6 h) male Angptl4fl/fl and Angptl4AdipoKO mice were harvested and lipase activity was measured (n = 6–8/group). (d, e) Liver was harvested from fasted (6 h) male Angptl4fl/fl and Angptl4AdipoKO mice (d, NCD groups and e, HFD groups) (n = 6/group). Lipase activity was measured in the presence or absence of 1 M NaCl to distinguish between hepatic and lipoprotein lipase. Bars show relative lipase activity in each tissue normalized to Angptl4fl/fl (mean ± SEM). #p < 0.05, ##p < 0.01, ###p < 0.001 for dietary differences by two-way ANOVA. ***p < 0.001 for individual genotype-specific differences by multiple comparison after two-way ANOVA (Tukey correction).CC BY · PubMed Central
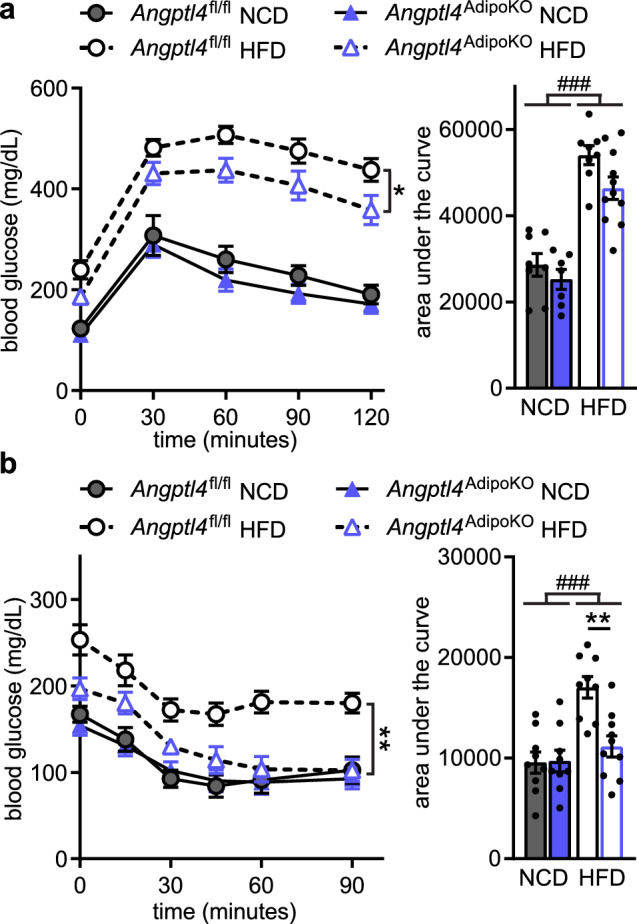
Figure 4 Glucose tolerance and insulin sensitivity of Angptl4AdipoKO mice. (a) Glucose tolerance tests were performed on fasted (6 h) male Angptl4fl/fl and Angptl4AdipoKO mice after 11 weeks of either a normal chow diet (NCD) or high fat diet (HFD). Blood glucose concentrations were measured over 2 h after injection with glucose. Points represent glucose levels (mean ± SEM; n = 8–11) at each respective time point. *p < 0.05 by repeated measures ANOVA. Bar graphs represent area under the curve (mean ± SEM) for all time points. ###p < 0.001 for dietary differences by two-way ANOVA. (b) Insulin tolerance tests were performed on fasted (4 h) male Angptl4fl/fl and Angptl4AdipoKO mice after 12 weeks on diet. Blood glucose concentrations were measured over 90 min after injection with insulin. Points represent glucose levels (mean ± SEM; n = 9–10) at each respective time point. **p < 0.01 for individual genotype-specific differences by repeated measures ANOVA. Bar graphs represent area under the curve (mean ± SEM) for all time points. ###p < 0.001 for dietary differences by two-way ANOVA. **p < 0.01 for individual genotype-specific differences by multiple comparison after two-way ANOVA (Tukey correction).
Figure 4 Glucose tolerance and insulin sensitivity of Angptl4AdipoKO mice. (a) Glucose tolerance tests were performed on fasted (6 h) male Angptl4fl/fl and Angptl4AdipoKO mice after 11 weeks of either a normal chow diet (NCD) or high fat diet (HFD). Blood glucose concentrations were measured over 2 h after injection with glucose. Points represent glucose levels (mean ± SEM; n = 8–11) at each respective time point. *p < 0.05 by repeated measures ANOVA. Bar graphs represent area under the curve (mean ± SEM) for all time points. ###p < 0.001 for dietary differences by two-way ANOVA. (b) Insulin tolerance tests were performed on fasted (4 h) male Angptl4fl/fl and Angptl4AdipoKO mice after 12 weeks on diet. Blood glucose concentrations were measured over 90 min after injection with insulin. Points represent glucose levels (mean ± SEM; n = 9–10) at each respective time point. **p < 0.01 for individual genotype-specific differences by repeated measures ANOVA. Bar graphs represent area under the curve (mean ± SEM) for all time points. ###p < 0.001 for dietary differences by two-way ANOVA. **p < 0.01 for individual genotype-specific differences by multiple comparison after two-way ANOVA (Tukey correction).CC BY · PubMed Central
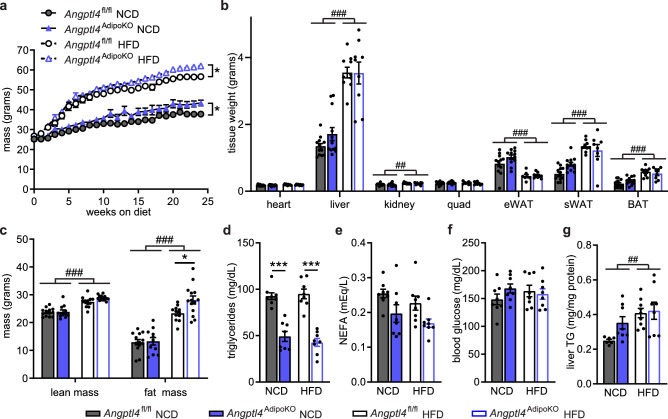
Figure 5 Body weights, fat mass, and metabolic phenotypes of Angptl4fl/fl and Angptl4AdipoKO mice after chronic high-fat feeding. (a) Weekly body weights of male Angptl4fl/fl and Angptl4AdipoKO mice fed either a normal chow diet (NCD) or high fat diet (HFD) for 6 months starting at 8 weeks of age (mean ± SEM; n = 10–17/group). *p < 0.05 by repeated measures ANOVA. (b) Tissues weights of heart, liver, kidney, quadriceps muscle (quad), epididymal white adipose (eWAT), subcutaneous white adipose tissue (sWAT), and brown adipose tissue (BAT) in male Angptl4fl/fl and Angptl4AdipoKO mice after 6 months on diet (mean ± SEM; n = 8–13/group). (c) Lean muscle mass and fat mass of male Angptl4fl/fl and Angptl4AdipoKO mice as measured by NMR after 24 weeks on diet. (mean ± SEM; n = 11–14/group). Plasma triglycerides (d), plasma non-esterified fatty acids (e), blood glucose (f), and liver triglycerides (g) of fasted (6 h) male Angptl4fl/fl and Angptl4AdipoKO mice after 6 months on diet (mean ± SEM; n = 8–9/group). ##p < 0.01, ###p < 0.001 for dietary differences by two-way ANOVA. *p < 0.05,***p < 0.001 for individual genotype-specific differences by multiple comparison after two-way ANOVA (Tukey correction).
Figure 5 Body weights, fat mass, and metabolic phenotypes of Angptl4fl/fl and Angptl4AdipoKO mice after chronic high-fat feeding. (a) Weekly body weights of male Angptl4fl/fl and Angptl4AdipoKO mice fed either a normal chow diet (NCD) or high fat diet (HFD) for 6 months starting at 8 weeks of age (mean ± SEM; n = 10–17/group). *p < 0.05 by repeated measures ANOVA. (b) Tissues weights of heart, liver, kidney, quadriceps muscle (quad), epididymal white adipose (eWAT), subcutaneous white adipose tissue (sWAT), and brown adipose tissue (BAT) in male Angptl4fl/fl and Angptl4AdipoKO mice after 6 months on diet (mean ± SEM; n = 8–13/group). (c) Lean muscle mass and fat mass of male Angptl4fl/fl and Angptl4AdipoKO mice as measured by NMR after 24 weeks on diet. (mean ± SEM; n = 11–14/group). Plasma triglycerides (d), plasma non-esterified fatty acids (e), blood glucose (f), and liver triglycerides (g) of fasted (6 h) male Angptl4fl/fl and Angptl4AdipoKO mice after 6 months on diet (mean ± SEM; n = 8–9/group). ##p < 0.01, ###p < 0.001 for dietary differences by two-way ANOVA. *p < 0.05,***p < 0.001 for individual genotype-specific differences by multiple comparison after two-way ANOVA (Tukey correction).CC BY · PubMed Central
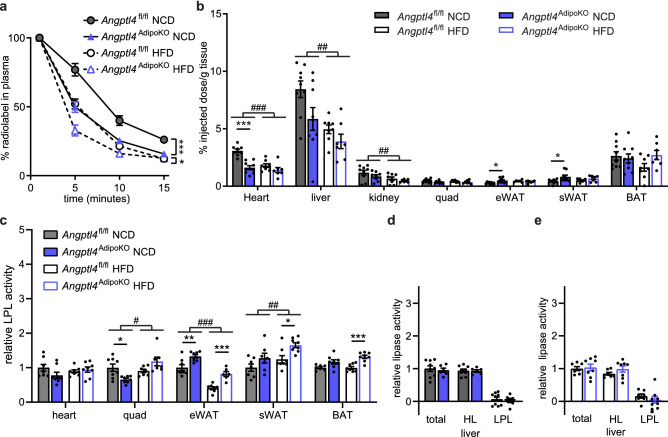
Figure 6 Chylomicron clearance and uptake and lipase activity in Angptl4AdipoKO mice after chronic high-fat feeding. At the conclusion of 6 months of either normal chow diet (NCD) or high fat diet (HFD) Angptl4fl/fl and Angptl4AdipoKO male mice (n = 7–9/group) were fasted (6 h) and injected intravenously with 3H-triglyceride containing chylomicrons. (a) Clearance of radiolabel from the plasma 1, 5, 10, and 15 min after injection. Points represent percentage of radiolabel remaining in the plasma at the indicated time points compared to the 1-min time point (mean ± SEM). ***p < 0.001 by repeated measures ANOVA. (b) Uptake of radiolabel (% injected dose/g tissue) into the indicated tissues after 15 min (mean ± SEM). #p < 0.05, ##p < 0.01, ###p < 0.001 for dietary differences by two-way ANOVA. *p < 0.05, ***p < 0.001 for individual genotype-specific differences by multiple comparison after two-way ANOVA. (c) Heart, quadricep muscle (quad), epididymal adipose tissue (eWAT), subcutaneous adipose tissue (sWAT), and brown adipose (BAT) tissue from fasted (6 h) male Angptl4fl/fl and Angptl4AdipoKO mice were harvested and lipase activity was measured (n = 6–8/group). (d, e) Liver was harvested from fasted (6 h) male Angptl4fl/fl and Angptl4AdipoKO mice (d, NCD groups and e, HFD groups)(n = 6–9/group). Lipase activity was measured in the presence or absence of 1 M NaCl to distinguish between hepatic and lipoprotein lipase. Bars show relative lipase activity in each tissue normalized to Angptl4fl/fl (mean ± SEM). #p < 0.05, ##p < 0.01, ###p < 0.001 for dietary differences by two-way ANOVA. *p < 0.05, **p < 0.01 ***p < 0.001 for individual genotype-specific differences by multiple comparison after two-way ANOVA.
Figure 6 Chylomicron clearance and uptake and lipase activity in Angptl4AdipoKO mice after chronic high-fat feeding. At the conclusion of 6 months of either normal chow diet (NCD) or high fat diet (HFD) Angptl4fl/fl and Angptl4AdipoKO male mice (n = 7–9/group) were fasted (6 h) and injected intravenously with 3H-triglyceride containing chylomicrons. (a) Clearance of radiolabel from the plasma 1, 5, 10, and 15 min after injection. Points represent percentage of radiolabel remaining in the plasma at the indicated time points compared to the 1-min time point (mean ± SEM). ***p < 0.001 by repeated measures ANOVA. (b) Uptake of radiolabel (% injected dose/g tissue) into the indicated tissues after 15 min (mean ± SEM). #p < 0.05, ##p < 0.01, ###p < 0.001 for dietary differences by two-way ANOVA. *p < 0.05, ***p < 0.001 for individual genotype-specific differences by multiple comparison after two-way ANOVA. (c) Heart, quadricep muscle (quad), epididymal adipose tissue (eWAT), subcutaneous adipose tissue (sWAT), and brown adipose (BAT) tissue from fasted (6 h) male Angptl4fl/fl and Angptl4AdipoKO mice were harvested and lipase activity was measured (n = 6–8/group). (d, e) Liver was harvested from fasted (6 h) male Angptl4fl/fl and Angptl4AdipoKO mice (d, NCD groups and e, HFD groups)(n = 6–9/group). Lipase activity was measured in the presence or absence of 1 M NaCl to distinguish between hepatic and lipoprotein lipase. Bars show relative lipase activity in each tissue normalized to Angptl4fl/fl (mean ± SEM). #p < 0.05, ##p < 0.01, ###p < 0.001 for dietary differences by two-way ANOVA. *p < 0.05, **p < 0.01 ***p < 0.001 for individual genotype-specific differences by multiple comparison after two-way ANOVA.CC BY · PubMed Central
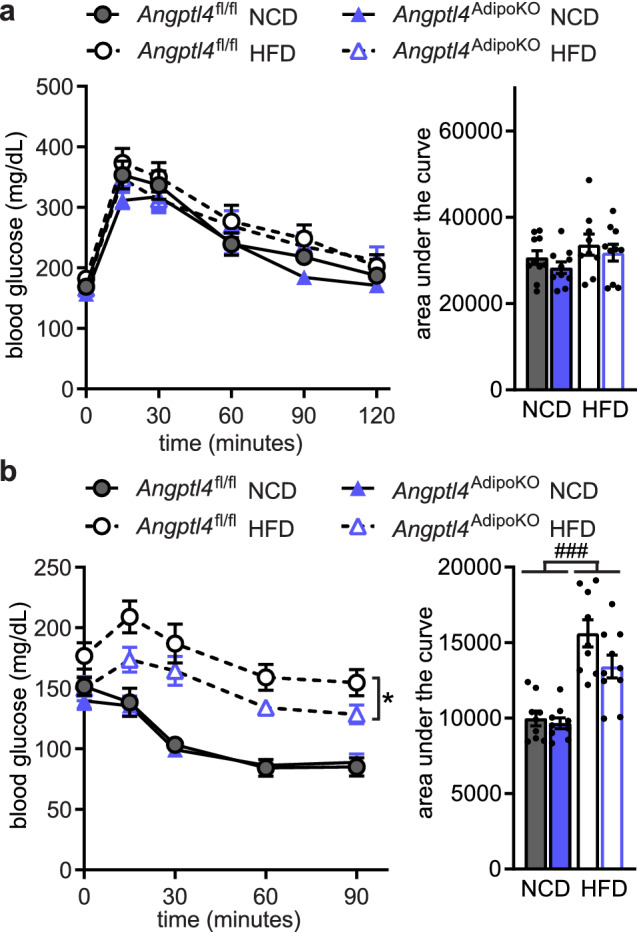
Figure 7 Glucose tolerance and insulin sensitivity of Angptl4AdipoKO mice after chronic high fat feeding. (a) Glucose tolerance tests were performed on fasted (6 h) male Angptl4fl/fl and Angptl4AdipoKO mice after 24 weeks of either a normal chow diet (NCD) or high fat diet (HFD). Blood glucose concentrations were measured over 2 h after injection with glucose. Points represent glucose levels (mean ± SEM; n = 9–10) at each respective time point. Bar graphs represent area under the curve (mean ± SEM) for all time points. (b) Insulin tolerance tests were performed on fasted (4 h) male Angptl4fl/fl and Angptl4AdipoKO mice after 25 weeks of either a normal chow diet (NCD) or high fat diet (HFD). Blood glucose concentrations were measured over 90 min after injection with insulin. Points represent glucose levels (mean ± SEM; n = 9–10) at each respective time point. *p < 0.05 by repeated measures ANOVA. Bar graphs represent area under the curve (mean ± SEM) for all time points. ###p < 0.001 for dietary differences by two-way ANOVA.
Figure 7 Glucose tolerance and insulin sensitivity of Angptl4AdipoKO mice after chronic high fat feeding. (a) Glucose tolerance tests were performed on fasted (6 h) male Angptl4fl/fl and Angptl4AdipoKO mice after 24 weeks of either a normal chow diet (NCD) or high fat diet (HFD). Blood glucose concentrations were measured over 2 h after injection with glucose. Points represent glucose levels (mean ± SEM; n = 9–10) at each respective time point. Bar graphs represent area under the curve (mean ± SEM) for all time points. (b) Insulin tolerance tests were performed on fasted (4 h) male Angptl4fl/fl and Angptl4AdipoKO mice after 25 weeks of either a normal chow diet (NCD) or high fat diet (HFD). Blood glucose concentrations were measured over 90 min after injection with insulin. Points represent glucose levels (mean ± SEM; n = 9–10) at each respective time point. *p < 0.05 by repeated measures ANOVA. Bar graphs represent area under the curve (mean ± SEM) for all time points. ###p < 0.001 for dietary differences by two-way ANOVA.CC BY · PubMed Central

Verification

Claims the paper makes

The claims and statistics of this paper haven’t been checked yet.

Run the check — free, no account needed. It reads the open-access text and checks the sources it cites.

A few free checks a day · papers already verified open instantly · results are public

Claims other papers make about this one

Each is checked against this paper’s own text: does it say what the citing paper says it does?

Self-check

Percentages, sums and reported differences re-computed from the paper’s own numbers.

The self-check needs the paper’s full text.

Citations

Cites

Research works printed but not linked: 28

  1. Ge, H. et al. Differential regulation and properties of angiopoietin-like proteins 3 and 4. J. Lipid Res. 46, 1484–1490 (2005). · DOI · Paper page
  2. Kersten, S. et al. Characterization of the fasting-induced adipose factor FIAF, a novel peroxisome proliferator-activated receptor target gene. J. Biol. Chem. 275, 28488–28493 (2000). · DOI · Paper page
  3. Yoshida, K., Shimizugawa, T., Ono, M. & Furukawa, H. Angiopoietin-like protein 4 is a potent hyperlipidemia-inducing factor in mice and inhibitor of lipoprotein lipase. J. Lipid Res. 43, 1770–1772 (2002). · DOI · Paper page
  4. Dijk, W. et al. Angiopoietin-like 4 promotes intracellular degradation of lipoprotein lipase in adipocytes. J. Lipid Res. 57, 1670–1683 (2016). · DOI · Paper page
  5. Lotta, L. A. et al. Association of genetically enhanced lipoprotein lipase-mediated lipolysis and low-density lipoprotein cholesterol-lowering alleles with risk of coronary disease and type 2 diabetes. JAMA Cardiol. 3, 957–966 (2018). · DOI · Paper page
  6. Bailetti, D. et al. ANGPTL4 gene E40K variation protects against obesity-associated dyslipidemia in participants with obesity. Obes. Sci. Pract. 5, 83–90 (2019). · DOI
  7. Bergö, M., Wu, G., Ruge, T. & Olivecrona, T. Down-regulation of adipose tissue lipoprotein lipase during fasting requires that a gene, separate from the lipase gene, is switched on. J. Biol. Chem. 277, 11927–11932 (2002). · DOI · Paper page
  8. Sukonina, V., Lookene, A., Olivecrona, T. & Olivecrona, G. Angiopoietin-like protein 4 converts lipoprotein lipase to inactive monomers and modulates lipase activity in adipose tissue. Proc. Natl. Acad. Sci. USA 103, 17450–17455 (2006). · DOI · Paper page
  9. Kroupa, O. et al. Linking nutritional regulation of Angptl4, Gpihbp1, and Lmf1 to lipoprotein lipase activity in rodent adipose tissue. BMC Physiol. 12, 13 (2012). · DOI · Paper page
  10. Aryal, B. et al. Absence of ANGPTL4 in adipose tissue improves glucose tolerance and attenuates atherogenesis. JCI Insight. 3, e97918 (2018). · DOI · Paper page
  11. Lichtenstein, L. et al. Angptl4 protects against severe proinflammatory effects of saturated fat by inhibiting fatty acid uptake into mesenteric lymph node macrophages. Cell Metab. 12, 580–592 (2010). · DOI · Paper page
  12. Oteng, A.-B. et al. Characterization of ANGPTL4 function in macrophages and adipocytes using Angptl4-knockout and Angptl4-hypomorphic mice. J. Lipid Res. 60, 1741–1754 (2019). · DOI · Paper page
  13. Singh, A. K. et al. Brown adipose tissue derived ANGPTL4 controls glucose and lipid metabolism and regulates thermogenesis. Mol. Metab. 11, 59–69 (2018). · DOI · Paper page
  14. Lee, E.-C. et al. Identification of a new functional domain in angiopoietin-like 3 (ANGPTL3) and angiopoietin-like 4 (ANGPTL4) involved in binding and inhibition of lipoprotein lipase (LPL). J. Biol. Chem. 284, 13735–13745 (2009). · DOI · Paper page
  15. Xu, H. et al. Chronic inflammation in fat plays a crucial role in the development of obesity-related insulin resistance. J. Clin. Invest. 112, 1821–1830 (2003). · DOI · Paper page
  16. Yoon, J. C. et al. Peroxisome proliferator-activated receptor γ target gene encoding a novel angiopoietin-related protein associated with adipose differentiation. Mol. Cell. Biol. 20, 5343–5349 (2000). · DOI · Paper page
  17. Desai, U. et al. Lipid-lowering effects of anti-angiopoietin-like 4 antibody recapitulate the lipid phenotype found in angiopoietin-like 4 knockout mice. Proc. Natl. Acad. Sci. USA 104, 11766–11771 (2007). · DOI · Paper page
  18. Gusarova, V. et al. Genetic inactivation of ANGPTL4 improves glucose homeostasis and is associated with reduced risk of diabetes. Nat. Commun. 9, 2252 (2018). · DOI · Paper page
  19. Romeo, S. et al. Rare loss-of-function mutations in ANGPTL family members contribute to plasma triglyceride levels in humans. J. Clin. Invest. 119, 70–79 (2009).
  20. Chang, H. et al. Role of Angptl4/Fiaf in exercise-induced skeletal muscle AMPK activation. J. Appl. Physiol. 125, 715–722 (2018). · DOI
  21. Yu, X. et al. Inhibition of cardiac lipoprotein utilization by transgenic overexpression of Angptl4 in the heart. PNAS 102, 1767–1772 (2005). · DOI · Paper page
  22. Pinkert, C. A. Transgenic Animal Technology: A Laboratory Handbook 2nd edn. (Academic Press, 2002).
  23. Eguchi, J. et al. Transcriptional control of adipose lipid handling by IRF4. Cell Metab. 13, 249–259 (2011). · DOI
  24. Beigneux, A. P. et al. Highly conserved cysteines within the Ly6 domain of GPIHBP1 are crucial for the binding of lipoprotein lipase. J. Biol. Chem. 284, 30240–30247 (2009). · DOI
  25. Chi, X. et al. Angiopoietin-like 4 modifies the interactions between lipoprotein lipase and its endothelial cell transporter GPIHBP1. J. Biol. Chem. 290, 11865–11877 (2015). · DOI · Paper page
  26. Schmittgen, T. D. & Livak, K. J. Analyzing real-time PCR data by the comparative C T method. Nat. Protoc. 3, 1101–1108 (2008). · DOI · Paper page
  27. Folch, J., Lees, M. & Stanley, G. H. S. A simple method for the isolation and purification of total lipides from animal tissues. J. Biol. Chem. 226, 497–509 (1957). · DOI · Paper page
  28. Basu, D., Manjur, J. & Jin, W. Determination of lipoprotein lipase activity using a novel fluorescent lipase assay. J. Lipid Res. 52, 826–832 (2011). · DOI

Cited by

Sorted by citations

See all 42

Metadata

Authors
Spitler, K. M., Shetty, S. K., Cushing, E. M., Sylvers-Davie, K. L., & Davies, B. S. J.
Venue
Scientific Reports
Published
2021-04-12
Volume
11
Issue
1
ISSN
2045-2322
Cited by
42
References
8
Language
en
Funders
NIH (R01HL130146)

About these checks

Registry, retraction, Cites and statistics results are computed, not judged, with one exception: a printed reference that no index lists is read once by a model before it counts as a citation error. Claims are extracted by a model and kept only when their quote appears verbatim in the text; each cited source is then checked, with a model’s help, for whether it says what the claim relies on. Those verdicts can be wrong — read the claim’s quote and the cited source before relying on one.

Statistics and arithmetic are recomputed, not judged.

Confidence bands are shown only for fields calibrated on our annotated test set. None is calibrated yet, so no band is shown.

What counts as a claim ›How we measure confidence ›How we check this ›

Are you an author, or do you see a problem with this page? Request a review