

The DOI matches its Crossref record; 61 of the 61 references it cites were found in a registry or an index.
AlphaFold2 reveals commonalities and novelties in protein structure space for 21 model organisms
Open accessPublished version of a preprint
Abstract
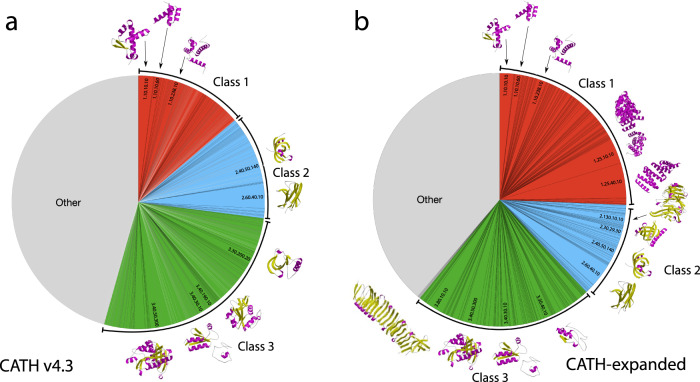
Abstract Deep-learning (DL) methods like DeepMind’s AlphaFold2 (AF2) have led to substantial improvements in protein structure prediction. We analyse confident AF2 models from 21 model organisms using a new classification protocol (CATH-Assign) which exploits novel DL methods for structural comparison and classification. Of ~370,000 confident models, 92% can be assigned to 3253 superfamilies in our CATH domain superfamily classification. The remaining cluster into 2367 putative novel superfamilies. Detailed manual analysis on 618 of these, having at least one human relative, reveal extremely remote homologies and further unusual features. Only 25 novel superfamilies could be confirmed. Although most models map to existing superfamilies, AF2 domains expand CATH by 67% and increases the number of unique ‘global’ folds by 36% and will provide valuable insights on structure function relationships. CATH-Assign will harness the huge expansion in structural data provided by DeepMind to rationalise evolutionary changes driving functional divergence.
Overview
The claims and statistics of this paper haven’t been checked yet.
Run the check — free, no account needed. It reads the open-access text and checks the sources it cites.
Integrity signals
Registry
Cites
Statistics
Figures
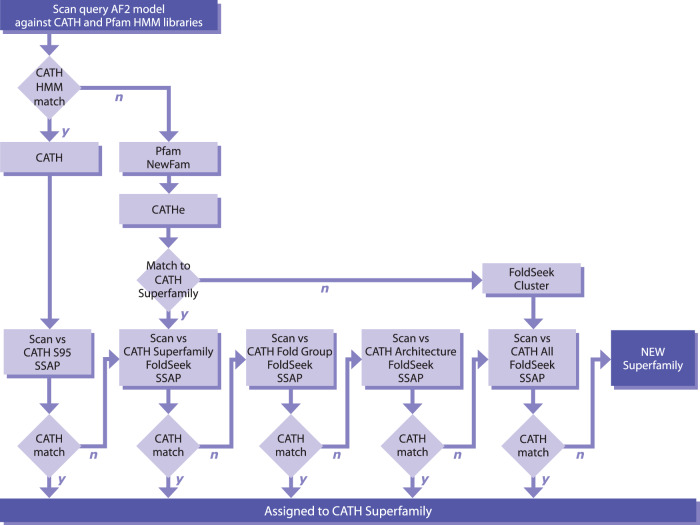
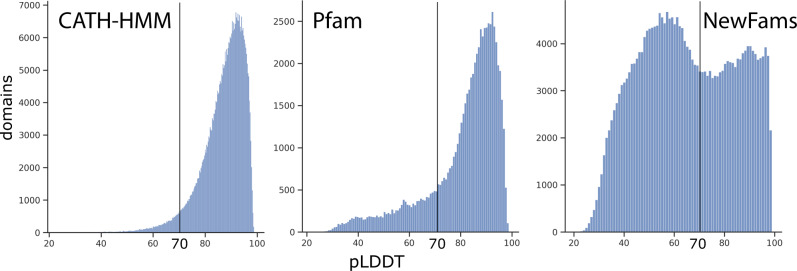
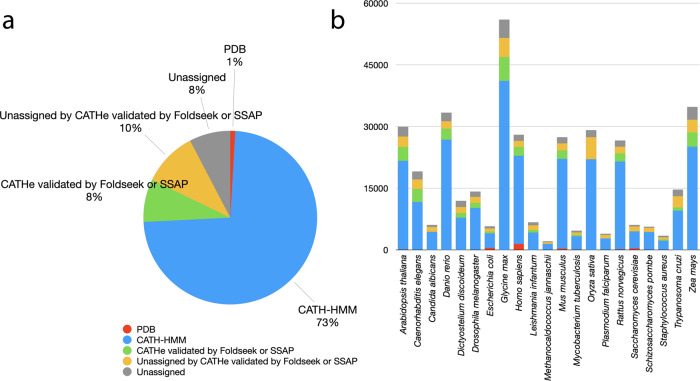
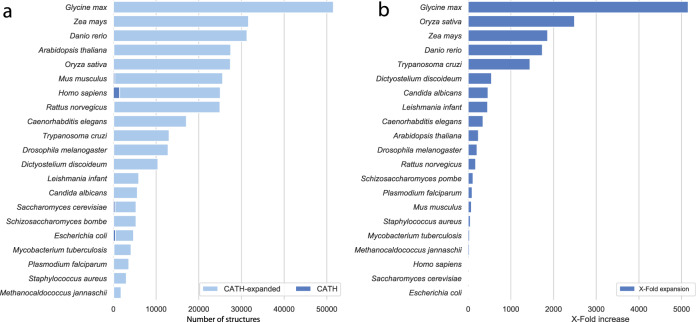
Verification
Claims the paper makes
The claims and statistics of this paper haven’t been checked yet.
Run the check — free, no account needed. It reads the open-access text and checks the sources it cites.
Claims other papers make about this one
Each is checked against this paper’s own text: does it say what the citing paper says it does?
The source backs part of the claim, not all of it — or backs it for a different population, condition or comparison.
In the citing paper
“As a result, numerous areas within the life sciences have experienced considerable impact due to the availability of accurately predicted protein structures. The primary domains notably affected include structure determination, structure-based drug discovery, and structural bioinformatics (11–13).”
From AlphaFold Protein Structure Database in 2024: providing structure coverage for over 214 million protein sequences (2024) · cites this paper as [11]
Experimental — accuracy not yet measured
Self-check
Percentages, sums and reported differences re-computed from the paper’s own numbers.
The self-check needs the paper’s full text.
Citations
Cites
UCSF Chimera—A visualization system for exploratory research and analysis
Pettersen, E. F., Goddard, T. D., Huang, C. C., Couch, G. S., Greenblatt, D. M., Meng, E. C., & Ferrin, T. E. (2004) · Journal of Computational Chemistry · doi:10.1002/jcc.20084 · Cited by 46,047
Highly accurate protein structure prediction with AlphaFold
Jumper, J., Evans, R., Pritzel, A., Green, T., Figurnov, M., Ronneberger, O., Tunyasuvunakool, K., Bates, R., Žídek, A., Potapenko, A., et al. (2021) · Nature · doi:10.1038/s41586-021-03819-2 · Cited by 43,764
Self-citationKabsch, W., & Sander, C. (1983) · Biopolymers · doi:10.1002/bip.360221211 · Cited by 15,320
Szklarczyk, D., Gable, A. L., Nastou, K. C., Lyon, D., Kirsch, R., Pyysalo, S., Doncheva, N. T., Legeay, M., Fang, T., Bork, P., et al. (2021) · Nucleic Acids Research · doi:10.1093/nar/gkaa1074 · Cited by 8,056
Varadi, M., Anyango, S., Deshpande, M., Nair, S., Natassia, C., Yordanova, G., Yuan, D., Stroe, O., Wood, G., Laydon, A., et al. (2022) · Nucleic Acids Research · doi:10.1093/nar/gkab1061 · Cited by 7,850
Self-citationMurzin, A. G., Brenner, S. E., Hubbard, T., & Chothia, C. (1995) · Journal of Molecular Biology · doi:10.1016/s0022-2836(05)80134-2 · Cited by 6,445
Biopython: freely available python tools for computational molecular biology and bioinformatics
Cock, P. J. A., Antao, T., Chang, J. T., Chapman, B. A., Cox, C. J., Dalke, A., Friedberg, I., Hamelryck, T., Kauff, F., Wilczynski, B., et al. (2009) · Bioinformatics · doi:10.1093/bioinformatics/btp163 · Cited by 6,080
Accurate prediction of protein structures and interactions using a 3-track network
Baek, M., DiMaio, F., Anishchenko, I., Dauparas, J., Ovchinnikov, S., Lee, G. R., Wang, J., Cong, Q., Kinch, L. N., Schaeffer, R. D., et al. (2021) · doi:10.1101/2021.06.14.448402 · Cited by 5,549
Protein complex prediction with AlphaFold-Multimer
Evans, R., O’Neill, M., Pritzel, A., Antropova, N., Senior, A., Green, T., Žídek, A., Bates, R., Blackwell, S., Yim, J., et al. (2021) · doi:10.1101/2021.10.04.463034 · Cited by 3,808
TM-align: a protein structure alignment algorithm based on the TM-score
Zhang, Y. (2005) · Nucleic Acids Research · doi:10.1093/nar/gki524 · Cited by 3,774
CATH – a hierarchic classification of protein domain structures
Orengo, C., Michie, A. D., Jones, S., Jones, D., Swindells, M. B., & Thornton, J. M. (1997) · Structure · doi:10.1016/s0969-2126(97)00260-8 · Cited by 2,658
Self-citationFast and accurate protein structure search with Foldseek
van Kempen, M., Kim, S. S., Tumescheit, C., Mirdita, M., Lee, J., Gilchrist, C. L. M., Söding, J., & Steinegger, M. (2022) · doi:10.1101/2022.02.07.479398 · Cited by 2,598
Self-citationFast and accurate protein structure search with Foldseek
van Kempen, M., Kim, S. S., Tumescheit, C., Mirdita, M., Lee, J., Gilchrist, C. L. M., Söding, J., & Steinegger, M. (2024) · Nature Biotechnology · doi:10.1038/s41587-023-01773-0 · Cited by 2,596
Self-citationThe relation between the divergence of sequence and structure in proteins.
Chothia, C., & Lesk, A. M. (1986) · The EMBO Journal · doi:10.1002/j.1460-2075.1986.tb04288.x · Cited by 2,458
ProtTrans: Toward Understanding the Language of Life Through Self-Supervised Learning
Elnaggar, A., Heinzinger, M., Dallago, C., Rehawi, G., Wang, Y., Jones, L., Gibbs, T., Feher, T., Angerer, C., Steinegger, M., et al. (2022) · IEEE Transactions on Pattern Analysis and Machine Intelligence · doi:10.1109/tpami.2021.3095381 · Cited by 2,329 · cited 3×
“To determine whether these domains were distant homologues of CATH superfamilies, we used a recently established protein Language Model (pLM, Prot-T5 (24)) to generate protein sequence embeddings of the domains.”
MethodInfluentialSelf-citationUniRef clusters: a comprehensive and scalable alternative for improving sequence similarity searches
Suzek, B. E., Wang, Y., Huang, H., McGarvey, P. B., Wu, C. H., & the UniProt Consortium (2015) · Bioinformatics · doi:10.1093/bioinformatics/btu739 · Cited by 1,928
Valdar, W. S. J. (2002) · Proteins Structure Function and Bioinformatics · doi:10.1002/prot.10146 · Cited by 633
Protein structure prediction from sequence variation
Marks, D. S., Hopf, T. A., & Sander, C. (2012) · Nature Biotechnology · doi:10.1038/nbt.2419 · Cited by 622
Modern hierarchical, agglomerative clustering algorithms
Müllner, D. (2011) · arXiv · doi:10.48550/arxiv.1109.2378 · Cited by 529
CATH: increased structural coverage of functional space
Sillitoe, I., Bordin, N., Dawson, N., Waman, V. P., Ashford, P., Scholes, H. M., Pang, C. S. M., Woodridge, L., Rauer, C., Sen, N., et al. (2021) · Nucleic Acids Research · doi:10.1093/nar/gkaa1079 · Cited by 509
Self-citationCritical assessment of methods of protein structure prediction (CASP)—Round XIV
Kryshtafovych, A., Schwede, T., Topf, M., Fidelis, K., & Moult, J. (2021) · Proteins: Structure, Function, and Bioinformatics · doi:10.1002/prot.26237 · Cited by 503
ECOD: an evolutionary classification of protein domains
Cheng, H., Schaeffer, R. D., Liao, Y., Kinch, L. N., Pei, J., Shi, S., Kim, B.-H., & Grishin, N. V. (2014) · PLoS Computational Biology · doi:10.1371/journal.pcbi.1003926 · Cited by 426
ProtTrans: Towards Cracking the Language of Life’s Code Through Self-Supervised LearningPreprint
Elnaggar, A., Heinzinger, M., Dallago, C., Rehawi, G., Wang, Y., Jones, L., Gibbs, T., Feher, T., Angerer, C., Steinegger, M., et al. (2020) · bioRxiv (Cold Spring Harbor Laboratory) · doi:10.1101/2020.07.12.199554 · Cited by 424
Self-citationDistance-based protein folding powered by deep learning
Xu, J. (2019) · Proceedings of the National Academy of Sciences · doi:10.1073/pnas.1821309116 · Cited by 401
[36] SSAP: Sequential structure alignment program for protein structure comparison
Orengo, C. A., & Taylor, W. R. (1996) · Methods in enzymology on CD-ROM/Methods in enzymology · doi:10.1016/s0076-6879(96)66038-8 · Cited by 337
Self-citationSCOP2 prototype: a new approach to protein structure mining
Andreeva, A. E., Howorth, D., Chothia, C., Kulesha, E., & Murzin, A. G. (2013) · Nucleic Acids Research · doi:10.1093/nar/gkt1242 · Cited by 336
Using deep learning to annotate the protein universe
Bileschi, M. L., Belanger, D., Bryant, D. H., Sanderson, T., Carter, B., Sculley, D., Bateman, A., DePristo, M. A., & Colwell, L. J. (2022) · Nature Biotechnology · doi:10.1038/s41587-021-01179-w · Cited by 332 · cited 1×
“…AF2, such as our CATHe predictor, that exploit language models to capture information about the structural contexts of residues, have become widespread and are being applied in the field of protein family classification as they are more powerful and faster than HMM based approaches (24,25,37–39).”
MethodSillitoe, I., Cuff, A. L., Dessailly, B. H., Dawson, N. L., Furnham, N., Lee, D., Lees, J. G., Lewis, T. E., Studer, R. A., Rentzsch, R., et al. (2012) · Nucleic Acids Research · doi:10.1093/nar/gks1211 · Cited by 210
Self-citationGene3D: Extensive prediction of globular domains in proteins
Lewis, T. E., Sillitoe, I., Dawson, N., Lam, S., Clarke, T., Lee, D. A., Orengo, C., & Lees, J. (2017) · Nucleic Acids Res. · doi:10.1093/nar/gkx1069 · Cited by 195
Self-citationChandonia, J., Guan, L., Lin, S., Yu, C., Fox, N. K., & Brenner, S. E. (2021) · Nucleic Acids Research · doi:10.1093/nar/gkab1054 · Cited by 182
Greener, J. G., Kandathil, S. M., & Jones, D. T. (2019) · Nature Communications · doi:10.1038/s41467-019-11994-0 · Cited by 178
The impact of AlphaFold2 one year on
Jones, D. T., & Thornton, J. M. (2022) · Nature Methods · doi:10.1038/s41592-021-01365-3 · Cited by 156
pdb-tools: a swiss army knife for molecular structures
Rodrigues, J., Teixeira, J. M. C., Trellet, M., & Bonvin, A. (2018) · bioRxiv · doi:10.12688/f1000research.17456.1 · Cited by 154
Das, S., Lee, D., Sillitoe, I., Dawson, N. L., Lees, J., & Orengo, C. A. (2015) · Bioinformatics · doi:10.1093/bioinformatics/btv398 · Cited by 150
Self-citationAdvances in structural genomics
Teichmann, S. A., Chothia, C., & Gerstein, M. (1999) · Current Opinion in Structural Biology · doi:10.1016/s0959-440x(99)80053-0 · Cited by 136
The structural coverage of the human proteome before and after AlphaFold
Porta-Pardo, E., Ruiz-Serra, V., Valentini, S., & Valencia, A. (2022) · PLOS Computational Biology · doi:10.1371/journal.pcbi.1009818 · Cited by 131
Assembling multidomain protein structures through analogous global structural alignments
Zhou, X., Hu, J. S., Zhang, C., Zhang, G., & Zhang, Y. (2019) · Proceedings of the National Academy of Sciences · doi:10.1073/pnas.1905068116 · Cited by 111
Contrastive learning on protein embeddings enlightens midnight zone
Heinzinger, M., Littmann, M., Sillitoe, I., Bordin, N., Orengo, C., & Rost, B. (2021) · doi:10.1101/2021.11.14.468528 · Cited by 105
Self-citationContrastive learning on protein embeddings enlightens midnight zone
(2022) · doi:10.1093/nargab/lqac043 · Cited by 105
Self-citationUsing Deep Learning to Annotate the Protein UniversePreprint
Bileschi, M. L., Belanger, D., Bryant, D., et al. (2019) · bioRxiv (Cold Spring Harbor Laboratory) · doi:10.1101/626507 · Cited by 81
Хафизов, К. Ф., Madrid-Aliste, C. J., Almo, S. C., & Fiser, A. (2014) · Proceedings of the National Academy of Sciences · doi:10.1073/pnas.1321614111 · Cited by 78
Progressive assembly of multi-domain protein structures from cryo-EM density maps
Zhou, X., Li, Y., Zhang, C., Zheng, W., Zhang, G., & Zhang, Y. (2022) · Nature Computational Science · doi:10.1038/s43588-022-00232-1 · Cited by 75
Mitoribosomal small subunit biogenesis in trypanosomes involves an extensive assembly machinery
Saurer, M., Ramrath, D. J. F., Niemann, M., Calderaro, S., Prange, C. J., Mattei, S., Scaiola, A., Leitner, A., Bieri, P., Horn, E. K., et al. (2019) · Science · doi:10.1126/science.aaw5570 · Cited by 72
Method of the Year: protein structure prediction
Marx, V. (2022) · Nature Methods · doi:10.1038/s41592-021-01359-1 · Cited by 66
Protein Structural Bioinformatics: An Overview
Gromiha, M. M., Raju, N., & Selvaraj, S. (2018) · Elsevier eBooks · doi:10.1016/b978-0-12-809633-8.20278-1 · Cited by 61
Lam, S. D., Das, S., Sillitoe, I., & Orengo, C. A. (2017) · Acta Crystallographica Section D Structural Biology · doi:10.1107/s2059798317008920 · Cited by 59
Self-citationcath-resolve-hits: a new tool that resolves domain matches suspiciously quickly
Lewis, T. E., Sillitoe, I., & Lees, J. G. (2018) · Bioinformatics · doi:10.1093/bioinformatics/bty863 · Cited by 57
Self-citationGene3D: merging structure and function for a Thousand genomes
Lees, J. G., Yeats, C., Redfern, O., Clegg, A. B., & Orengo, C. A. (2009) · Nucleic Acids Research · doi:10.1093/nar/gkp987 · Cited by 56
Self-citationGene3D: Multi-domain annotations for protein sequence and comparative genome analysis
Lees, J., Lee, D., Studer, R. A., Dawson, N. L., Sillitoe, I., Das, S., Yeats, C., Dessailly, B. H., Rentzsch, R., & Orengo, C. A. (2013) · Nucleic Acids Research · doi:10.1093/nar/gkt1205 · Cited by 52
Self-citationNallapareddy, V., Bordin, N., Sillitoe, I., Heinzinger, M., Littmann, M., Waman, V. P., Sen, N., Rost, B., & Orengo, C. (2023) · Bioinformatics · doi:10.1093/bioinformatics/btad029 · Cited by 47
Self-citationVaradi, M., Nair, S., Sillitoe, I., Tauriello, G., Anyango, S., Bienert, S., Borges, C., Deshpande, M., Green, T., Hassabis, D., et al. (2022) · GigaScience · doi:10.1093/gigascience/giac118 · Cited by 32
Self-citationMitoribosomal small subunit maturation involves formation of initiation-like complexes
Lenarčič, T., Niemann, M., Ramrath, D. J. F., Calderaro, S., Flügel, T., Saurer, M., Leibundgut, M., Boehringer, D., Prange, C. J., Horn, E. K., et al. (2022) · Proceedings of the National Academy of Sciences · doi:10.1073/pnas.2114710118 · Cited by 29
Clustering FunFams using sequence embeddings improves EC purity
Littmann, M., Bordin, N., Heinzinger, M., Schütze, K., Dallago, C., Orengo, C. A., & Rost, B. (2021) · Bioinformatics · doi:10.1093/bioinformatics/btab371 · Cited by 27
Self-citationCATH functional families predict functional sites in proteins
Das, S., Scholes, H. M., Sen, N., & Orengo, C. A. (2020) · Bioinformatics · doi:10.1093/bioinformatics/btaa937 · Cited by 25
Self-citationSen, N., Anishchenko, I., Bordin, N., Sillitoe, I., Velankar, S., Baker, D., & Orengo, C. (2022) · Briefings in Bioinformatics · doi:10.1093/bib/bbac187 · Cited by 25
Self-citationConDo: protein domain boundary prediction using coevolutionary information
Hong, S. H., Joo, K., & Lee, J. (2018) · Bioinformatics · doi:10.1093/bioinformatics/bty973 · Cited by 22
Progressive assembly of multi-domain protein structures from cryo-EM density maps
Xiaogen, Z., Li, Y., Zhang, C., Zheng, W., Zhang, G., & Zhang, Y. (2022) · Zenodo (CERN European Organization for Nuclear Research) · doi:10.5281/zenodo.6348467 · Cited by 5
Varadi, M., Nair, S., Sillitoe, I., Tauriello, G., Anyango, S., Bienert, S., Borges, C., Deshpande, M., Green, T., Hassabis, D., et al. (2022) · doi:10.1101/2022.08.01.501973 · Cited by 2
Self-citationDomain Family Analyses to Understand Protein Function Evolution
Reid, A. J., Addou, S., Rentzsch, R., Ranea, J. A. G., & Orengo, C. A. (2010) · Wiley eBooks · doi:10.1002/9780470570418.ch13 · Cited by 1
Self-citation
Cited by
Sorted by citations
Fast and accurate protein structure search with Foldseek
van Kempen, M., Kim, S. S., Tumescheit, C., Mirdita, M., Lee, J., Gilchrist, C. L. M., Söding, J., & Steinegger, M. (2022) · doi:10.1101/2022.02.07.479398 · Cited by 2,598
Self-citationFast and accurate protein structure search with Foldseek
van Kempen, M., Kim, S. S., Tumescheit, C., Mirdita, M., Lee, J., Gilchrist, C. L. M., Söding, J., & Steinegger, M. (2024) · Nature Biotechnology · doi:10.1038/s41587-023-01773-0 · Cited by 2,596
Self-citationVaradi, M., Bertoni, D., Magana, P., Paramval, U., Pidruchna, I., Radhakrishnan, M., Tsenkov, M., Nair, S., Mirdita, M., Yeo, J., et al. (2024) · Nucleic Acids Research · doi:10.1093/nar/gkad1011 · Cited by 2,052
Self-citationDALI shines a light on remote homologs: One hundred discoveries
Holm, L., Laiho, A., Törönen, P., & Salgado, M. G. (2022) · Protein Science · doi:10.1002/pro.4519 · Cited by 723
Clustering predicted structures at the scale of the known protein universe
Barrio-Hernandez, I., Yeo, J., Jänes, J., Mirdita, M., Gilchrist, C. L. M., Wein, T., Varadi, M., Velankar, S., Beltrao, P., & Steinegger, M. (2023) · Nature · doi:10.1038/s41586-023-06510-w · Cited by 362
Self-citation
Metadata
- Authors
- Bordin, N., Sillitoe, I., Nallapareddy, V., Rauer, C., Lam, S. D., Waman, V. P., Sen, N., Heinzinger, M., Littmann, M., Kim, S., Velankar, S., Steinegger, M., Rost, B., & Orengo, C.
- Affiliations
- Institute of Structural and Molecular Biology (GB)
- Technical University of Munich (DE)
- Seoul National University (KR)
- European Bioinformatics Institute (GB)
- Corresponding author
- Orengo, Christine
- ORCID
- Venue
- Communications Biology
- Published
- 2023-02-08
- Volume
- 6
- Issue
- 1
- Pages
- 160-160
- ISSN
- 2399-3642 (ISSN-L)
- PMC
- PMC9908985
- OpenAlex
- W4319593844
- Cited by
- 103
- References
- 57
- Citations by year
- 2026: 17 · 2025: 22 · 2024: 33 · 2023: 21
- FWCI
- 8.26
- Type
- journal article
- Language
- en
- Open access
- gold
- doi.org
- Locations
- Communications Biology (publishedVersion, cc-by)
- bioRxiv (Cold Spring Harbor Laboratory) (acceptedVersion, cc-by-nd)
- PubMed Central (publishedVersion, cc-by)
- PubMed (publishedVersion)
- UCL Discovery (University College London) (submittedVersion, cc-by)
- DOAJ (DOAJ: Directory of Open Access Journals) (submittedVersion, cc-by-sa)
- Seoul National University Open Repository (Seoul National University) (submittedVersion)
- Padua Research Archive (University of Padova) (submittedVersion, cc-by)
- Funders
- Alexander von Humboldt-Stiftung
- Wellcome Trust (BB/R014892/1, 221327/Z/20/Z, 221327, BB/T002735/1)
- European Molecular Biology Laboratory
- DeepMind
- National Research Foundation (2019R1A6A1A10073437, 2021-R1C1-C102065)
- Deutsche Forschungsgemeinschaft (DFG-GZ: RO1320/4-1, RO1320/4‐1)
- Bundesministerium für Bildung und Forschung (01IS17049)
- Seoul National University
- National Research Foundation of Korea (2021-R1C1-C102065, 2021-M3A9-I4021220, 2020M3‐A9G7‐103933, 2019R1-A6A1-A10073437)
- Biotechnology and Biological Sciences Research Council (BB/R014892/1, BB/R009597/1, BB/V014722/1, BB/S020039/1, BB/T002735/1, 221327/Z/20/Z, BB/S020144/1)
- Topics
- Life Sciences › Biochemistry, Genetics and Molecular Biology › Molecular Biology › Protein Structure and Dynamics
- Life Sciences › Biochemistry, Genetics and Molecular Biology › Structural Biology › Enzyme Structure and Function
- Life Sciences › Biochemistry, Genetics and Molecular Biology › Molecular Biology › Machine Learning in Bioinformatics
- Keywords
- AlphaFold2, protein structure prediction, model organisms, remote homology, protein fold evolution, structure-function relationship
- MeSH terms
- Furylfuramide, Humans, Proteins, Databases, Protein
About these checks
Registry, retraction, Cites and statistics results are computed, not judged, with one exception: a printed reference that no index lists is read once by a model before it counts as a citation error. Claims are extracted by a model and kept only when their quote appears verbatim in the text; each cited source is then checked, with a model’s help, for whether it says what the claim relies on. Those verdicts can be wrong — read the claim’s quote and the cited source before relying on one.
Statistics and arithmetic are recomputed, not judged.
Confidence bands are shown only for fields calibrated on our annotated test set. None is calibrated yet, so no band is shown.
What counts as a claim ›How we measure confidence ›How we check this ›
Are you an author, or do you see a problem with this page? Request a review
