Cited by 125interferon and immune responsesCancer Immunotherapy and BiomarkersChromatin Remodeling and Cancer

The DOI matches its Crossref record; 84 of the 84 references it cites were found in a registry or an index.

MACHETE identifies interferon-encompassing chromosome 9p21.3 deletions as mediators of immune evasion and metastasis

Open access
Barriga, Francisco M., Tsanov, Kaloyan M., Ho, Yu-Jui, Sohail, Noor, Zhang, Amy, Baslan, Timour, Wuest, Alexandra N., Del Priore, Isabella, Meškauskaitė, Brigita, Livshits, Geulah, Alonso-Curbelo, Direna, Simon, Janelle, Chaves-Perez, Almudena, Bar-Sagi, Dafna, Iacobuzio-Donahue, Christine A., Notta, Faiyaz, Chaligne, Ronan, Sharma, Roshan, Pe’er, Dana, Lowe, Scott W.·2022·Nature Cancer

Abstract

The most prominent homozygous deletions in cancer affect chromosome 9p21.3 and eliminate CDKN2A/B tumor suppressors, disabling a cell-intrinsic barrier to tumorigenesis. Half of 9p21.3 deletions, however, also encompass a type I interferon (IFN) gene cluster; the consequences of this co-deletion remain unexplored. To functionally dissect 9p21.3 and other large genomic deletions, we developed a flexible deletion engineering strategy, MACHETE (molecular alteration of chromosomes with engineered tandem elements). Applying MACHETE to a syngeneic mouse model of pancreatic cancer, we found that co-deletion of the IFN cluster promoted immune evasion, metastasis and immunotherapy resistance. Mechanistically, IFN co-deletion disrupted type I IFN signaling in the tumor microenvironment, leading to marked changes in infiltrating immune cells and escape from CD8+ T-cell surveillance, effects largely driven by the poorly understood interferon epsilon. These results reveal a chromosomal deletion that disables both cell-intrinsic and cell-extrinsic tumor suppression and provide a framework for interrogating large deletions in cancer and beyond.

Overview

The claims and statistics of this paper haven’t been checked yet.

Run the check — free, no account needed. It reads the open-access text and checks the sources it cites.

A few free checks a day · papers already verified open instantly · results are public

Integrity signals

Registry

Crossref · 10.1038/s43018-022-00443-5

Cites

84 of 84 references verified0 citation errors · 0 not checkable

Statistics

Figures

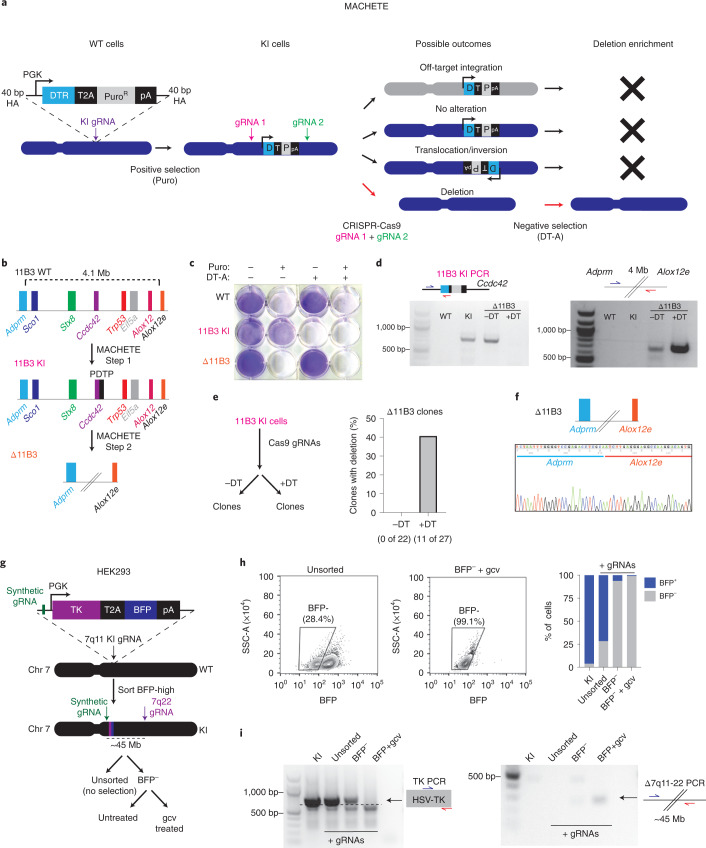
Fig. 1 MACHETE enables efficient engineering of genomic deletions. a, Schematic of the MACHETE approach. WT, wild type; HA, homology arm; Puro, puromycin; pA, polyadenylation signal. b, Schematic of MACHETE-mediated engineering of a 4.1-Mb deletion at the 11B3 locus. c, Crystal violet stain of WT, 11B3 KI and Δ11B3 NIH3T3 cells after selection with Puro at 2 μg ml−1 and/or DT-A at 50 ng ml−1. d, PCR genotyping for the 11B3 KI and Δ11B3 alleles in the indicated NIH3T3 cell lines. e, Experimental outline for testing the impact of DT-mediated negative selection on the efficiency of Δ11B3 deletion engineering in NIH3T3 cells (left). Clonal analysis of NIH3T3 cells engineered without (−DT) and with (+DT) DT selection (right). f, Sanger sequencing of the 11B3 deletion breakpoint confirming the expected deletion. g, Schematic of MACHETE-mediated engineering of a 45-Mb deletion at the 7q11-22 locus in HEK293 cells. gcv, ganciclovir. h, Flow cytometry plots and quantification of BFP+ and BFP− HEK293 cells under the indicated conditions. i, PCR genotyping for the 7q11 KI and Δ7q11-22 alleles in HEK293 cells under the indicated conditions. Source data
Fig. 1 MACHETE enables efficient engineering of genomic deletions. a, Schematic of the MACHETE approach. WT, wild type; HA, homology arm; Puro, puromycin; pA, polyadenylation signal. b, Schematic of MACHETE-mediated engineering of a 4.1-Mb deletion at the 11B3 locus. c, Crystal violet stain of WT, 11B3 KI and Δ11B3 NIH3T3 cells after selection with Puro at 2 μg ml−1 and/or DT-A at 50 ng ml−1. d, PCR genotyping for the 11B3 KI and Δ11B3 alleles in the indicated NIH3T3 cell lines. e, Experimental outline for testing the impact of DT-mediated negative selection on the efficiency of Δ11B3 deletion engineering in NIH3T3 cells (left). Clonal analysis of NIH3T3 cells engineered without (−DT) and with (+DT) DT selection (right). f, Sanger sequencing of the 11B3 deletion breakpoint confirming the expected deletion. g, Schematic of MACHETE-mediated engineering of a 45-Mb deletion at the 7q11-22 locus in HEK293 cells. gcv, ganciclovir. h, Flow cytometry plots and quantification of BFP+ and BFP− HEK293 cells under the indicated conditions. i, PCR genotyping for the 7q11 KI and Δ7q11-22 alleles in HEK293 cells under the indicated conditions. Source dataCC BY · PubMed Central
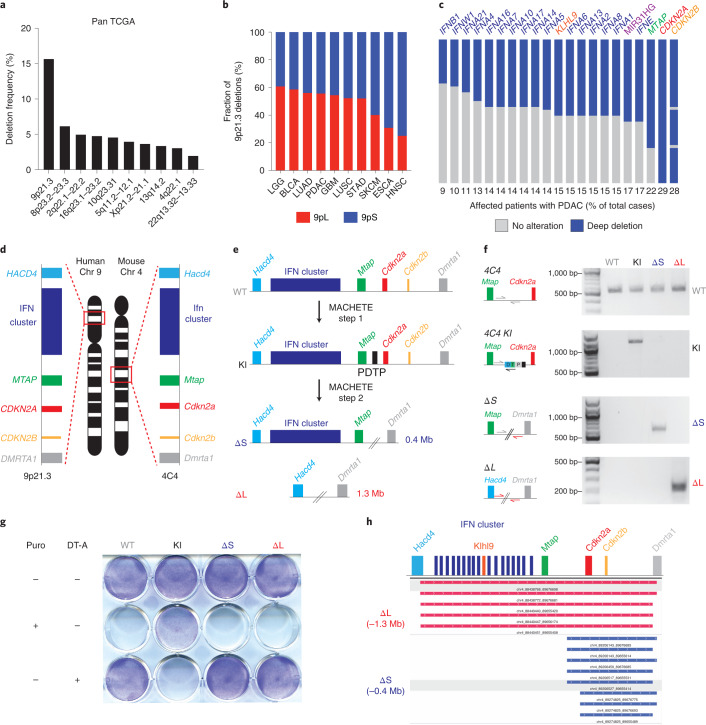
Fig. 2 9p21.3 deletions encompass a cluster of type I IFNs. a, Frequency of homozygous deletions across the pan-cancer TCGA dataset. b, Relative frequency of deletions at the 9p21.3 locus classified as 9pS and 9pL across different cancer types. c, Frequency of deep deletion of 9p21.3 genes in patients with PDAC. d, Schematic of the synteny between the human 9p21.3 and mouse 4C4 locus. e, Schematic of MACHETE-mediated engineering of 4C4 ΔS and ΔL deletions. f, PCR genotyping for the WT, KI, ΔS and ΔL alleles in the indicated PDEC cell lines. g, Pattern of resistance/sensitivity to positive and negative selection in PDEC sgP53 EL parental, 4C4 KI, ΔS and ΔL cells. Cells were seeded and treated with puromycin (2 μg ml−1) or DT-A (50 ng ml−1) for 72 h and then stained with crystal violet to assess surviving cells. h, DNA sequencing of breakpoints from ΔS and ΔL cells confirming loss of the expected genomic regions (0.4 Mb deletion in ΔS and 1.3 Mb deletion in ΔL). Source data
Fig. 2 9p21.3 deletions encompass a cluster of type I IFNs. a, Frequency of homozygous deletions across the pan-cancer TCGA dataset. b, Relative frequency of deletions at the 9p21.3 locus classified as 9pS and 9pL across different cancer types. c, Frequency of deep deletion of 9p21.3 genes in patients with PDAC. d, Schematic of the synteny between the human 9p21.3 and mouse 4C4 locus. e, Schematic of MACHETE-mediated engineering of 4C4 ΔS and ΔL deletions. f, PCR genotyping for the WT, KI, ΔS and ΔL alleles in the indicated PDEC cell lines. g, Pattern of resistance/sensitivity to positive and negative selection in PDEC sgP53 EL parental, 4C4 KI, ΔS and ΔL cells. Cells were seeded and treated with puromycin (2 μg ml−1) or DT-A (50 ng ml−1) for 72 h and then stained with crystal violet to assess surviving cells. h, DNA sequencing of breakpoints from ΔS and ΔL cells confirming loss of the expected genomic regions (0.4 Mb deletion in ΔS and 1.3 Mb deletion in ΔL). Source dataCC BY · PubMed Central
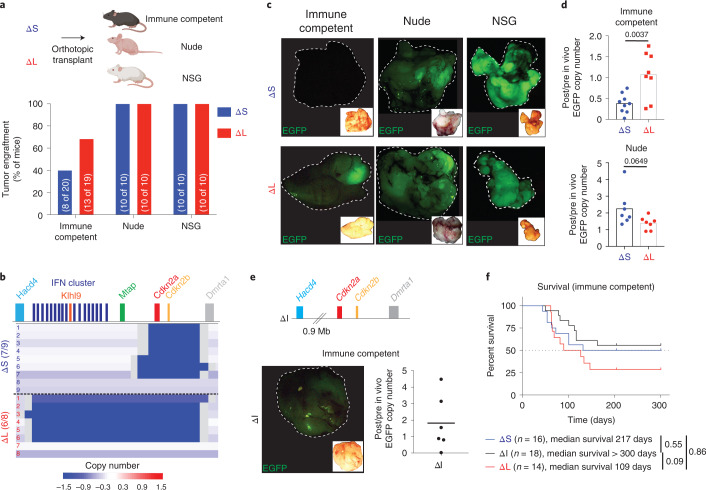
Fig. 3 Large 4C4 deletions evade immunoediting. a, Tumor engraftment at 1 month after injection of ΔS and ΔL cells in C57BL/6, nude and NSG hosts. Two independently generated input cell lines were used per genotype. Bars represent fraction of tumor-bearing mice (specific numbers of independently analyzed mice are noted in parentheses). b, Sparse whole-genome sequencing analysis of 4C4 deletion status in ΔS and ΔL tumor-derived cell lines (from C57BL/6 hosts). Each row is an independent tumor-derived line (ΔS, n = 9; ΔL, n = 8). Deep blue color depicts deletion defined as log2 relative abundance <−2. c, Representative macroscopic fluorescent images of primary tumors collected from the indicated genotypes and hosts (Images were taken from ten mice per genotype per host). Insets show the brightfield image for each tumor. d, qPCR analysis for EGFP copy number in the genomic DNA of tumor-derived (post in vivo) ΔS and ΔL lines from C57BL/6 and nude hosts, relative to their parental (pre in vivo) counterparts. Each dot represents an independent tumor-derived cell line (n = 8 C57BL/6, 7 nude; for ΔS and ΔL). Groups were compared using a two-tailed unpaired Student’s t-test. e, Schematic representation of the MACHETE-engineered ΔI allele that removes an 0.9-Mb region between Hacd4 and Cdkn2a (top). Representative macroscopic image of a ΔI tumor showing retained EGFP expression at end point (bottom left). Inset shows matched brightfield image. qPCR analysis for EGFP copy number in the genomic DNA of tumor-derived (post in vivo) ΔI cell lines from C57BL/6 hosts relative to their parental (pre in vivo) counterparts (bottom right). Each dot represents an independent cell line (n = 6). f, Survival curve of C57BL/6 mice transplanted with ΔS, ΔI, or ΔL tumor cells. Curves were compared using a log-rank test. Source data
Fig. 3 Large 4C4 deletions evade immunoediting. a, Tumor engraftment at 1 month after injection of ΔS and ΔL cells in C57BL/6, nude and NSG hosts. Two independently generated input cell lines were used per genotype. Bars represent fraction of tumor-bearing mice (specific numbers of independently analyzed mice are noted in parentheses). b, Sparse whole-genome sequencing analysis of 4C4 deletion status in ΔS and ΔL tumor-derived cell lines (from C57BL/6 hosts). Each row is an independent tumor-derived line (ΔS, n = 9; ΔL, n = 8). Deep blue color depicts deletion defined as log2 relative abundance <−2. c, Representative macroscopic fluorescent images of primary tumors collected from the indicated genotypes and hosts (Images were taken from ten mice per genotype per host). Insets show the brightfield image for each tumor. d, qPCR analysis for EGFP copy number in the genomic DNA of tumor-derived (post in vivo) ΔS and ΔL lines from C57BL/6 and nude hosts, relative to their parental (pre in vivo) counterparts. Each dot represents an independent tumor-derived cell line (n = 8 C57BL/6, 7 nude; for ΔS and ΔL). Groups were compared using a two-tailed unpaired Student’s t-test. e, Schematic representation of the MACHETE-engineered ΔI allele that removes an 0.9-Mb region between Hacd4 and Cdkn2a (top). Representative macroscopic image of a ΔI tumor showing retained EGFP expression at end point (bottom left). Inset shows matched brightfield image. qPCR analysis for EGFP copy number in the genomic DNA of tumor-derived (post in vivo) ΔI cell lines from C57BL/6 hosts relative to their parental (pre in vivo) counterparts (bottom right). Each dot represents an independent cell line (n = 6). f, Survival curve of C57BL/6 mice transplanted with ΔS, ΔI, or ΔL tumor cells. Curves were compared using a log-rank test. Source dataCC BY · PubMed Central
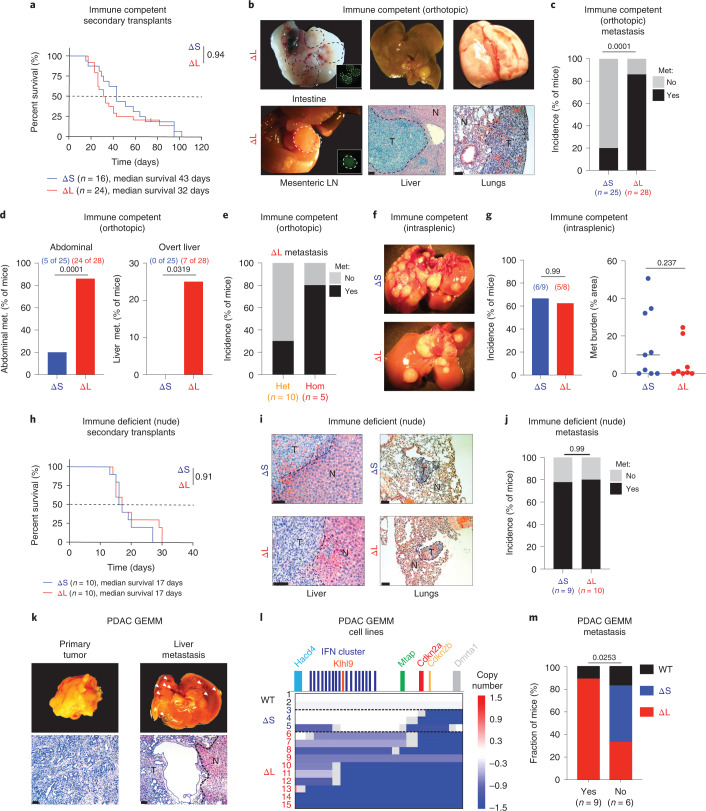
Fig. 4 Large 4C4 deletions promote metastasis. a, Survival curve of C57BL/6 mice transplanted with tumor-derived ΔS and ΔL cells. Curves were compared using a log-rank test. b, Representative images of metastases in C57BL/6 mice with ΔL tumors. Brightfield macroscopic images of abdominal (intestinal and mesenteric lymph node (LN)) metastases (met.) (left). Insets show matched EGFP fluorescence images. Macroscopic and hematoxylin & eosin images of tumor-bearing livers (middle). Scale bar, 200 μm. Macroscopic and hematoxylin & eosin images of tumor-bearing lungs (right). Scale bar, 100 μm. T, tumor; N, normal adjacent tissue. c–e, Overall (c), organ-specific (d) and zygosity-specific (e) metastasis incidence in C57BL/6 mice. Two to four independently generated input cell lines were used per genotype. Bars represent fraction of metastasis-bearing mice (independently analyzed mice are noted in parentheses) and differences were assessed with Fisher’s exact test. f, Macroscopic images of liver metastases in C57BL/6 mice after intrasplenic injection of either ΔS or ΔL cells. g, Incidence and relative area of liver metastases in C57BL/6 mice after intrasplenic injection of either ΔS or ΔL cells. Bars represent fraction of metastasis-bearing mice (independently analyzed mice are noted in parentheses) (left). Each dot represents an independent mouse (ΔS, n = 9; ΔL, n = 8) (right). Differences were assessed with Fisher’s exact test and burden with an unpaired two-tailed Student’s t-test. h, Survival curves of nude mice transplanted with tumor-derived ΔS or ΔL cells. Curves were compared using a log-rank test. i, Representative images of metastases in nude mice with ΔL or ΔS tumors. Hematoxylin/ eosin images of tumor-bearing livers (left) and lungs (right) are shown. Scale bar, 100 μm. j, Overall metastasis incidence in nude mice. Bars represent fraction of independent mice with metastasis, ΔS (n = 9) or ΔL (n = 10) tumors. Differences were assessed with Fisher’s exact test. k, Representative gross morphology (top) and hematoxylin & eosin histological stain (bottom) of matched primary tumor and overt liver metastasis in a KrasG12D/+; shSmad4 PDAC GEMM. Scale bar, 200 μm. l, Sparse WGS analysis of tumor-derived cell lines from the KC-Ren and KC-Smad4 GEMMs, grouped by spontaneous 4C4 deletion type (WT, ΔS and ΔL). Blue tracks indicate deleted regions, with color intensity corresponding to the extent of the deletion. Numbers correspond to independent mice. (M) Incidence of WT 4C4 locus, ΔS deletion or ΔL deletion among tumors with or without associated overt metastases. Specific numbers of independently analyzed mice are noted in parentheses. Differences were assessed with chi-squared test. Source data
Fig. 4 Large 4C4 deletions promote metastasis. a, Survival curve of C57BL/6 mice transplanted with tumor-derived ΔS and ΔL cells. Curves were compared using a log-rank test. b, Representative images of metastases in C57BL/6 mice with ΔL tumors. Brightfield macroscopic images of abdominal (intestinal and mesenteric lymph node (LN)) metastases (met.) (left). Insets show matched EGFP fluorescence images. Macroscopic and hematoxylin & eosin images of tumor-bearing livers (middle). Scale bar, 200 μm. Macroscopic and hematoxylin & eosin images of tumor-bearing lungs (right). Scale bar, 100 μm. T, tumor; N, normal adjacent tissue. c–e, Overall (c), organ-specific (d) and zygosity-specific (e) metastasis incidence in C57BL/6 mice. Two to four independently generated input cell lines were used per genotype. Bars represent fraction of metastasis-bearing mice (independently analyzed mice are noted in parentheses) and differences were assessed with Fisher’s exact test. f, Macroscopic images of liver metastases in C57BL/6 mice after intrasplenic injection of either ΔS or ΔL cells. g, Incidence and relative area of liver metastases in C57BL/6 mice after intrasplenic injection of either ΔS or ΔL cells. Bars represent fraction of metastasis-bearing mice (independently analyzed mice are noted in parentheses) (left). Each dot represents an independent mouse (ΔS, n = 9; ΔL, n = 8) (right). Differences were assessed with Fisher’s exact test and burden with an unpaired two-tailed Student’s t-test. h, Survival curves of nude mice transplanted with tumor-derived ΔS or ΔL cells. Curves were compared using a log-rank test. i, Representative images of metastases in nude mice with ΔL or ΔS tumors. Hematoxylin/ eosin images of tumor-bearing livers (left) and lungs (right) are shown. Scale bar, 100 μm. j, Overall metastasis incidence in nude mice. Bars represent fraction of independent mice with metastasis, ΔS (n = 9) or ΔL (n = 10) tumors. Differences were assessed with Fisher’s exact test. k, Representative gross morphology (top) and hematoxylin & eosin histological stain (bottom) of matched primary tumor and overt liver metastasis in a KrasG12D/+; shSmad4 PDAC GEMM. Scale bar, 200 μm. l, Sparse WGS analysis of tumor-derived cell lines from the KC-Ren and KC-Smad4 GEMMs, grouped by spontaneous 4C4 deletion type (WT, ΔS and ΔL). Blue tracks indicate deleted regions, with color intensity corresponding to the extent of the deletion. Numbers correspond to independent mice. (M) Incidence of WT 4C4 locus, ΔS deletion or ΔL deletion among tumors with or without associated overt metastases. Specific numbers of independently analyzed mice are noted in parentheses. Differences were assessed with chi-squared test. Source dataCC BY · PubMed Central
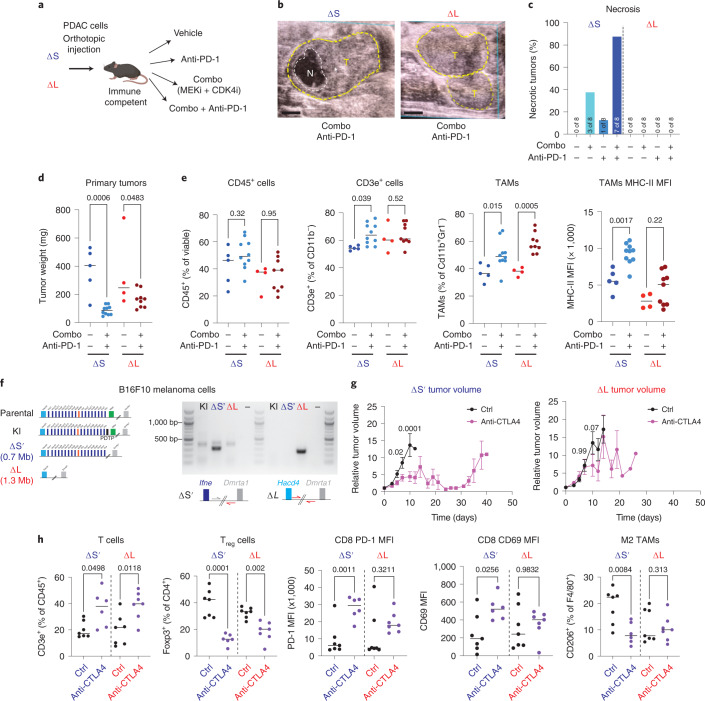
Fig. 5 Loss of type I IFNs alters the response to ICB. a, Experimental setup to test the effects of ICB in ΔS and ΔL tumors. b, Representative ultrasound images of tumors (T, circled in yellow) with observed necrotic region (N, circled in white) (left). Scale bars, 1 mm. c, Frequency of necrosis in ΔS and ΔL tumors. (n = 8–9 independent mice per group). MFI, mean fluorescence intensity. d, ΔS and ΔL tumor weights 1 week after vehicle or combo + PD-1 treatment. Differences were assessed with one-way analysis of variance (ANOVA) followed by Sidak’s multiple comparison between vehicle and combo + PD-1-treated tumors (ΔS vehicle n = 5, ΔS treated n = 10, ΔL vehicle n = 4, ΔL treated n = 9 independent mice per condition). e, Frequency of CD45+ (far left), CD3e+ (left), TAMs (right) and surface expression of major histocompatibility complex (MHC)-II in TAMs (far right) in ΔS and ΔL tumors treated with vehicle or combo + PD-1. Differences were assessed with one-way ANOVA followed by Sidak’s multiple comparison between vehicle and combo + PD-1-treated tumors (ΔS vehicle n = 5, ΔS treated n = 10, ΔL vehicle n = 4, ΔL treated n = 9 independent mice per condition). f, Schematic of the ΔS′ and ΔL alleles engineered in B16F10 cells to test the response to anti-CTLA4 (left). Genotyping PCR of the expected breakpoints for the ΔS′ and ΔL alleles (right). g, ΔS′ (left) or ΔL (right) tumor volume after treatment with vehicle or anti-CTLA4 (n = 10 independent mice per group). Dots represent mean and bars represent s.e.m. Differences were assessed with two-way ANOVA followed by Sidak’s multiple comparison between vehicle and anti-CTLA4-treated tumors. h, Frequency of T cells (CD3e+CD11B−) (far left); frequency of Foxp3+ T regulatory cells (left); surface levels of PD-1 in CD8+ T cells (middle); surface levels of CD69 in CD8+ T cells (right); and frequency of CD206+ TAMs (far right) in ΔS′ and ΔL tumors treated for 1 week with vehicle or anti-CTLA4. Differences were assessed with one-way ANOVA followed by Sidak’s multiple comparison between vehicle and anti-CTLA4 (ΔS vehicle n = 7, ΔS-treated n = 6, ΔL vehicle n = 7 and ΔL-treated n = 7 independent mice per condition). Source data
Fig. 5 Loss of type I IFNs alters the response to ICB. a, Experimental setup to test the effects of ICB in ΔS and ΔL tumors. b, Representative ultrasound images of tumors (T, circled in yellow) with observed necrotic region (N, circled in white) (left). Scale bars, 1 mm. c, Frequency of necrosis in ΔS and ΔL tumors. (n = 8–9 independent mice per group). MFI, mean fluorescence intensity. d, ΔS and ΔL tumor weights 1 week after vehicle or combo + PD-1 treatment. Differences were assessed with one-way analysis of variance (ANOVA) followed by Sidak’s multiple comparison between vehicle and combo + PD-1-treated tumors (ΔS vehicle n = 5, ΔS treated n = 10, ΔL vehicle n = 4, ΔL treated n = 9 independent mice per condition). e, Frequency of CD45+ (far left), CD3e+ (left), TAMs (right) and surface expression of major histocompatibility complex (MHC)-II in TAMs (far right) in ΔS and ΔL tumors treated with vehicle or combo + PD-1. Differences were assessed with one-way ANOVA followed by Sidak’s multiple comparison between vehicle and combo + PD-1-treated tumors (ΔS vehicle n = 5, ΔS treated n = 10, ΔL vehicle n = 4, ΔL treated n = 9 independent mice per condition). f, Schematic of the ΔS′ and ΔL alleles engineered in B16F10 cells to test the response to anti-CTLA4 (left). Genotyping PCR of the expected breakpoints for the ΔS′ and ΔL alleles (right). g, ΔS′ (left) or ΔL (right) tumor volume after treatment with vehicle or anti-CTLA4 (n = 10 independent mice per group). Dots represent mean and bars represent s.e.m. Differences were assessed with two-way ANOVA followed by Sidak’s multiple comparison between vehicle and anti-CTLA4-treated tumors. h, Frequency of T cells (CD3e+CD11B−) (far left); frequency of Foxp3+ T regulatory cells (left); surface levels of PD-1 in CD8+ T cells (middle); surface levels of CD69 in CD8+ T cells (right); and frequency of CD206+ TAMs (far right) in ΔS′ and ΔL tumors treated for 1 week with vehicle or anti-CTLA4. Differences were assessed with one-way ANOVA followed by Sidak’s multiple comparison between vehicle and anti-CTLA4 (ΔS vehicle n = 7, ΔS-treated n = 6, ΔL vehicle n = 7 and ΔL-treated n = 7 independent mice per condition). Source dataCC BY · PubMed Central
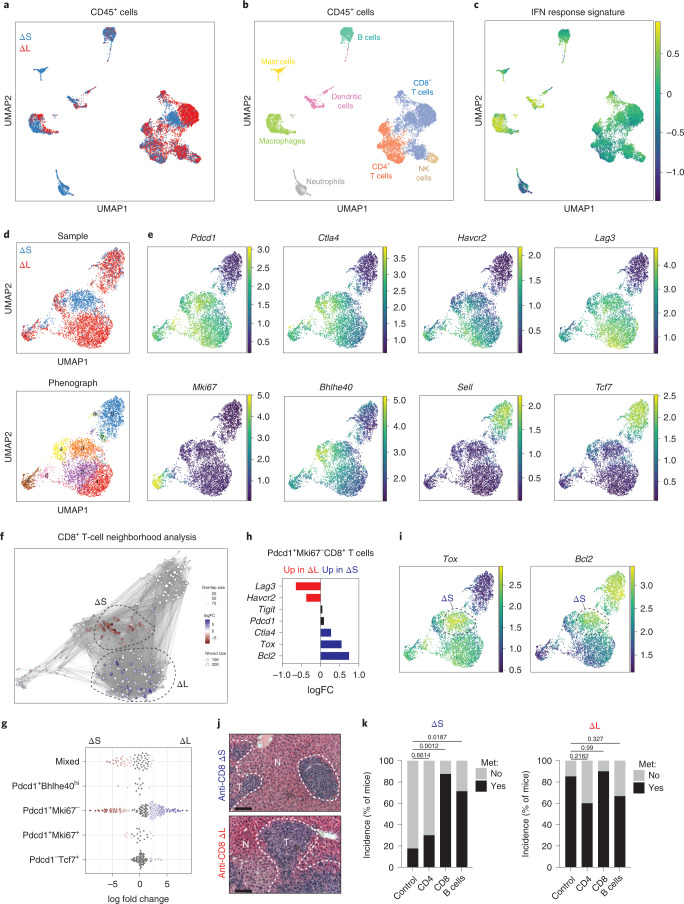
Fig. 6 4C4/9p21.3 deletion genotype dictates type I IFN signaling and immune infiltration. a, UMAP of CD45+ cells showing cells derived from ΔS (n = 7,774 cells) or ΔL (n = 7,560 cells) tumors. b, UMAP of CD45+ cells annotating the specific immune subsets. c, UMAP of averaged IFN response signature across CD45+ populations. d, UMAP of CD8+ T cells from ΔS or ΔL tumors (top). Cells are colored by sample. UMAP of CD8+ T-cell clusters (bottom). Cells are colored by their cluster identity. e, UMAP of imputed expression for the indicated genes. f, Milo analysis of CD8+ T cells. Neighborhoods identified through Milo analysis using default parameters (red indicates enrichment in ΔS and blue indicates enrichment in ΔL). FC, fold change. g, Swarm plot of the distribution of CD8+ T-cell neighborhoods in ΔS or ΔL tumors across transcriptional states. The x axis indicates the log2(fold change) in differential abundance of ΔS (<0) and ΔL (>0). Each neighborhood is associated with a cell type if more than 80% of the cell state in the neighborhood belong to said state, else it is annotated as ‘mixed’. h, Differential gene expression of the indicated genes in Pdcd1+Mki67−CD8+ T cells. i, UMAP of imputed expression of Tox and Bcl2. Dashed circles highlight ΔS-enriched CD8+ T cells. j, Representative images of liver metastasis upon CD8+ cell depletion. Scale bar, 100 μm. k, Incidence of metastasis upon depletion of immune subsets in ΔS or ΔL tumors. Two independently generated input cell lines were used per genotype. Bars represent fraction of metastasis-bearing mice (ΔS control n = 25, ΔS anti-CD4 n = 10, ΔS anti-CD8 n = 8, ΔS anti-CD20 n = 7, ΔL control n = 28, ΔL anti-CD4 n = 5, ΔL anti-CD8 n = 10 and ΔL anti-CD20 n = 9 independent mice per condition). Differences were assessed with Fisher’s exact test. Source data
Fig. 6 4C4/9p21.3 deletion genotype dictates type I IFN signaling and immune infiltration. a, UMAP of CD45+ cells showing cells derived from ΔS (n = 7,774 cells) or ΔL (n = 7,560 cells) tumors. b, UMAP of CD45+ cells annotating the specific immune subsets. c, UMAP of averaged IFN response signature across CD45+ populations. d, UMAP of CD8+ T cells from ΔS or ΔL tumors (top). Cells are colored by sample. UMAP of CD8+ T-cell clusters (bottom). Cells are colored by their cluster identity. e, UMAP of imputed expression for the indicated genes. f, Milo analysis of CD8+ T cells. Neighborhoods identified through Milo analysis using default parameters (red indicates enrichment in ΔS and blue indicates enrichment in ΔL). FC, fold change. g, Swarm plot of the distribution of CD8+ T-cell neighborhoods in ΔS or ΔL tumors across transcriptional states. The x axis indicates the log2(fold change) in differential abundance of ΔS (<0) and ΔL (>0). Each neighborhood is associated with a cell type if more than 80% of the cell state in the neighborhood belong to said state, else it is annotated as ‘mixed’. h, Differential gene expression of the indicated genes in Pdcd1+Mki67−CD8+ T cells. i, UMAP of imputed expression of Tox and Bcl2. Dashed circles highlight ΔS-enriched CD8+ T cells. j, Representative images of liver metastasis upon CD8+ cell depletion. Scale bar, 100 μm. k, Incidence of metastasis upon depletion of immune subsets in ΔS or ΔL tumors. Two independently generated input cell lines were used per genotype. Bars represent fraction of metastasis-bearing mice (ΔS control n = 25, ΔS anti-CD4 n = 10, ΔS anti-CD8 n = 8, ΔS anti-CD20 n = 7, ΔL control n = 28, ΔL anti-CD4 n = 5, ΔL anti-CD8 n = 10 and ΔL anti-CD20 n = 9 independent mice per condition). Differences were assessed with Fisher’s exact test. Source dataCC BY · PubMed Central
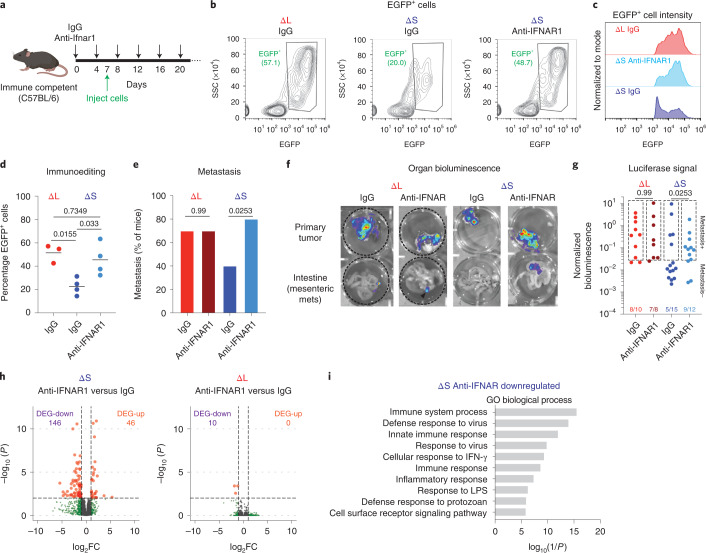
Fig. 7 IFNAR1 blockade promotes immune evasion and metastasis. a, Experimental outline to test the role of IFNAR1 signaling in transplantation experiments. b, Representative flow cytometry plots of ΔS or ΔL tumors from C57BL/6 mice treated with IgG or αIFNAR1 antibodies. SSC, side scatter. c, Representative flow cytometry plots of EGFP+ populations from IgG ΔL, IgG ΔS or anti-IFNAR1 ΔS tumors. d, Quantification of EGFP+ cells in ΔS or ΔL tumors from C57BL/6 mice treated with IgG or anti-IFNAR1 antibodies. Each dot represents an independent biological replicate (IgG ΔS n = 4, anti-IFNAR1 ΔS n = 4, IgG ΔL n = 3). Differences were assessed with one-way ANOVA followed by Tukey’s multiple comparison. e, Incidence of metastasis in C57BL/6 mice transplanted with homozygous ΔS or ΔL lines and treated with IgG or anti-IFNAR1 antibodies. Two independently generated input cell lines were used per genotype and independent mice were assessed (IgG ΔS n = 15, anti-IFNAR1 ΔS n = 10, IgG ΔL n = 10, anti-IFNAR1 ΔL n = 8). Differences were assessed with chi-squared test. f, Representative bioluminescent images of primary tumors and intestines from mice with the indicated genotypes of transplanted cells and antibody treatments. g, Quantification of all replicates. Boxes indicate signals above the threshold for metastasis detection. Two independently generated input cell lines were used per genotype and independent mice were assessed (IgG ΔS n = 15, anti-IFNAR1 ΔS n = 12, IgG ΔL n = 10, anti-IFNAR1 ΔL n = 8). Differences were assessed with chi-squared test. h, Volcano plots of differentially expressed genes (DEGs) comparing IFNAR1 blockade versus IgG controls in ΔS or ΔL tumors. Up, upregulated; down, downregulated. i, DAVID Gene Ontology analysis of anti-IFNAR1 downregulated genes in ΔS tumors. Top ten significant pathways are shown. Source data
Fig. 7 IFNAR1 blockade promotes immune evasion and metastasis. a, Experimental outline to test the role of IFNAR1 signaling in transplantation experiments. b, Representative flow cytometry plots of ΔS or ΔL tumors from C57BL/6 mice treated with IgG or αIFNAR1 antibodies. SSC, side scatter. c, Representative flow cytometry plots of EGFP+ populations from IgG ΔL, IgG ΔS or anti-IFNAR1 ΔS tumors. d, Quantification of EGFP+ cells in ΔS or ΔL tumors from C57BL/6 mice treated with IgG or anti-IFNAR1 antibodies. Each dot represents an independent biological replicate (IgG ΔS n = 4, anti-IFNAR1 ΔS n = 4, IgG ΔL n = 3). Differences were assessed with one-way ANOVA followed by Tukey’s multiple comparison. e, Incidence of metastasis in C57BL/6 mice transplanted with homozygous ΔS or ΔL lines and treated with IgG or anti-IFNAR1 antibodies. Two independently generated input cell lines were used per genotype and independent mice were assessed (IgG ΔS n = 15, anti-IFNAR1 ΔS n = 10, IgG ΔL n = 10, anti-IFNAR1 ΔL n = 8). Differences were assessed with chi-squared test. f, Representative bioluminescent images of primary tumors and intestines from mice with the indicated genotypes of transplanted cells and antibody treatments. g, Quantification of all replicates. Boxes indicate signals above the threshold for metastasis detection. Two independently generated input cell lines were used per genotype and independent mice were assessed (IgG ΔS n = 15, anti-IFNAR1 ΔS n = 12, IgG ΔL n = 10, anti-IFNAR1 ΔL n = 8). Differences were assessed with chi-squared test. h, Volcano plots of differentially expressed genes (DEGs) comparing IFNAR1 blockade versus IgG controls in ΔS or ΔL tumors. Up, upregulated; down, downregulated. i, DAVID Gene Ontology analysis of anti-IFNAR1 downregulated genes in ΔS tumors. Top ten significant pathways are shown. Source dataCC BY · PubMed Central
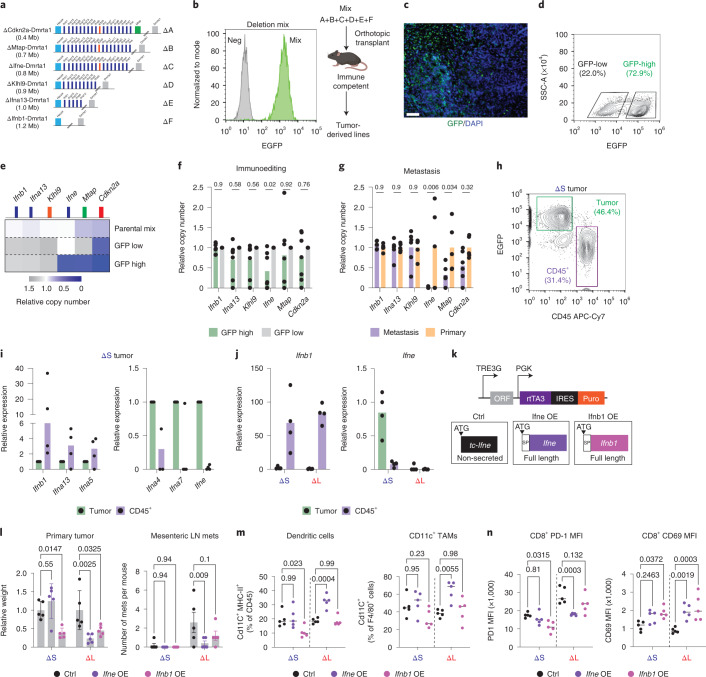
Fig. 8 Ifne promotes immune surveillance and inhibits metastasis. a, Schematic of extended series of 4C4 deletion alleles. b, Flow cytometry measurement of EGFP fluorescence in cultured deletion series mix (‘Mix’) (left). EGFP-negative cells were used as negative controls (‘Neg’). Schematic of in vivo competition experiment (right). c, Representative EGFP immunofluorescent stain of a deletion-mix tumor, which was repeated in all tumors arising from the in vivo competition assay (n = 7). Scale bar, 200 μm. d, Representative flow cytometry plot of EGFP levels in a deletion-mix tumor. GFP-low and GFP-high cell populations were sorted as marked. e, Copy-number qPCR analysis of the indicated genes in the parental cell mix and GFP-low and GFP-high cells sorted from the tumor from d. This was repeated in all tumors arising from the in vivo competition assay (n = 7). f, Relative copy-number quantification of indicated genes in GFP-high versus GFP-low cells. Differences were assessed by one-way ANOVA followed by Sidak’s multiple comparison test. Each dot is an independent biological replicate (n = 7). g, Relative copy-number quantification of indicated genes in metastases- versus primary tumor-derived cells. Differences were assessed by one-way ANOVA followed by Sidak’s multiple comparison test. Each dot is an independent biological replicate (primary n = 5 and metastasis n = 6). h, Representative flow cytometry plot of tumor (EGFP+) and immune (CD45+) cells from a ΔS tumor. i, RT–qPCR of the indicated IFN genes in tumor cells and infiltrating CD45+ cells from ΔS tumors. Each dot is an independent biological replicate (n = 4 tumors). j, RT–qPCR of Ifnb1 and Ifne in tumor cells and infiltrating CD45+ cells from ΔS and ΔL tumors. Each dot is an independent biological replicate (ΔS n = 4 and ΔL n = 4). k, Design of the vector for doxycycline-inducible expression of full-length mouse Ifnb1, Ifne or a truncated version. l, Relative quantification of primary tumor weights (left) and number of mesenteric LN metastases (right). Differences were assessed by one-way ANOVA followed by Sidak’s multiple comparison test to the respective control population. Each dot is an independent biological replicate (n = 5 for all conditions). m, Frequency of dendritic cells (left) and Cd11c+ TAMs (right). Differences were assessed by one-way ANOVA followed by Sidak’s multiple comparison test to the respective control population. Each dot is an independent biological replicate (n = 5 for all conditions). n, Levels of PD-1 (left) and CD69 (right) levels in CD8+ T cells. Differences were assessed by one-way ANOVA followed by Sidak’s multiple comparison test to the respective control population. Each dot is an independent biological replicate (n = 5 for all conditions). Source data
Fig. 8 Ifne promotes immune surveillance and inhibits metastasis. a, Schematic of extended series of 4C4 deletion alleles. b, Flow cytometry measurement of EGFP fluorescence in cultured deletion series mix (‘Mix’) (left). EGFP-negative cells were used as negative controls (‘Neg’). Schematic of in vivo competition experiment (right). c, Representative EGFP immunofluorescent stain of a deletion-mix tumor, which was repeated in all tumors arising from the in vivo competition assay (n = 7). Scale bar, 200 μm. d, Representative flow cytometry plot of EGFP levels in a deletion-mix tumor. GFP-low and GFP-high cell populations were sorted as marked. e, Copy-number qPCR analysis of the indicated genes in the parental cell mix and GFP-low and GFP-high cells sorted from the tumor from d. This was repeated in all tumors arising from the in vivo competition assay (n = 7). f, Relative copy-number quantification of indicated genes in GFP-high versus GFP-low cells. Differences were assessed by one-way ANOVA followed by Sidak’s multiple comparison test. Each dot is an independent biological replicate (n = 7). g, Relative copy-number quantification of indicated genes in metastases- versus primary tumor-derived cells. Differences were assessed by one-way ANOVA followed by Sidak’s multiple comparison test. Each dot is an independent biological replicate (primary n = 5 and metastasis n = 6). h, Representative flow cytometry plot of tumor (EGFP+) and immune (CD45+) cells from a ΔS tumor. i, RT–qPCR of the indicated IFN genes in tumor cells and infiltrating CD45+ cells from ΔS tumors. Each dot is an independent biological replicate (n = 4 tumors). j, RT–qPCR of Ifnb1 and Ifne in tumor cells and infiltrating CD45+ cells from ΔS and ΔL tumors. Each dot is an independent biological replicate (ΔS n = 4 and ΔL n = 4). k, Design of the vector for doxycycline-inducible expression of full-length mouse Ifnb1, Ifne or a truncated version. l, Relative quantification of primary tumor weights (left) and number of mesenteric LN metastases (right). Differences were assessed by one-way ANOVA followed by Sidak’s multiple comparison test to the respective control population. Each dot is an independent biological replicate (n = 5 for all conditions). m, Frequency of dendritic cells (left) and Cd11c+ TAMs (right). Differences were assessed by one-way ANOVA followed by Sidak’s multiple comparison test to the respective control population. Each dot is an independent biological replicate (n = 5 for all conditions). n, Levels of PD-1 (left) and CD69 (right) levels in CD8+ T cells. Differences were assessed by one-way ANOVA followed by Sidak’s multiple comparison test to the respective control population. Each dot is an independent biological replicate (n = 5 for all conditions). Source dataCC BY · PubMed Central
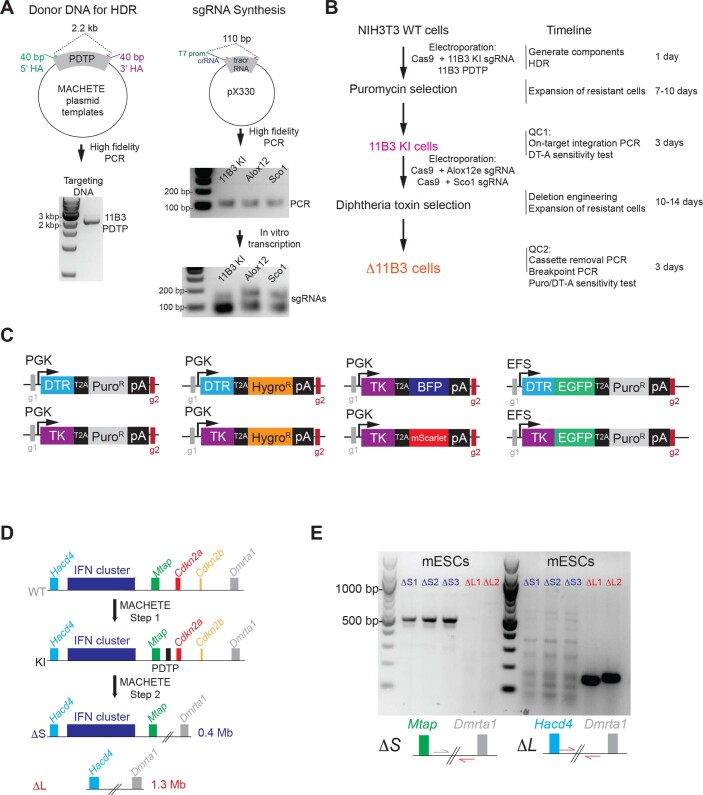
Extended Data Fig. 1 MACHETE allows rapid and flexible deletion engineering. (A) Preparation of donor DNA and sgRNA used for MACHETE-mediated targeting of the 11B3 locus in NIH3T3 cells. (B) Experimental outline and timing for MACHETE-based 11B3 deletion engineering in NIH3T3 cells. (C) Suite of dual selection cassettes generated for the MACHETE approach. (D) Schematic of MACHETE-mediated engineering of 4C4 deletions in mouse embryonic stem cells (mESCs). (E) PCR genotyping for the chromosome 4C4 ΔS and ΔL alleles in mESCs. Source data
Extended Data Fig. 1 MACHETE allows rapid and flexible deletion engineering. (A) Preparation of donor DNA and sgRNA used for MACHETE-mediated targeting of the 11B3 locus in NIH3T3 cells. (B) Experimental outline and timing for MACHETE-based 11B3 deletion engineering in NIH3T3 cells. (C) Suite of dual selection cassettes generated for the MACHETE approach. (D) Schematic of MACHETE-mediated engineering of 4C4 deletions in mouse embryonic stem cells (mESCs). (E) PCR genotyping for the chromosome 4C4 ΔS and ΔL alleles in mESCs. Source dataCC BY · PubMed Central
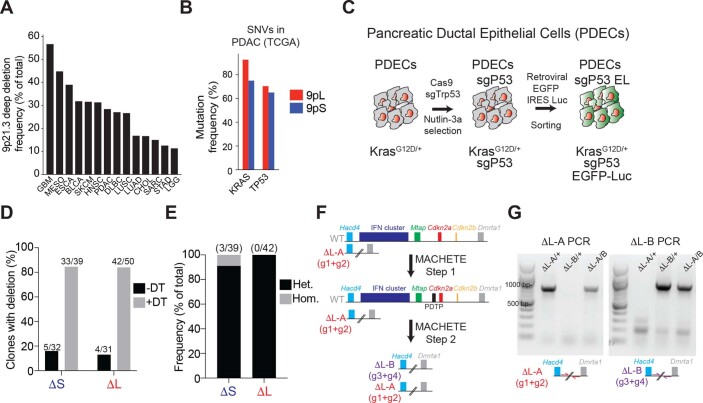
Extended Data Fig. 2 Generation of 4C4 deletions in PDECs. (A) Frequency of deep deletions at the 9p21.3 locus across different types of cancer in the TCGA dataset. (B) Mutation frequency of KRAS and TP53 in 9pL and 9pS PDACs in the TCGA dataset. (C) Schematic of the generation of PDEC sgP53 EL cells. CRISPR-mediated knockout of Trp53 was done by electroporation of a pX330-sgP53 plasmid followed by treatment with Nutlin-3 (10 μM) to select for Trp53-deficient cells. PDEC sgP53 cells were then infected with a retroviral EGFP-luciferase construct and cells were selected by sorting for EGFP + expression. (D) Clonal analysis of ΔS and ΔL cells engineered without (-DT) and with (+DT) diphtheria toxin selection. (E) Frequency of heterozygous and homozygous ΔS or ΔL deletions in PDEC cells following MACHETE engineering. (F) Schematic of iterative editing of cells bearing a heterozygous ΔL deletion, using a distinct set of guides to discern between the different deletions. (G) PCR genotyping of the distinct ΔL deletion breakpoints. Source data
Extended Data Fig. 2 Generation of 4C4 deletions in PDECs. (A) Frequency of deep deletions at the 9p21.3 locus across different types of cancer in the TCGA dataset. (B) Mutation frequency of KRAS and TP53 in 9pL and 9pS PDACs in the TCGA dataset. (C) Schematic of the generation of PDEC sgP53 EL cells. CRISPR-mediated knockout of Trp53 was done by electroporation of a pX330-sgP53 plasmid followed by treatment with Nutlin-3 (10 μM) to select for Trp53-deficient cells. PDEC sgP53 cells were then infected with a retroviral EGFP-luciferase construct and cells were selected by sorting for EGFP + expression. (D) Clonal analysis of ΔS and ΔL cells engineered without (-DT) and with (+DT) diphtheria toxin selection. (E) Frequency of heterozygous and homozygous ΔS or ΔL deletions in PDEC cells following MACHETE engineering. (F) Schematic of iterative editing of cells bearing a heterozygous ΔL deletion, using a distinct set of guides to discern between the different deletions. (G) PCR genotyping of the distinct ΔL deletion breakpoints. Source dataCC BY · PubMed Central
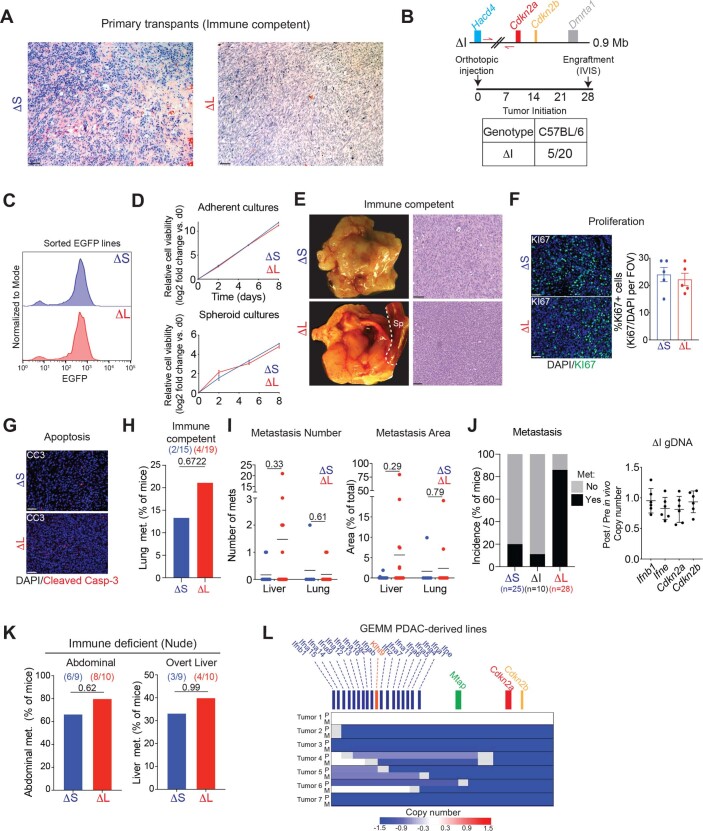
Extended Data Fig. 3 Large 4C4 deletions promote immune evasion and metastasis in a host-dependent manner. (A) Histology of ΔS and ΔL tumors in C57BL/6 mice. Representative H/E images are shown. Scale bar is 100 μm. (B) (Top) Schematic representation of the MACHETE-engineered ΔI allele that removes a 0.9 Mb region between Hacd4 and Cdkn2a. (Bottom) Engraftment of ΔI cells in C57BL/6 mice one month after injection, measured by bioluminescence. (C) EGFP levels of representative re-sorted tumor-derived ΔS and ΔL cell lines (repeated 4 times). (D) Growth curves in adherent (top) or suspension (bottom) conditions for ΔS and ΔL cell lines. (E) Macroscopic images (left) and hematoxylin/eosin stain (right) of orthotopic tumors in C57BL/6 mice transplanted with tumor-derived ΔS and ΔL cells. Scale bar is 200 μm. (F) Representative images (left) and quantification (middle) of the fraction of Ki67+ cells in ΔS and ΔL tumors. Scale bar is 100 μm. Each dot represents an independent biological replicate (n = 5). (G) Representative images of cleaved caspase-3 in ΔS and ΔL tumors, which showed little to no detectable signal. Scale bar is 100 μm. (H) Lung metastasis incidence in C57BL/6 mice with either ΔS or ΔL tumors. Bars represent the fraction of metastasis-bearing mice. Differences were assessed by Fisher’s exact test. Each dot represents an independent biological replicate (ΔS n = 17, ΔL n = 23). (I) Quantification of the number (left) and relative area (right) of liver and lung metastases in C57BL/6 mice with either ΔS or ΔL tumors. Each dot represents an independent biological replicate (Liver ΔS n = 12, ΔL n = 21; Lung ΔS n = 6, ΔL n = 11). Differences were assessed by two-tailed unpaired test. (J) (Left) Metastasis incidence in C57BL/6 mice with ΔS, ΔI, or ΔL tumors. (Right) Copy number of Ifnb1, Ifne, Cdkn2a, and Cdkn2b in tumor-derived ΔI lines (Post) relative to pre-injection parental ΔI cells (Pre). Each dot represents an independent tumor-derived line (n = 5). ΔS and ΔL data are also used in Fig. 4. (K) Metastasis incidence in Nude mice with either ΔS or ΔL tumors. Each dot represents an independent biological replicate (Abdominal ΔS n = 9, ΔL n = 10; Liver ΔS n = 9, ΔL n = 10). (L) Analysis of 4C4 deletion status in PDAC GEMM cell lines derived from matched primary tumors (‘P’) and metastases (‘M’). Each row is paired primary and metastasis-derived cell lines (n = 7 pairs). Sparse WGS was used to assess the status of the 4C4 locus. Deep blue color depicts deletion, defined as log2 relative abundance < −2. Source data
Extended Data Fig. 3 Large 4C4 deletions promote immune evasion and metastasis in a host-dependent manner. (A) Histology of ΔS and ΔL tumors in C57BL/6 mice. Representative H/E images are shown. Scale bar is 100 μm. (B) (Top) Schematic representation of the MACHETE-engineered ΔI allele that removes a 0.9 Mb region between Hacd4 and Cdkn2a. (Bottom) Engraftment of ΔI cells in C57BL/6 mice one month after injection, measured by bioluminescence. (C) EGFP levels of representative re-sorted tumor-derived ΔS and ΔL cell lines (repeated 4 times). (D) Growth curves in adherent (top) or suspension (bottom) conditions for ΔS and ΔL cell lines. (E) Macroscopic images (left) and hematoxylin/eosin stain (right) of orthotopic tumors in C57BL/6 mice transplanted with tumor-derived ΔS and ΔL cells. Scale bar is 200 μm. (F) Representative images (left) and quantification (middle) of the fraction of Ki67+ cells in ΔS and ΔL tumors. Scale bar is 100 μm. Each dot represents an independent biological replicate (n = 5). (G) Representative images of cleaved caspase-3 in ΔS and ΔL tumors, which showed little to no detectable signal. Scale bar is 100 μm. (H) Lung metastasis incidence in C57BL/6 mice with either ΔS or ΔL tumors. Bars represent the fraction of metastasis-bearing mice. Differences were assessed by Fisher’s exact test. Each dot represents an independent biological replicate (ΔS n = 17, ΔL n = 23). (I) Quantification of the number (left) and relative area (right) of liver and lung metastases in C57BL/6 mice with either ΔS or ΔL tumors. Each dot represents an independent biological replicate (Liver ΔS n = 12, ΔL n = 21; Lung ΔS n = 6, ΔL n = 11). Differences were assessed by two-tailed unpaired test. (J) (Left) Metastasis incidence in C57BL/6 mice with ΔS, ΔI, or ΔL tumors. (Right) Copy number of Ifnb1, Ifne, Cdkn2a, and Cdkn2b in tumor-derived ΔI lines (Post) relative to pre-injection parental ΔI cells (Pre). Each dot represents an independent tumor-derived line (n = 5). ΔS and ΔL data are also used in Fig. 4. (K) Metastasis incidence in Nude mice with either ΔS or ΔL tumors. Each dot represents an independent biological replicate (Abdominal ΔS n = 9, ΔL n = 10; Liver ΔS n = 9, ΔL n = 10). (L) Analysis of 4C4 deletion status in PDAC GEMM cell lines derived from matched primary tumors (‘P’) and metastases (‘M’). Each row is paired primary and metastasis-derived cell lines (n = 7 pairs). Sparse WGS was used to assess the status of the 4C4 locus. Deep blue color depicts deletion, defined as log2 relative abundance < −2. Source dataCC BY · PubMed Central
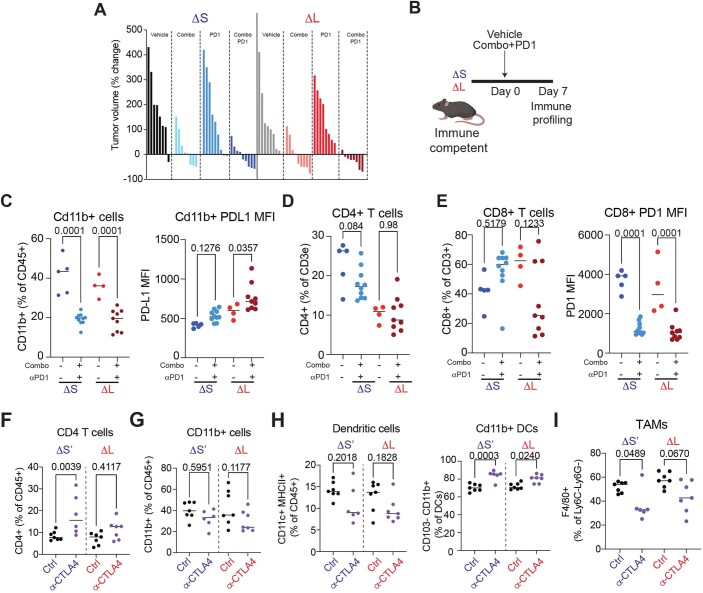
Extended Data Fig. 4 4C4 deletions dictate the response to immune checkpoint blockade. (A) Waterfall plot of percentage of tumor volume change. Tumors were measured at baseline and 14 days after treatment with vehicle, Combo (MEK and CDK4/6 inhibitors), α-PD1, or Combo + α-PD1. Each bar represents an independent biological replicate (n = 8-9 per group). (B) Experimental setup to assess immune infiltration in ΔS and ΔL tumors before onset of necrosis. (C) (Left) Frequency of CD11B + cells; (Right) Median PD-L1 surface expression of CD11B + cells in ΔS and ΔL tumors treated with vehicle or Combo+PD1. Differences were assessed Differences were assessed with one-way ANOVA followed by Sidak’s multiple comparison between vehicle and Combo+PD1 treated tumors (ΔS vehicle n = 5, ΔS treated n = 10, ΔL vehicle n = 4, ΔL treated n = 9 independent mice per condition). (D) Frequency of CD4 T cells (CD3e + CD4 + ) in ΔS and ΔL tumors treated with vehicle or Combo+PD1. Differences were assessed with one-way ANOVA followed by Sidak’s multiple comparison between vehicle and Combo+PD1 treated tumors (ΔS vehicle n = 5, ΔS treated n = 10, ΔL vehicle n = 4, ΔL treated n = 9 independent mice per condition). (E) (Left) Frequency of CD8 T cells (CD3e + CD8 + ); (Right) Median PD1 surface expression of CD8 T cells in ΔS and ΔL tumors treated with vehicle or Combo+PD1. Differences were assessed with one-way ANOVA followed by Sidak’s multiple comparison between vehicle and Combo+PD1 treated tumors (ΔS vehicle n = 5, ΔS treated n = 10, ΔL vehicle n = 4, ΔL treated n = 9 independent mice per condition). (F-I) Frequency of the indicated cell types in ΔS’ and ΔL tumors treated for one week with vehicle or α-CTLA4 condition). (F) CD4 T cells (CD3e + CD4 + ); (G) CD11B + cells; (H) (Left) Dendritic cells (CD11C + MHCII + ), (Right) CD11B + DCs (CD11C + MHCII + CD11B + CD103-); (I) TAMs (CD11B + CD11C- Ly6G- Ly6C- F4/80 + ). Differences were assessed with one-way ANOVA followed by Sidak’s multiple comparison between vehicle and α-CTLA4 (ΔS vehicle n = 7, ΔS treated n = 6, ΔL vehicle n = 7, ΔL treated n = 7 independent mice per condition). Source data
Extended Data Fig. 4 4C4 deletions dictate the response to immune checkpoint blockade. (A) Waterfall plot of percentage of tumor volume change. Tumors were measured at baseline and 14 days after treatment with vehicle, Combo (MEK and CDK4/6 inhibitors), α-PD1, or Combo + α-PD1. Each bar represents an independent biological replicate (n = 8-9 per group). (B) Experimental setup to assess immune infiltration in ΔS and ΔL tumors before onset of necrosis. (C) (Left) Frequency of CD11B + cells; (Right) Median PD-L1 surface expression of CD11B + cells in ΔS and ΔL tumors treated with vehicle or Combo+PD1. Differences were assessed Differences were assessed with one-way ANOVA followed by Sidak’s multiple comparison between vehicle and Combo+PD1 treated tumors (ΔS vehicle n = 5, ΔS treated n = 10, ΔL vehicle n = 4, ΔL treated n = 9 independent mice per condition). (D) Frequency of CD4 T cells (CD3e + CD4 + ) in ΔS and ΔL tumors treated with vehicle or Combo+PD1. Differences were assessed with one-way ANOVA followed by Sidak’s multiple comparison between vehicle and Combo+PD1 treated tumors (ΔS vehicle n = 5, ΔS treated n = 10, ΔL vehicle n = 4, ΔL treated n = 9 independent mice per condition). (E) (Left) Frequency of CD8 T cells (CD3e + CD8 + ); (Right) Median PD1 surface expression of CD8 T cells in ΔS and ΔL tumors treated with vehicle or Combo+PD1. Differences were assessed with one-way ANOVA followed by Sidak’s multiple comparison between vehicle and Combo+PD1 treated tumors (ΔS vehicle n = 5, ΔS treated n = 10, ΔL vehicle n = 4, ΔL treated n = 9 independent mice per condition). (F-I) Frequency of the indicated cell types in ΔS’ and ΔL tumors treated for one week with vehicle or α-CTLA4 condition). (F) CD4 T cells (CD3e + CD4 + ); (G) CD11B + cells; (H) (Left) Dendritic cells (CD11C + MHCII + ), (Right) CD11B + DCs (CD11C + MHCII + CD11B + CD103-); (I) TAMs (CD11B + CD11C- Ly6G- Ly6C- F4/80 + ). Differences were assessed with one-way ANOVA followed by Sidak’s multiple comparison between vehicle and α-CTLA4 (ΔS vehicle n = 7, ΔS treated n = 6, ΔL vehicle n = 7, ΔL treated n = 7 independent mice per condition). Source dataCC BY · PubMed Central
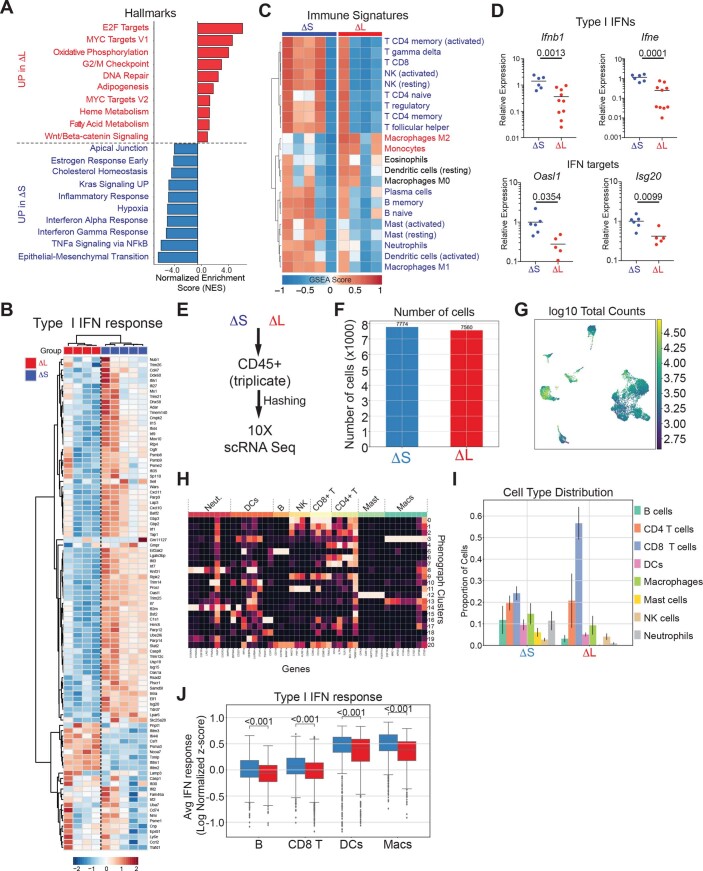
Extended Data Fig. 5 4C4 deletions determine the levels of IFNAR signaling. (A) Histogram of GSEA Normalized Enrichment Score (NES) highlighting the top 10 differentially expressed Hallmark gene datasets in ΔS and ΔL tumors. (B) Heatmap of type I IFN response gene expression in ΔS and ΔL tumors. (C) Heatmap of gene expression signatures for distinct immune subpopulations in ΔS and ΔL tumors. (D) Relative mRNA expression of representative type I IFN genes (Ifnb1, Ifne) or type I IFN targets (Oasl1, Isg20), measured by RT-qPCR. Each dot represents an independent biological replicate (ΔS n = 6, ΔL n = 10). Differences were assessed by an unpaired two-tailed t-test. (E) Experimental design for scRNA-seq analysis of CD45 + cells. CD45 + cells were sorted from three independent ΔS and ΔL tumors, uniquely labeled by antibody-coupled barcoding, pooled, and processed for scRNA-seq analysis. (F) Number of high-quality CD45 + cells recovered from ΔS and ΔL tumors. (G) UMAP of library size per cell. (H) Heatmap of genes used to identify specific subpopulations within CD45 + cells. (I) Distribution of CD45 + cells across different subpopulations in ΔS and ΔL tumors. (J) Average expression of the type I IFN response signature across antigen-presenting populations (B cells, dendritic cells, and macrophages) and CD8 + T cells. Source data
Extended Data Fig. 5 4C4 deletions determine the levels of IFNAR signaling. (A) Histogram of GSEA Normalized Enrichment Score (NES) highlighting the top 10 differentially expressed Hallmark gene datasets in ΔS and ΔL tumors. (B) Heatmap of type I IFN response gene expression in ΔS and ΔL tumors. (C) Heatmap of gene expression signatures for distinct immune subpopulations in ΔS and ΔL tumors. (D) Relative mRNA expression of representative type I IFN genes (Ifnb1, Ifne) or type I IFN targets (Oasl1, Isg20), measured by RT-qPCR. Each dot represents an independent biological replicate (ΔS n = 6, ΔL n = 10). Differences were assessed by an unpaired two-tailed t-test. (E) Experimental design for scRNA-seq analysis of CD45 + cells. CD45 + cells were sorted from three independent ΔS and ΔL tumors, uniquely labeled by antibody-coupled barcoding, pooled, and processed for scRNA-seq analysis. (F) Number of high-quality CD45 + cells recovered from ΔS and ΔL tumors. (G) UMAP of library size per cell. (H) Heatmap of genes used to identify specific subpopulations within CD45 + cells. (I) Distribution of CD45 + cells across different subpopulations in ΔS and ΔL tumors. (J) Average expression of the type I IFN response signature across antigen-presenting populations (B cells, dendritic cells, and macrophages) and CD8 + T cells. Source dataCC BY · PubMed Central
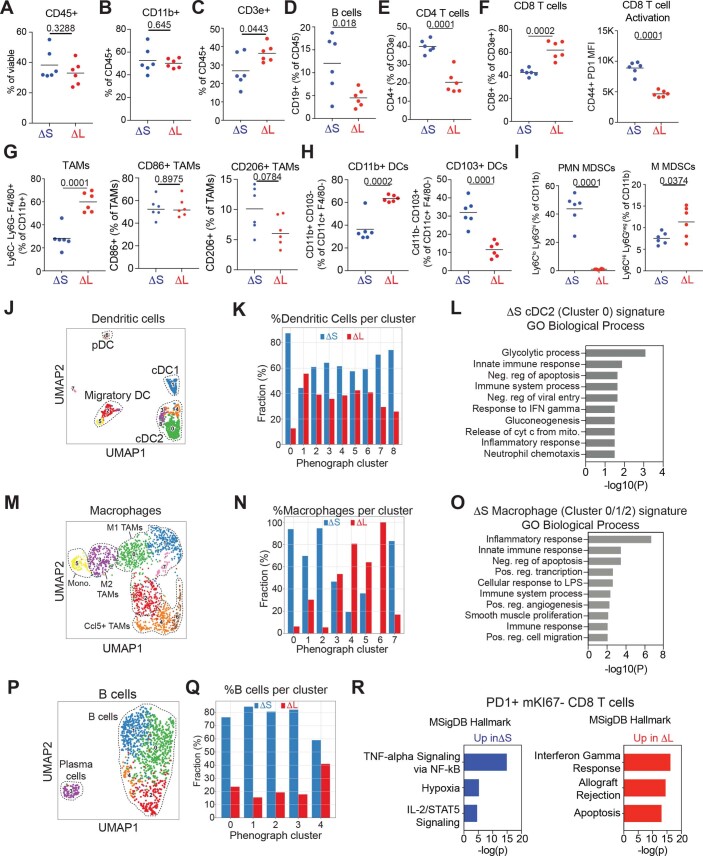
Extended Data Fig. 6 4C4 deletions alter the state of antigen presenting cells. (A-I) Immunophenotyping of infiltrating populations in ΔS and ΔL tumors. Frequency of CD45+ cells (A), CD11b+ cells (B), CD3e+ cells (C), CD19+ B cells (D), CD4+ T cells (E), CD8+ T cells and corresponding PD1 mean fluorescence intensity of CD44+CD8+ T cells (F), tumor-associated macrophages (TAMs) including CD86 + and CD206 + subtypes (G), CD11b+ and CD103+ dendritic cell subsets (H), and myeloid-derived suppressor cells (MDSCs) including polymorphonuclear (PMN-MDSCs) and mononuclear (M-MDSCs) subtypes (I). Differences were assessed by unpaired two-tailed t-test. Each dot represents an independent biological replicate (ΔS n = 6, ΔL n = 6). (J) UMAP of dendritic cell phenographs from ΔS or ΔL tumors. Known populations/states are circled. (K) Frequency of dendritic cells across phenographs in ΔS or ΔL tumors. (L) DAVID analysis of Gene Ontology Biological Processes enriched in ΔS-specific dendritic cells in Cluster 0 (green cluster in panel J). (M) UMAP of macrophage phenographs from ΔS or ΔL tumors. Known populations/states are circled. (N) Frequency of macrophages across phenographs in ΔS or ΔL tumors. (O) DAVID analysis of Gene Ontology Biological Processes enriched in ΔS-specific macrophages in clusters 0-2 (green, blue, and red clusters in panel M). (P) UMAP of B cell phenographs from ΔS or ΔL tumors. Known populations/states are circled. (Q) Frequency of B cells across phenographs in ΔS or ΔL tumors. (R) Enrichr analysis of the top Hallmark Pathways enriched in exhausted CD8 + T cells from ΔS and ΔL tumors. Source data
Extended Data Fig. 6 4C4 deletions alter the state of antigen presenting cells. (A-I) Immunophenotyping of infiltrating populations in ΔS and ΔL tumors. Frequency of CD45+ cells (A), CD11b+ cells (B), CD3e+ cells (C), CD19+ B cells (D), CD4+ T cells (E), CD8+ T cells and corresponding PD1 mean fluorescence intensity of CD44+CD8+ T cells (F), tumor-associated macrophages (TAMs) including CD86 + and CD206 + subtypes (G), CD11b+ and CD103+ dendritic cell subsets (H), and myeloid-derived suppressor cells (MDSCs) including polymorphonuclear (PMN-MDSCs) and mononuclear (M-MDSCs) subtypes (I). Differences were assessed by unpaired two-tailed t-test. Each dot represents an independent biological replicate (ΔS n = 6, ΔL n = 6). (J) UMAP of dendritic cell phenographs from ΔS or ΔL tumors. Known populations/states are circled. (K) Frequency of dendritic cells across phenographs in ΔS or ΔL tumors. (L) DAVID analysis of Gene Ontology Biological Processes enriched in ΔS-specific dendritic cells in Cluster 0 (green cluster in panel J). (M) UMAP of macrophage phenographs from ΔS or ΔL tumors. Known populations/states are circled. (N) Frequency of macrophages across phenographs in ΔS or ΔL tumors. (O) DAVID analysis of Gene Ontology Biological Processes enriched in ΔS-specific macrophages in clusters 0-2 (green, blue, and red clusters in panel M). (P) UMAP of B cell phenographs from ΔS or ΔL tumors. Known populations/states are circled. (Q) Frequency of B cells across phenographs in ΔS or ΔL tumors. (R) Enrichr analysis of the top Hallmark Pathways enriched in exhausted CD8 + T cells from ΔS and ΔL tumors. Source dataCC BY · PubMed Central
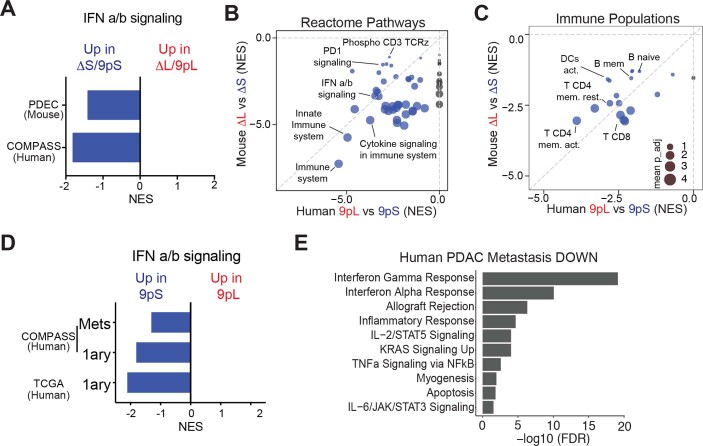
Extended Data Fig. 7 Conserved effects of human 9p21.3 and mouse 4C4 on PDAC immune infiltration. (A) GSEA enrichment scores (NES) of type I IFN signaling in mouse ΔS and human 9pS tumors compared to ΔL and 9pL tumors, respectively. (B) Comparison of GSEA NES scores for Reactome Pathways enriched in mouse ΔS (y axis) and human 9pS tumors (x axis). Highlighted are key pathways and immune populations enriched in IFN-proficient tumors. Circle size represents the adjusted p value (the scale is shown in panel C). Patient data is from primary tumors (9pS n = 37 patients and 9pL n = 28 patients). (C) Comparison of GSEA NES scores and Immune populations enriched in mouse ΔS (y axis) and human 9pS tumors (x axis). Highlighted are key immune populations enriched in IFN-proficient tumors. Circle size represents -log(adjusted p value). Patient data is from primary tumors (9pS n = 37 patients and 9pL n = 28 patients). (D) GSEA enrichment scores (NES) of type I IFN signaling in human primary (1ary) or metastatic (Mets) 9pS tumors compared to 9pL tumors from the COMPASS and TCGA datasets. (E) Hallmark pathways downregulated in human PDAC liver metastases vs. primary tumors. Data from Moffitt et al., 201572.
Extended Data Fig. 7 Conserved effects of human 9p21.3 and mouse 4C4 on PDAC immune infiltration. (A) GSEA enrichment scores (NES) of type I IFN signaling in mouse ΔS and human 9pS tumors compared to ΔL and 9pL tumors, respectively. (B) Comparison of GSEA NES scores for Reactome Pathways enriched in mouse ΔS (y axis) and human 9pS tumors (x axis). Highlighted are key pathways and immune populations enriched in IFN-proficient tumors. Circle size represents the adjusted p value (the scale is shown in panel C). Patient data is from primary tumors (9pS n = 37 patients and 9pL n = 28 patients). (C) Comparison of GSEA NES scores and Immune populations enriched in mouse ΔS (y axis) and human 9pS tumors (x axis). Highlighted are key immune populations enriched in IFN-proficient tumors. Circle size represents -log(adjusted p value). Patient data is from primary tumors (9pS n = 37 patients and 9pL n = 28 patients). (D) GSEA enrichment scores (NES) of type I IFN signaling in human primary (1ary) or metastatic (Mets) 9pS tumors compared to 9pL tumors from the COMPASS and TCGA datasets. (E) Hallmark pathways downregulated in human PDAC liver metastases vs. primary tumors. Data from Moffitt et al., 201572.CC BY · PubMed Central
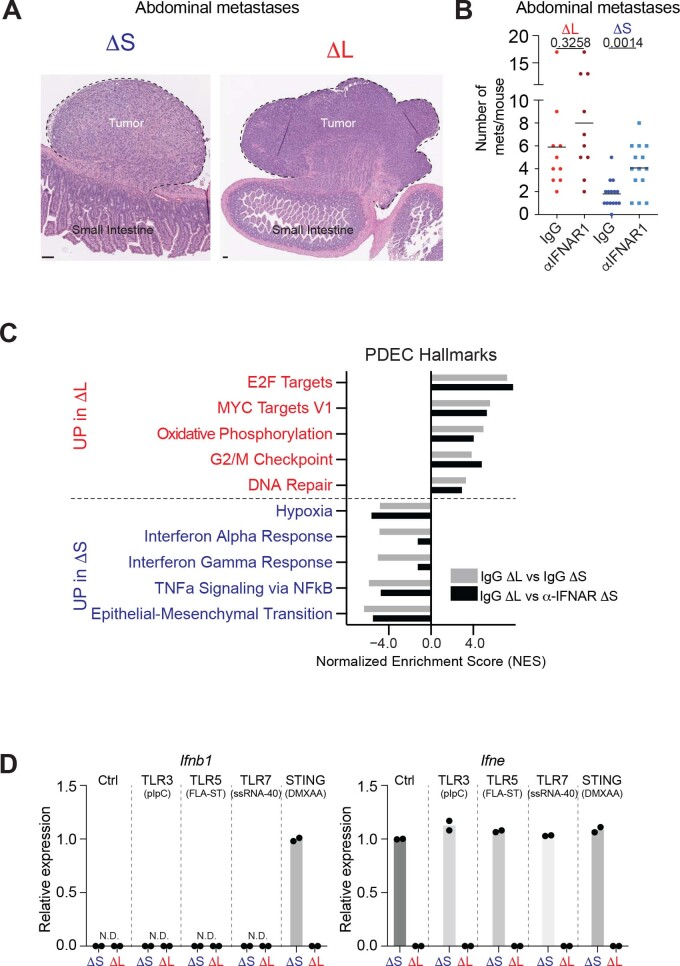
Extended Data Fig. 8 IFNAR1 blockade rescues immune editing and metastasis. (A) Representative H/E images of mesenteric lymph node metastases. Scale bar is 200 μm. (B) Quantification of mesenteric lymph node metastases in mice with the indicated genotypes of transplanted cells and antibody treatments. Differences were assessed by unpaired two-tailed t-test comparing IgG vs αIFNAR1 in the corresponding cell lines. Each dot represents an independent biological replicate (IgG ΔS n = 15, αIFNAR1 ΔS n = 14, IgG ΔL n = 10, αIFNAR1 ΔS n = 10). (C) IFNAR1 blockade specifically affects IFN signaling. NES scores of top 5 UP and DOWN Hallmark categories in tumors comparing ΔL vs ΔS (grey bars, data from Fig. 4C) and NES scores for the same Hallmark categories comparing ΔL vs α−IFNAR1 ΔS (black bars). (D) qRT-PCR measurements of mRNA levels for Ifnb1 and Ifne in ΔS and ΔL tumor-derived cells after the indicated treatments. Dots represent independent cell lines (n = 2). Source data
Extended Data Fig. 8 IFNAR1 blockade rescues immune editing and metastasis. (A) Representative H/E images of mesenteric lymph node metastases. Scale bar is 200 μm. (B) Quantification of mesenteric lymph node metastases in mice with the indicated genotypes of transplanted cells and antibody treatments. Differences were assessed by unpaired two-tailed t-test comparing IgG vs αIFNAR1 in the corresponding cell lines. Each dot represents an independent biological replicate (IgG ΔS n = 15, αIFNAR1 ΔS n = 14, IgG ΔL n = 10, αIFNAR1 ΔS n = 10). (C) IFNAR1 blockade specifically affects IFN signaling. NES scores of top 5 UP and DOWN Hallmark categories in tumors comparing ΔL vs ΔS (grey bars, data from Fig. 4C) and NES scores for the same Hallmark categories comparing ΔL vs α−IFNAR1 ΔS (black bars). (D) qRT-PCR measurements of mRNA levels for Ifnb1 and Ifne in ΔS and ΔL tumor-derived cells after the indicated treatments. Dots represent independent cell lines (n = 2). Source dataCC BY · PubMed Central
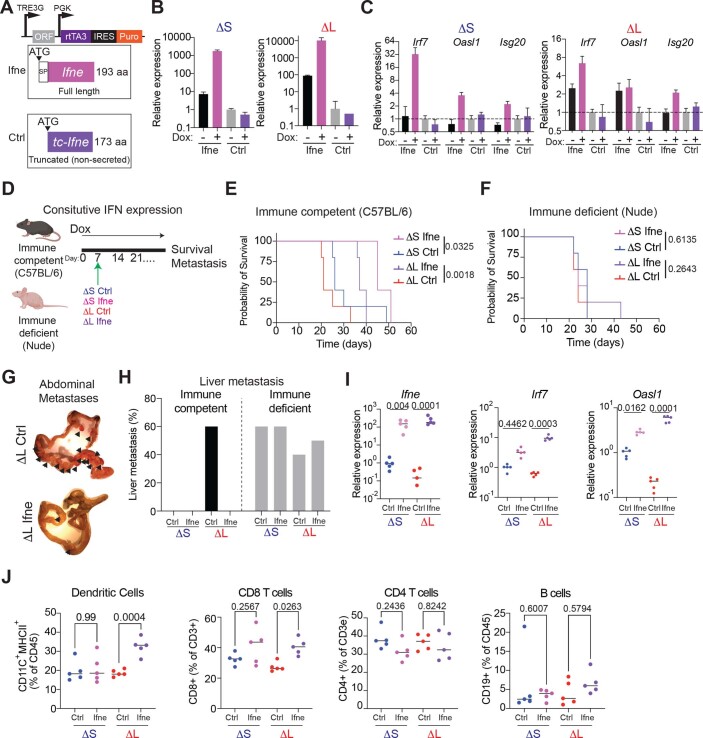
Extended Data Fig. 9 Ifne overexpression blunts metastasis by engaging adaptive immunity. (A) Design of the vector for doxycycline-inducible expression of full-length mouse Ifne or, as control, a truncated version lacking the signal peptide. (B) Representative RT-qPCR of Ifne expression in cells cultured -/+ doxycycline (2 μg/mL) for 72 hours. The assay specifically amplifies full-length Ifne. Bars represent median and upper/lower limits. Experiment was repeated n = 2 with similar results. (C) Representative RT-qPCR of IFN target genes (Irf7, Oasl1, Isg20) in cells cultured -/+ doxycycline (2 μg/mL) for 72 hours. Bars represent median and upper/lower limits. Experiment was repeated n = 2 with similar results. (D) Experimental design to test the role of sustained Ifne expression in immune competent and immune deficient mice. (E) Survival curve of immune competent mice orthotopically transplanted with Ctrl or Ifne overexpressing ΔS and ΔL cells. n = 5 independent biological replicates. Differences were assessed by log rank test. (F) Survival curve of immune deficient (nude) mice orthotopically transplanted with Ctrl or Ifne overexpressing ΔS and ΔL cells. n = 5 independent biological replicates. Differences were assessed by log rank test. (G) Representative image of an intestine from a mouse with sustained expression of Ctrl or full-length Ifne ΔL cells at endpoint. Arrowheads point to macrometastases in the mesentery and intestine. (H) Incidence of overt liver metastasis in immune proficient and immune deficient hosts transplanted with ΔS or ΔL cells expressing Ctrl or full-length Ifne (n = 5 independent biological replicates). (I) RT-qPCR of Ifne, Irf7, and Oasl1 in tumors from immune competent mice treated with doxycycline for 1 week before tumor analysis. Each dot represents a tumor from an independent mouse (n = 5 independent biological replicates). Differences were assessed by one-way ANOVA followed by Sidak’s multiple comparison test. (J) Frequency of dendritic cells (far left), CD8 T cells (left), CD4 T cells (right), and B cells (far right) are shown. Each dot represents a tumor from an independent mouse (n = 5 independent biological replicates). Differences were assessed by one-way ANOVA followed by Sidak’s multiple comparison test. Source data
Extended Data Fig. 9 Ifne overexpression blunts metastasis by engaging adaptive immunity. (A) Design of the vector for doxycycline-inducible expression of full-length mouse Ifne or, as control, a truncated version lacking the signal peptide. (B) Representative RT-qPCR of Ifne expression in cells cultured -/+ doxycycline (2 μg/mL) for 72 hours. The assay specifically amplifies full-length Ifne. Bars represent median and upper/lower limits. Experiment was repeated n = 2 with similar results. (C) Representative RT-qPCR of IFN target genes (Irf7, Oasl1, Isg20) in cells cultured -/+ doxycycline (2 μg/mL) for 72 hours. Bars represent median and upper/lower limits. Experiment was repeated n = 2 with similar results. (D) Experimental design to test the role of sustained Ifne expression in immune competent and immune deficient mice. (E) Survival curve of immune competent mice orthotopically transplanted with Ctrl or Ifne overexpressing ΔS and ΔL cells. n = 5 independent biological replicates. Differences were assessed by log rank test. (F) Survival curve of immune deficient (nude) mice orthotopically transplanted with Ctrl or Ifne overexpressing ΔS and ΔL cells. n = 5 independent biological replicates. Differences were assessed by log rank test. (G) Representative image of an intestine from a mouse with sustained expression of Ctrl or full-length Ifne ΔL cells at endpoint. Arrowheads point to macrometastases in the mesentery and intestine. (H) Incidence of overt liver metastasis in immune proficient and immune deficient hosts transplanted with ΔS or ΔL cells expressing Ctrl or full-length Ifne (n = 5 independent biological replicates). (I) RT-qPCR of Ifne, Irf7, and Oasl1 in tumors from immune competent mice treated with doxycycline for 1 week before tumor analysis. Each dot represents a tumor from an independent mouse (n = 5 independent biological replicates). Differences were assessed by one-way ANOVA followed by Sidak’s multiple comparison test. (J) Frequency of dendritic cells (far left), CD8 T cells (left), CD4 T cells (right), and B cells (far right) are shown. Each dot represents a tumor from an independent mouse (n = 5 independent biological replicates). Differences were assessed by one-way ANOVA followed by Sidak’s multiple comparison test. Source dataCC BY · PubMed Central
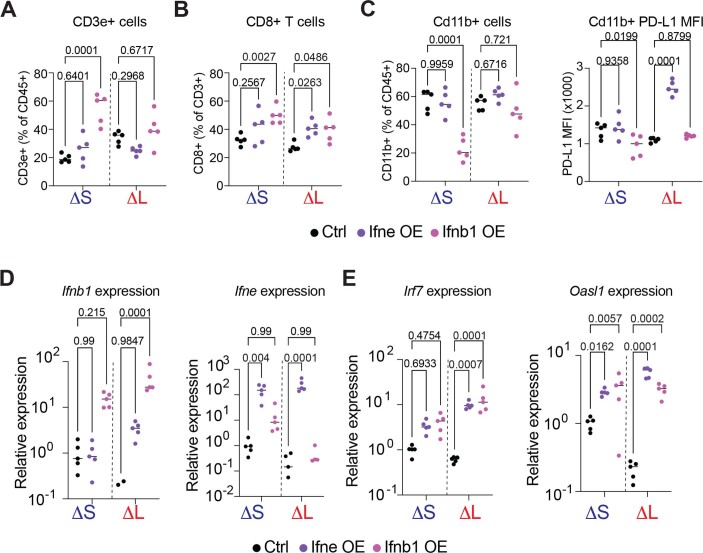
Extended Data Fig. 10 Ifne and Ifnb1 show distinct effects on immune infiltrating cells. (A) Frequency of T cells (CD3e + ). Differences were assessed by one-way ANOVA followed by Sidak’s multiple comparison to the respective control population. Each dot is a tumor from an independent mouse (n = 5 independent biological replicates). (B) Frequency of CD8 + T cells from ΔS and ΔL tumors treated for one week with Dox. Differences were assessed by one-way ANOVA followed by Sidak’s multiple comparison to the respective control population. Each dot is a tumor from an independent mouse (n = 5 independent biological replicates). Control and Ifne data are also used in Extended Data Fig. 9J. (C) (Left) Frequency of CD11B + cells (CD11B + CD3e-); (Right) Median PD-L1 surface expression in CD11B + cells, from ΔS and ΔL tumors treated for one week with Dox. Differences were assessed by one-way ANOVA followed by Sidak’s multiple comparison to the respective control population. Each dot is a tumor from an independent mouse (n = 5 independent biological replicates). Control and Ifne data are used in Extended Data Fig. 9J. (D-E) Relative expression of Ifnb1, Ifne (D); Irf7, and Oasl1 (E) in ΔS and ΔL tumors with add-back of Ifnb1, Ifne, or control construct. Differences were assessed by one-way ANOVA followed by Sidak’s multiple comparison to the respective control population. Each dot is a tumor from an independent mouse (n = 5 independent biological replicates). Control and Ifne data are also used in Extended Data Fig. 9. Source data
Extended Data Fig. 10 Ifne and Ifnb1 show distinct effects on immune infiltrating cells. (A) Frequency of T cells (CD3e + ). Differences were assessed by one-way ANOVA followed by Sidak’s multiple comparison to the respective control population. Each dot is a tumor from an independent mouse (n = 5 independent biological replicates). (B) Frequency of CD8 + T cells from ΔS and ΔL tumors treated for one week with Dox. Differences were assessed by one-way ANOVA followed by Sidak’s multiple comparison to the respective control population. Each dot is a tumor from an independent mouse (n = 5 independent biological replicates). Control and Ifne data are also used in Extended Data Fig. 9J. (C) (Left) Frequency of CD11B + cells (CD11B + CD3e-); (Right) Median PD-L1 surface expression in CD11B + cells, from ΔS and ΔL tumors treated for one week with Dox. Differences were assessed by one-way ANOVA followed by Sidak’s multiple comparison to the respective control population. Each dot is a tumor from an independent mouse (n = 5 independent biological replicates). Control and Ifne data are used in Extended Data Fig. 9J. (D-E) Relative expression of Ifnb1, Ifne (D); Irf7, and Oasl1 (E) in ΔS and ΔL tumors with add-back of Ifnb1, Ifne, or control construct. Differences were assessed by one-way ANOVA followed by Sidak’s multiple comparison to the respective control population. Each dot is a tumor from an independent mouse (n = 5 independent biological replicates). Control and Ifne data are also used in Extended Data Fig. 9. Source dataCC BY · PubMed Central

Verification

Claims the paper makes

The claims and statistics of this paper haven’t been checked yet.

Run the check — free, no account needed. It reads the open-access text and checks the sources it cites.

A few free checks a day · papers already verified open instantly · results are public

Claims other papers make about this one

Each is checked against this paper’s own text: does it say what the citing paper says it does?

Self-check

Percentages, sums and reported differences re-computed from the paper’s own numbers.

The self-check needs the paper’s full text.

Citations

Cites

Cited by

Sorted by citations

See all 125

Metadata

Authors
Barriga, F. M., Tsanov, K. M., Ho, Y.-J., Sohail, N., Zhang, A., Baslan, T., Wuest, A. N., Del Priore, I., Meškauskaitė, B., Livshits, G., Alonso-Curbelo, D., Simon, J., Chaves-Perez, A., Bar-Sagi, D., Iacobuzio-Donahue, C. A., Notta, F., Chaligne, R., Sharma, R., Pe’er, D., & Lowe, S. W.
Affiliations
  • Memorial Sloan Kettering Cancer Center (US)
  • Ontario Institute for Cancer Research (CA)
Corresponding author
Lowe, Scott W.
Venue
Nature Cancer
Published
2022-11-07
Volume
3
Issue
11
Pages
1367-1385
ISSN
2662-1347 (ISSN-L)
OpenAlex
W4308458365
Cited by
125
References
82
Citations by year
2026: 28 · 2025: 35 · 2024: 40 · 2023: 21 · 2022: 1
FWCI
9.24
Type
journal article
Language
en
Open access
Locations
  • Nature Cancer (publishedVersion, cc-by)
  • PubMed Central (publishedVersion, cc-by)
  • PubMed (publishedVersion)
  • Cold Spring Harbor Laboratory Institutional Repository (Cold Spring Harbor Laboratory) (acceptedVersion)
Funders
  • Howard Hughes Medical Institute (P30 CA08748)
  • Jane Coffin Childs Memorial Fund for Medical Research
  • Memorial Sloan-Kettering Cancer Center (P30-CA08748)
  • Edward P. Evans Foundation
  • Cycle for Survival
  • Marie-Josée and Henry R. Kravis Center for Molecular Oncology
  • National Cancer Institute (T32CA160001, CA08748, P01CA013106, P30CA008748)
Topics
  • Life Sciences › Immunology and Microbiology › Immunology › interferon and immune responses
  • Health Sciences › Medicine › Oncology › Cancer Immunotherapy and Biomarkers
  • Life Sciences › Biochemistry, Genetics and Molecular Biology › Molecular Biology › Chromatin Remodeling and Cancer
Keywords
chromosome 9p21.3, CDKN2A/B, homozygous deletion, interferon epsilon, immune evasion, metastasis, immunotherapy resistance, tumor microenvironment, type I interferon signaling, pancreatic cancer, machete, syngeneic mouse model, tumor suppressor inactivation
MeSH terms
Animals, Chromosome Deletion, Chromosomes, Interferons, Neoplasms, Tandem Repeat Sequences, Mice, Immune Evasion, Tumor Microenvironment

About these checks

Registry, retraction, Cites and statistics results are computed, not judged, with one exception: a printed reference that no index lists is read once by a model before it counts as a citation error. Claims are extracted by a model and kept only when their quote appears verbatim in the text; each cited source is then checked, with a model’s help, for whether it says what the claim relies on. Those verdicts can be wrong — read the claim’s quote and the cited source before relying on one.

Statistics and arithmetic are recomputed, not judged.

Confidence bands are shown only for fields calibrated on our annotated test set. None is calibrated yet, so no band is shown.

What counts as a claim ›How we measure confidence ›How we check this ›

Are you an author, or do you see a problem with this page? Request a review