

The DOI matches its Crossref record; 106 of the 110 references it cites were found in a registry or an index.
Aging clocks based on accumulating stochastic variation
Open accessPublished version of a preprint
Abstract
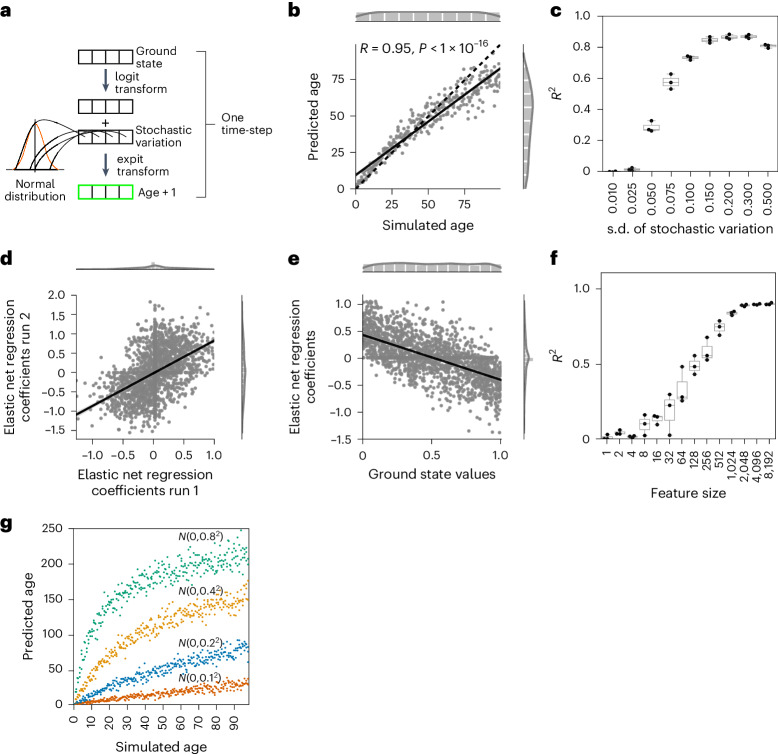
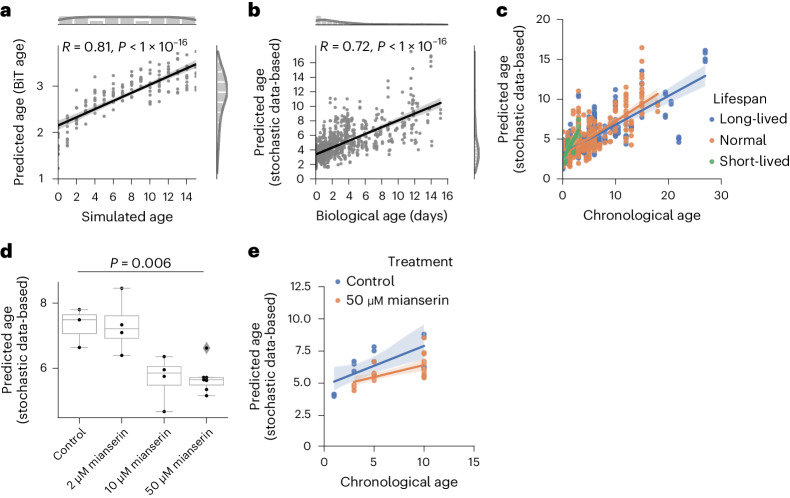
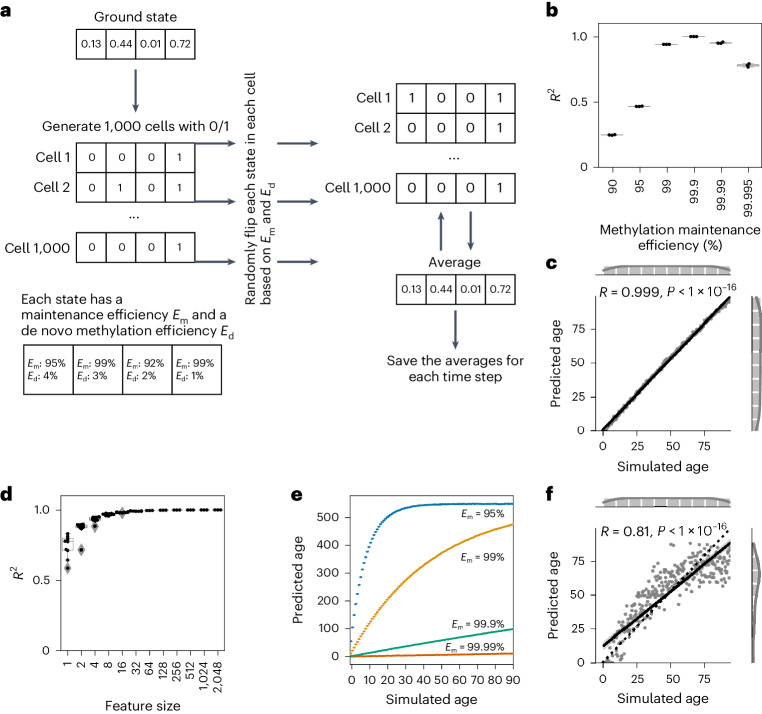
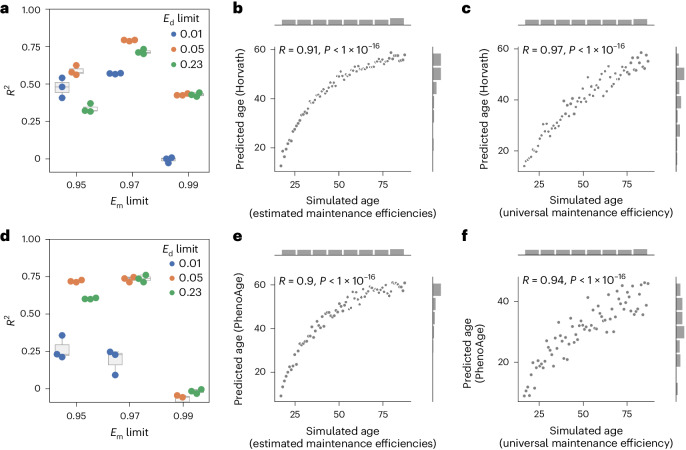
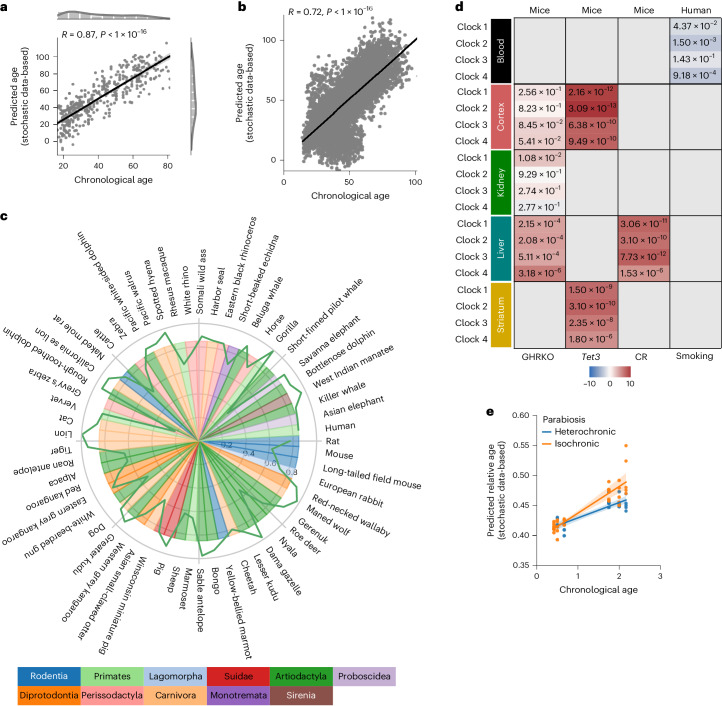
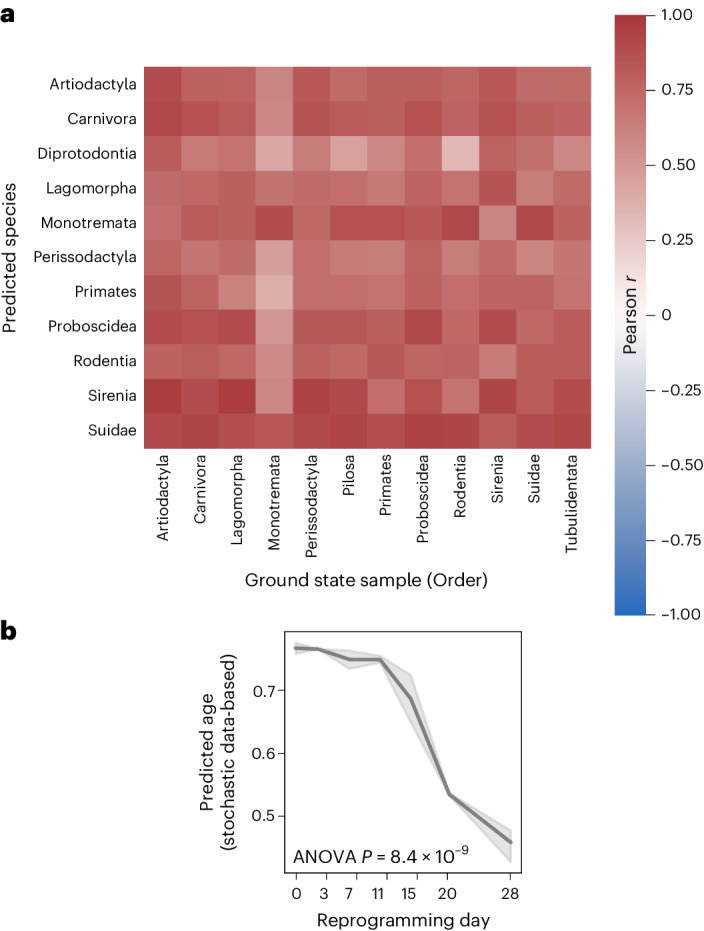
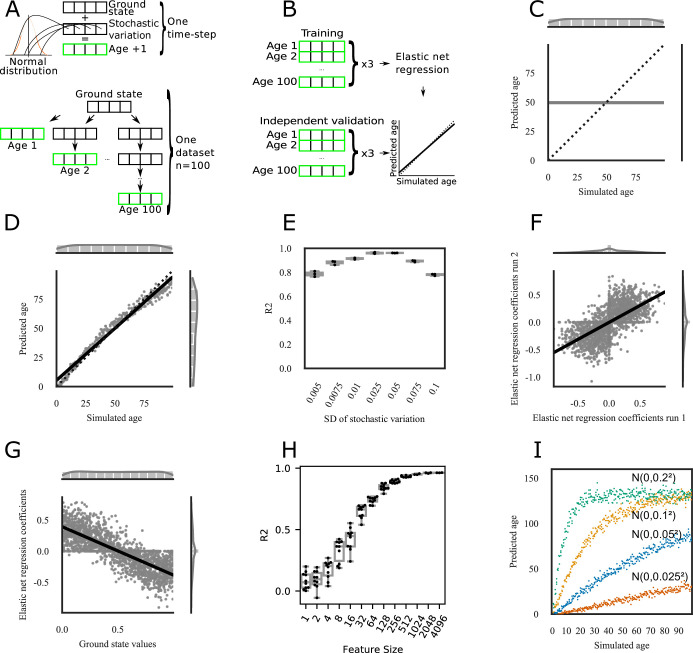
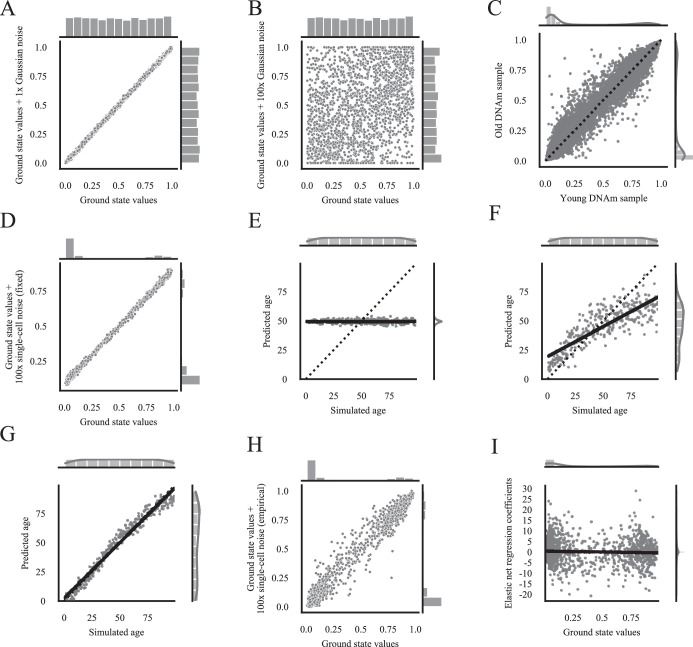
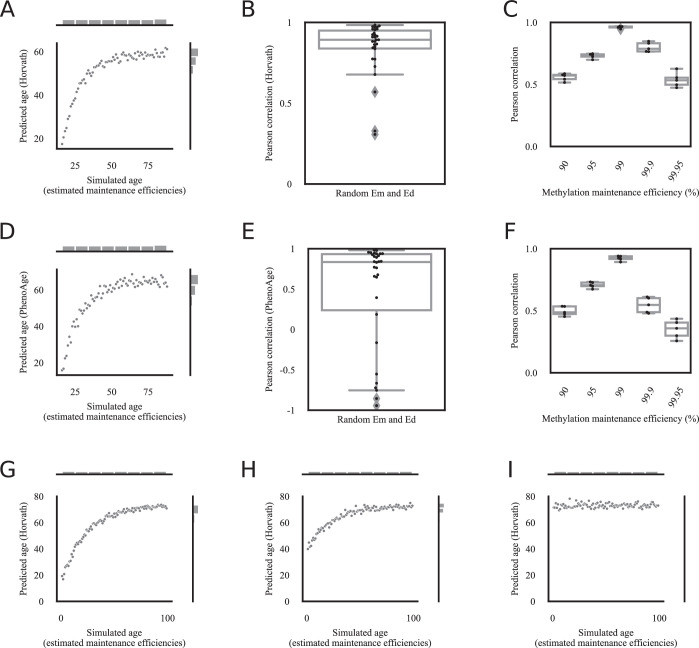
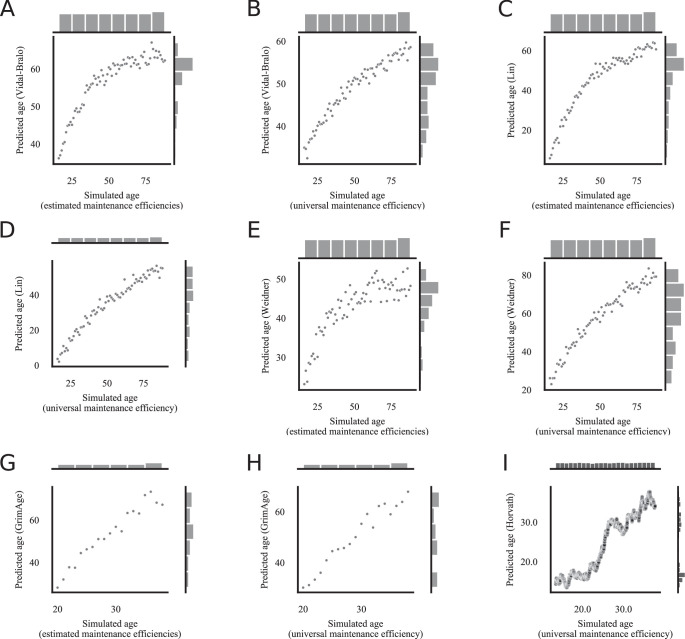
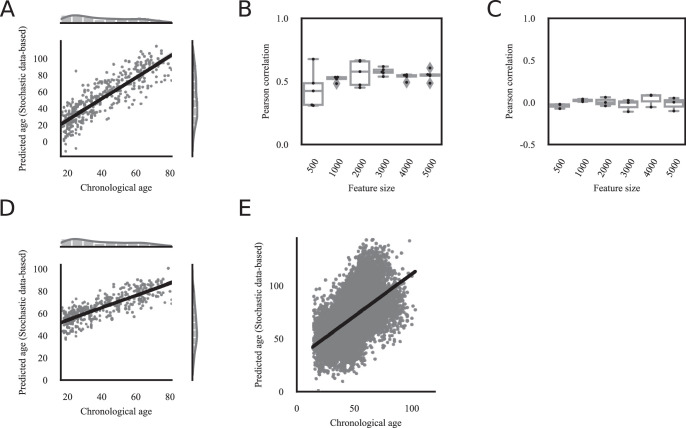
Aging clocks have provided one of the most important recent breakthroughs in the biology of aging, and may provide indicators for the effectiveness of interventions in the aging process and preventive treatments for age-related diseases. The reproducibility of accurate aging clocks has reinvigorated the debate on whether a programmed process underlies aging. Here we show that accumulating stochastic variation in purely simulated data is sufficient to build aging clocks, and that first-generation and second-generation aging clocks are compatible with the accumulation of stochastic variation in DNA methylation or transcriptomic data. We find that accumulating stochastic variation is sufficient to predict chronological and biological age, indicated by significant prediction differences in smoking, calorie restriction, heterochronic parabiosis and partial reprogramming. Although our simulations may not explicitly rule out a programmed aging process, our results suggest that stochastically accumulating changes in any set of data that have a ground state at age zero are sufficient for generating aging clocks.
Overview
The claims and statistics of this paper haven’t been checked yet.
Run the check — free, no account needed. It reads the open-access text and checks the sources it cites.
Integrity signals
Registry
Cites
Statistics
Figures
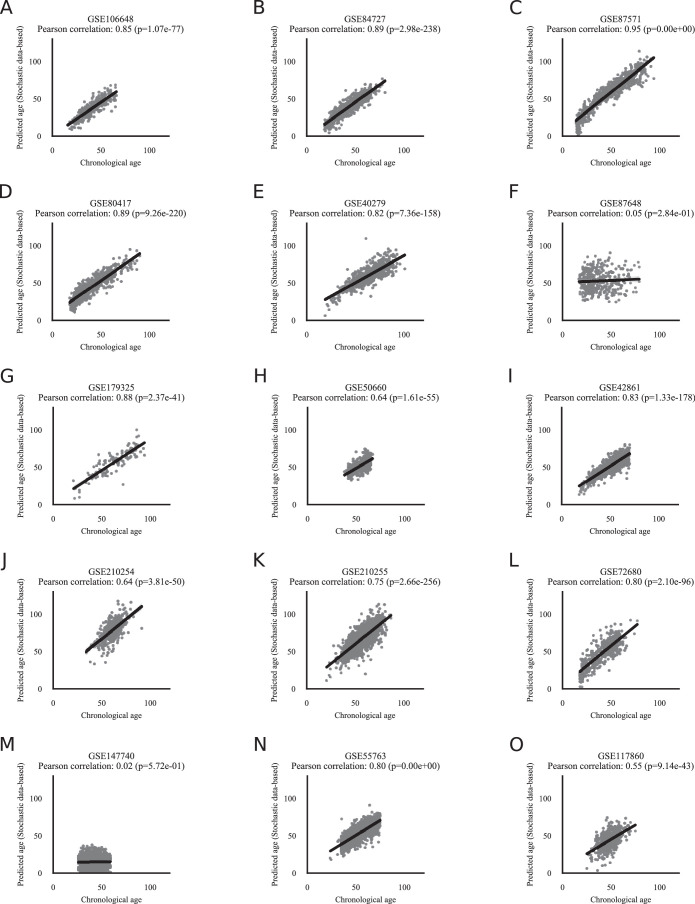
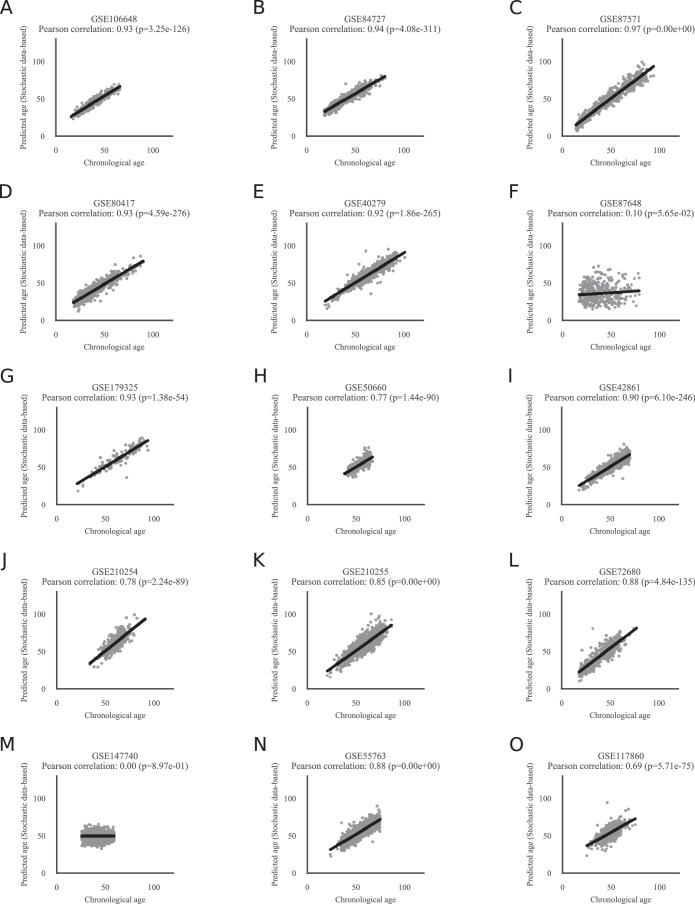
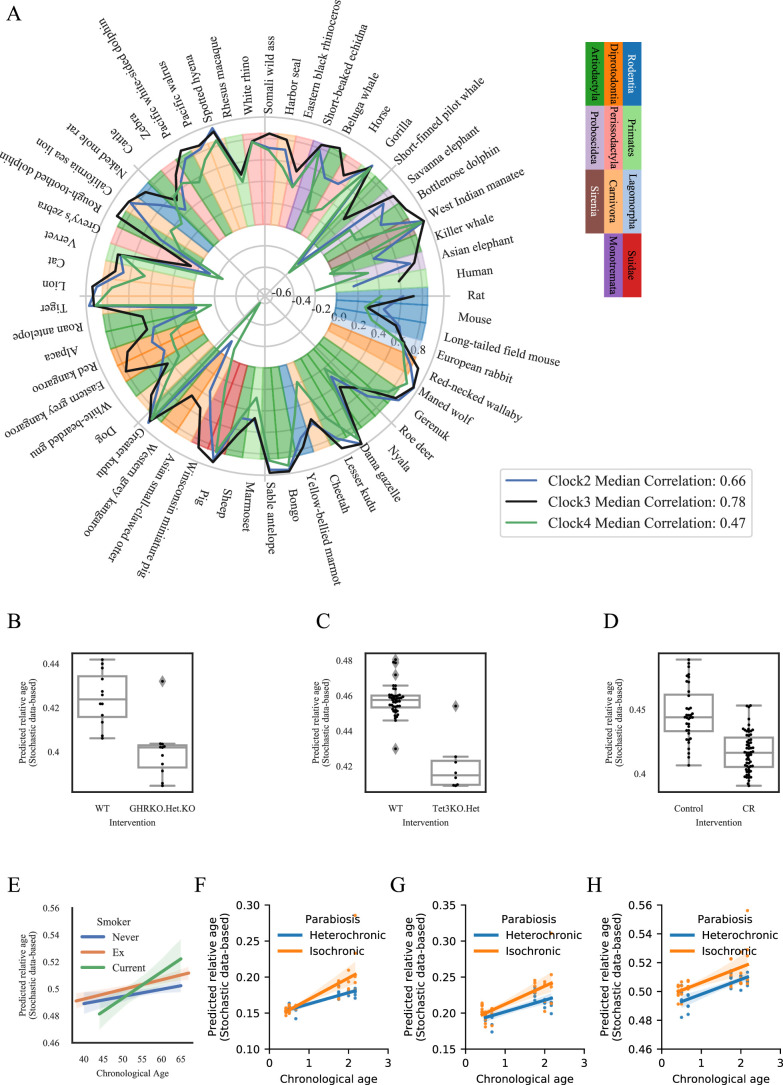
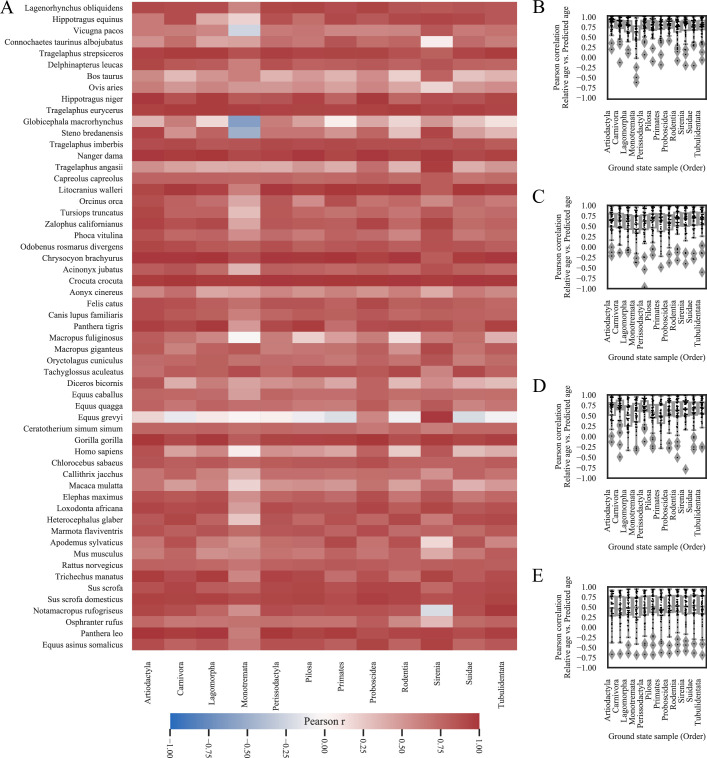
Verification
Claims the paper makes
The claims and statistics of this paper haven’t been checked yet.
Run the check — free, no account needed. It reads the open-access text and checks the sources it cites.
Self-check
Percentages, sums and reported differences re-computed from the paper’s own numbers.
The self-check needs the paper’s full text.
Citations
Cites
Scikit-learn: Machine Learning in Python
Pedregosa, F., Varoquaux, G., Gramfort, A., Michel, V., Thirion, B., Grisel, O., Blondel, M., Müller, A., Nothman, J., Louppe, G., et al. (2012) · arXiv · doi:10.48550/arxiv.1201.0490 · Cited by 71,016
Matplotlib: a 2D graphics environment
Hunter, J. D. (2007) · Computing in Science & Engineering · doi:10.1109/mcse.2007.55 · Cited by 39,249
SciPy 1.0: fundamental algorithms for scientific computing in Python
Virtanen, P., Gommers, R., Oliphant, T. E., Haberland, M., Reddy, T., Cournapeau, D., Burovski, E., Peterson, P., Weckesser, W., Bright, J., et al. (2020) · Nature Methods · doi:10.1038/s41592-019-0686-2 · Cited by 38,430
fastp: an ultra-fast all-in-one FASTQ preprocessor
Chen, S., Zhou, Y., Chen, Y., & Gu, J. (2018) · Bioinformatics · doi:10.1093/bioinformatics/bty560 · Cited by 29,721
Harris, C. R., Millman, K. J., van der Walt, S. J., Gommers, R., Virtanen, P., Cournapeau, D., Wieser, E., Taylor, J., Berg, S., Smith, N. J., et al. (2020) · Nature · doi:10.1038/s41586-020-2649-2 · Cited by 23,826
Harris, C., Millman, K., van der Walt, S., Gommers, R., Virtanen, P., Cournapeau, D., Wieser, E., Taylor, J., Berg, S., Smith, N., et al. (2020) · RePEc: Research Papers in Economics · Cited by 17,844
Salmon provides fast and bias-aware quantification of transcript expression
Patro, R., Duggal, G., Love, M. I., Irizarry, R. A., & Kingsford, C. (2017) · Nature Methods · doi:10.1038/nmeth.4197 · Cited by 12,700
SciPy 1.0: fundamental algorithms for scientific computing in Python
Virtanen, P., Gommers, R., Oliphant, T. E., Haberland, M., Reddy, T., Cournapeau, D., Burovski, E., Peterson, P., Weckesser, W., Bright, J., et al. (2019) · Apollo - University of Cambridge Repository · doi:10.17863/cam.64134 · Cited by 10,460
Exact stochastic simulation of coupled chemical reactions
Gillespie, D. T. (1977) · The Journal of Physical Chemistry · doi:10.1021/j100540a008 · Cited by 10,172
seaborn: statistical data visualization
Waskom, M. (2021) · Journal of Open Source Software · doi:10.21105/joss.03021 · Cited by 7,310
Cited by
Sorted by citations
Items 101–128 of 128
Quintela-Fandiño, M., Garma, L. D., Pernas, S., Baz, D. V., García-Campelo, R., Terrasa, J., Colomer, R., Jiménez, D., Vera, R., Bermejo, B., et al. (2025) · Research Square · doi:10.21203/rs.3.rs-6222303/v1
Fisher Information and the Dynamics of Multicellular Ageing
Hale, Z. F., Cánez, G. A., & Michaels, T. C. T. (2025) · Entropy · doi:10.3390/e27060638
Transcriptomic entropy reveals tissue-specific patterns in aging and predicts cancer progressionPreprint
dos Santos, G. A., Castro, J. P., & Galante, P. A. F. (2025) · bioRxiv (Cold Spring Harbor Laboratory) · doi:10.1101/2025.06.29.662218
The Bioelectrics of Immortality and Mortality in Cold-Sensitive Hydra oligactis
Kapsetaki, S. E., Pimkina, A., McMillen, P. T., Tayyebi, P., Erickson, P., & Levin, M. G. (2025) · Bioelectricity · doi:10.1089/bioe.2025.0002
Defining Longevity Medicine: Biomedical and Digital Aspects
Erat, A. (2025) · Sustainable finance · doi:10.1007/978-3-031-95870-0_6
Patel, T., Schwarz, R. J., Riege, K., Varshavsky, M., Kestler, H. A., Kaplan, T., Hoffmann, S., & van Bömmel, A. (2025) · bioRxiv (Cold Spring Harbor Laboratory) · doi:10.1101/2025.10.07.680024
WITHDRAWN: Mammalian longevity is associated with restricted epithelial plasticityPreprint
Zheng, Z. (2025) · bioRxiv (Cold Spring Harbor Laboratory) · doi:10.1101/2025.10.22.683248
Ostermann, P. N., Wu, Y., Bowler, S. A., Martínez-Meza, S., Siddiqui, M. A., Meyer, D. H., Herrera, A. M., Sealy, B. A., Sidharta, M., Ramnarine, K., et al. (2025) · JCI Insight · doi:10.1172/jci.insight.190445
Self-citationAnand, A., Agarwal, Y., Gupta, T., Lin, J., Ghemrawi, M., Gerhard, G. S., & Lee, H. (2025) · BMC Genomics · doi:10.1186/s12864-025-12271-9 · Cited by 1
Pan‐Epigenetic Age Prediction in Mammals
Koch, Z., Li, A., & Ideker, T. (2026) · Aging Cell · doi:10.1111/acel.70380
Matrenok, S. S., Andrianova, E. L., Avchaciov, K., Fleyshman, D. I., Huson, H. J., Loftus, J. P., Wakshlag, J. J., Zhang, B., Gladyshev, V. N., Gudkov, A. V., et al. (2026) · bioRxiv (Cold Spring Harbor Laboratory) · doi:10.64898/2026.02.10.705136
How Somatic Mutations cause Aging without Causing AgingPreprint
Wolf, A. M. (2026) · SSRN Electronic Journal · doi:10.2139/ssrn.6431458
Toward actionable interventions in human aging (12th ARDD meeting, 2025)
Dekan, A., Lore, S., Yoon, Y. E., Sjöholm, A., Tyshkovskiy, A., Terskikh, A. V., Cuervo, A. M., Georgievskaya, A., Heinz, A., Seluanov, A., et al. (2026) · Aging · doi:10.18632/aging.206368
Self-citationAgeing liver in the era of MASLD: risks, mechanisms and treatment opportunities
Alqahtani, S. A., Schneider, C. V., & Schattenberg, J. M. (2026) · Frontline Gastroenterology · doi:10.1136/flgastro-2026-103677
Physiological Age and Homeostatic Dysregulation Following Child Maltreatment in Youth
Ye, Q., Apsley, A. T., Etzel, L. C., Hastings, W. J., Chiaro, C. R., Schreier, H. M. C., Claus, E. D., Cohen, A. A., Fisher, Z. F., Heim, C. M., et al. (2026) · Molecular Psychiatry · doi:10.1038/s41380-026-03642-z
A unifying model of stem cell dynamics explains age-related methylation patterns across mammals
Crofts, S., Grenko, C. M., Marioni, R. E., Crespo, E. L., & Chandra, T. (2026) · Nature Aging · doi:10.1038/s43587-026-01125-y
Bhat, A. S., & Kokko, H. (2026) · bioRxiv (Cold Spring Harbor Laboratory) · doi:10.64898/2026.05.25.727614 · Cited by 1
Lee, H., Ye, Z., Yang, Y., Pan, Y., Maron, B., Wang, Z., Kochunov, P., Thompson, P. M., Hong, L. E., Ma, T., et al. (2026) · bioRxiv (Cold Spring Harbor Laboratory) · doi:10.64898/2026.05.27.728155
Mozhui, K., Starlard‐Davenport, A., Sun, Y., Shadyab, A. H., Casanova, R., Thomas, F., Wallace, R. B., Fowke, J. H., & Johnson, K. (2026) · Clinical Epigenetics · doi:10.1186/s13148-026-02180-3 · Cited by 1
Why we age – Integrating error, program, and selective pressure
Wagner, W. (2026) · Ageing Research Reviews · doi:10.1016/j.arr.2026.103213 · Cited by 1
Enhancing the performance and interpretability of epigenetic clocks
Patel, T., Schwarz, R. J., Riege, K., Varshavsky, M., Richmond, A., Marioni, R. E., Kestler, H. A., Kaplan, T., Hoffmann, S., & van Bömmel, A. (2026) · Nucleic Acids Research · doi:10.1093/nar/gkag661
Regulatory Bias Constrains Epigenetic Aging TrajectoriesPreprint
Morozova, T., Axelson-Fisk, M., & Polster, A. (2026) · bioRxiv (Cold Spring Harbor Laboratory) · doi:10.64898/2026.07.22.740004
Du, Z., Luo, Q., Guo, X., Peng, Q., Li, Z., Huang, D., Singh, R., Wang, S., Marioni, R. E., & Teschendorff, A. E. (2026) · Research Square · doi:10.21203/rs.3.rs-10584417/v1
Expression trajectories in the aging male mouse colon transcriptomePreprint
Olecka, M., Riege, K., Haase, M., Schwarz, R. J., Wang, C., Best, L., Witte, O., Kaleta, C., Frahm, C., & Hoffmann, S. (2026) · bioRxiv (Cold Spring Harbor Laboratory) · doi:10.64898/2026.10.01.756139
Bartoszewicz, M., & Niemczyk, M. (2026) · Aging · doi:10.18632/aging.206426
Cao, L., Chen, Y., Zhang, W., Jiang, H., Huang, H., Xu, Y., Li, X., Xu, W. L., Qian, K., & Pu, J. (2026) · Science Translational Medicine · doi:10.1126/scitranslmed.adz4815
Testing the Hypothesis of Centriolar Entropy as a Source of Transcriptomic Aging-Clock Signal
Tkemaladze, J. (2026) · Longevity Horizon · doi:10.65649/hreta9r8 · Cited by 2
Cai, H., Cai, H., Cai, T., Zhao, H., Wang, Q., Liu, C., Wu, W., & Cai, X. (2026) · Metabolites · doi:10.3390/metabo16100795
Metadata
- Authors
- Meyer, D. H., & Schumacher, B.
- Affiliations
- University of Cologne (DE)
- Corresponding author
- Meyer, David H.
- Schumacher, Björn
- Venue
- Nature Aging
- Published
- 2024-05-09
- Volume
- 4
- Issue
- 6
- Pages
- 871-885
- ISSN
- 2662-8465 (ISSN-L)
- PMC
- PMC11186771
- OpenAlex
- W4396761662
- Cited by
- 128
- References
- 110
- Citations by year
- 2026: 43 · 2025: 60 · 2024: 21
- FWCI
- 14.96
- Type
- journal article
- Language
- en
- Open access
- hybrid
- doi.org
- Locations
- Nature Aging (publishedVersion, cc-by)
- Research Square (acceptedVersion, cc-by)
- PubMed Central (publishedVersion, cc-by)
- PubMed (publishedVersion)
- Funders
- EC | Horizon 2020 Framework Programme (H2020-MSCA-ITN-2018 (Healthage and ADDRESS ITNs))
- John Templeton Foundation (61734)
- Topics
- Life Sciences › Biochemistry, Genetics and Molecular Biology › Aging › Genetics, Aging, and Longevity in Model Organisms
- Life Sciences › Biochemistry, Genetics and Molecular Biology › Molecular Biology › Epigenetics and DNA Methylation
- Life Sciences › Biochemistry, Genetics and Molecular Biology › Cell Biology › Telomeres, Telomerase, and Senescence
- Keywords
- aging clocks, stochastic variability, biological age, chronological age, DNA methylation, transcriptomics, programmed aging, heterochronic parabiosis, caloric restriction, partial reprogramming, smoking, age-related diseases
- MeSH terms
- Aging, Animals, Biological Clocks, Computer Simulation, Humans, Male, Models, Biological, Parabiosis, Smoking, Stochastic Processes, DNA Methylation, Caloric Restriction, Transcriptome
About these checks
Registry, retraction, Cites and statistics results are computed, not judged, with one exception: a printed reference that no index lists is read once by a model before it counts as a citation error. Claims are extracted by a model and kept only when their quote appears verbatim in the text; each cited source is then checked, with a model’s help, for whether it says what the claim relies on. Those verdicts can be wrong — read the claim’s quote and the cited source before relying on one.
Statistics and arithmetic are recomputed, not judged.
Confidence bands are shown only for fields calibrated on our annotated test set. None is calibrated yet, so no band is shown.
What counts as a claim ›How we measure confidence ›How we check this ›
Are you an author, or do you see a problem with this page? Request a review
