

The DOI matches its Crossref record; 87 of the 87 references it cites were found in a registry or an index.
A quantitative uncertainty metric controls error in neural network-driven chemical discovery
Open accessPublished version of a preprint
Abstract
A predictive approach for driving down machine learning model errors is introduced and demonstrated across discovery for inorganic and organic chemistry.
Overview
The claims and statistics of this paper haven’t been checked yet.
Run the check — free, no account needed. It reads the open-access text and checks the sources it cites.
Integrity signals
Registry
Cites
Statistics
Figures
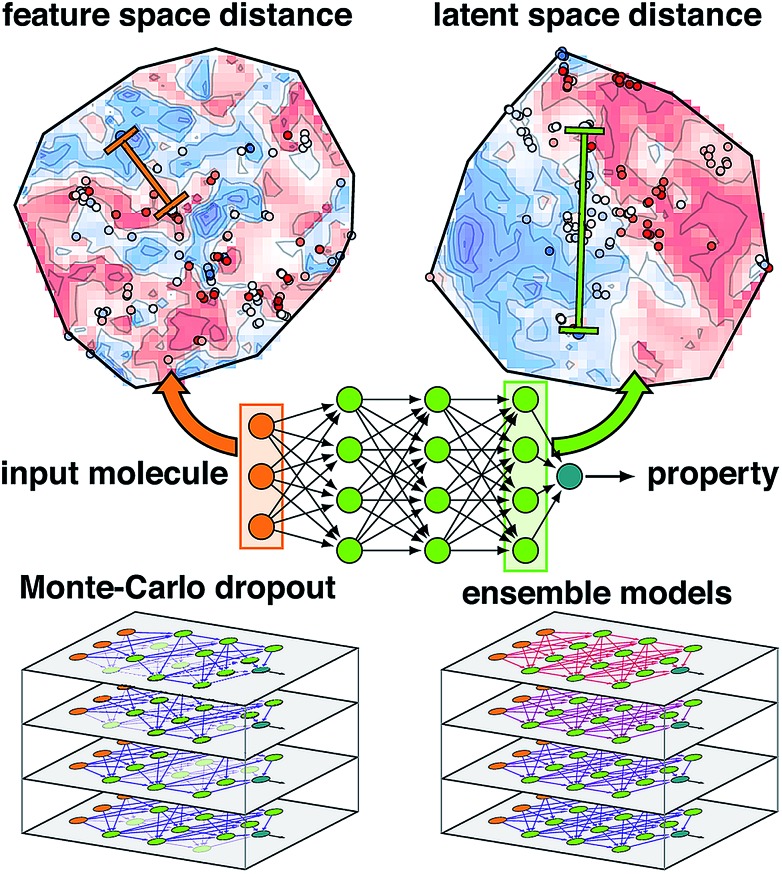
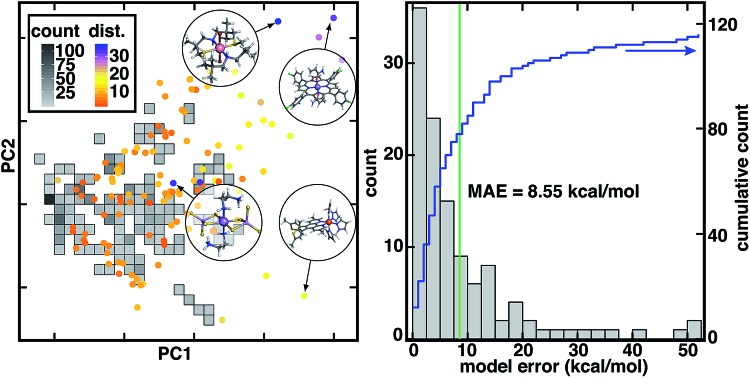
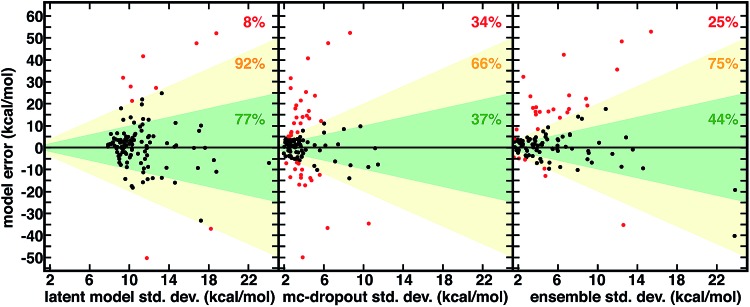
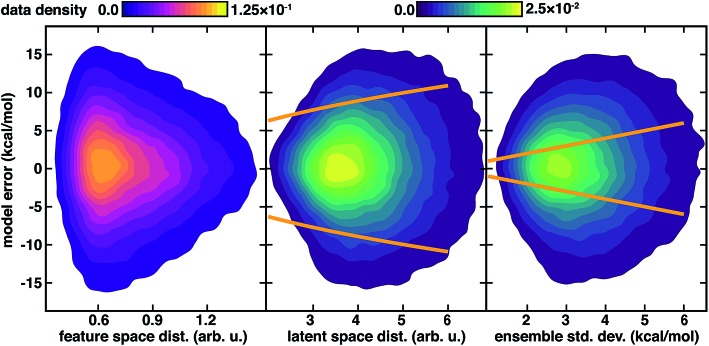
Verification
Claims the paper makes
The claims and statistics of this paper haven’t been checked yet.
Run the check — free, no account needed. It reads the open-access text and checks the sources it cites.
Claims other papers make about this one
Each is checked against this paper’s own text: does it say what the citing paper says it does?
The source backs part of the claim, not all of it — or backs it for a different population, condition or comparison.
In the citing paper
“Incorporation of OHLDB compounds reduced errors of ML models (i.e., ANNs) on experimental (i.e., CSD) complexes by approximately 25% (26,46).”
From Machine Learning for the Discovery, Design, and Engineering of Materials. (2022) · cites this paper as [46]
Experimental — accuracy not yet measured
Self-check
Percentages, sums and reported differences re-computed from the paper’s own numbers.
The self-check needs the paper’s full text.
Citations
Cites
Density-functional thermochemistry. III. The role of exact exchange
Becke, A. D. (1993) · The Journal of Chemical Physics · doi:10.1063/1.464913 · Cited by 103,767
Lee, C., Yang, W., & Parr, R. G. (1988) · Physical Review B · doi:10.1103/physrevb.37.785 · Cited by 100,874
Gradient-based learning applied to document recognition
Lecun, Y., Bottou, L., Bengio, Y., & Haffner, P. (1998) · Proceedings of the IEEE · doi:10.1109/5.726791 · Cited by 58,805
(2008) · Journal of Machine Learning Research · Cited by 33,051
Stephens, P. J., Devlin, F. J., Chabalowski, C. F., & Frisch, M. J. (1994) · The Journal of Physical Chemistry · doi:10.1021/j100096a001 · Cited by 23,329
Proceedings of IEEE Conference on Computer Vision and Pattern Recognition
(1993) · doi:10.1109/cvpr.1993 · Cited by 17,989
Breiman, L. (1996) · Machine Learning · doi:10.1007/bf00058655 · Cited by 16,325
Advances in Neural Information Processing Systems 29
Teymur, O., Zygalakis, K., & Calderhead, B. (2016) · Cited by 13,881
Open Babel: An open chemical toolbox
O'Boyle, N. M., Banck, M. S., James, C. A. J., Morley, C., Vandermeersch, T., & Hutchison, G. R. (2011) · Journal of Cheminformatics · doi:10.1186/1758-2946-3-33 · Cited by 10,745
Ditchfield, R., Hehre, W. J., & Pople, J. A. (1971) · The Journal of Chemical Physics · doi:10.1063/1.1674902 · Cited by 10,612
The Cambridge Structural Database
Groom, C. R., Bruno, I. J., Lightfoot, M. P., & Ward, S. C. (2016) · Acta Crystallographica Section B Structural Science, Crystal Engineering and Materials · doi:10.1107/s2052520616003954 · Cited by 10,297
UMAP: Uniform Manifold Approximation and Projection for Dimension Reduction
McInnes, L., Healy, J., & Melville, J. (2018) · arXiv · doi:10.48550/arxiv.1802.03426 · Cited by 7,101
Fashion-MNIST: a Novel Image Dataset for Benchmarking Machine Learning Algorithms
Xiao, H., Rasul, K., & Vollgraf, R. (2017) · arXiv · doi:10.48550/arxiv.1708.07747 · Cited by 6,108
Neural Message Passing for Quantum ChemistryPreprint
Gilmer, J., Schoenholz, S. S., Riley, P. F., Vinyals, O., & Dahl, G. E. (2017) · arXiv (Cornell University) · doi:10.48550/arxiv.1704.01212 · Cited by 5,678
Machine learning for molecular and materials science
Butler, K. T., Davies, D. W., Cartwright, H., Isayev, O., & Walsh, A. (2018) · Nature · doi:10.1038/s41586-018-0337-2 · Cited by 4,968 · cited 1×
“Quantitative uncertainty metrics are most critical in applications of active learning 35,36 where the model is improved by acquisition of selected data.”
The atomic simulation environment—a Python library for working with atoms
Larsen, A. H., Mortensen, J. J., Blomqvist, J., Castelli, I. E., Christensen, R., Dułak, M., Friis, J., Groves, M. N., Hammer, B., Hargus, C., et al. (2017) · Journal of Physics Condensed Matter · doi:10.1088/1361-648x/aa680e · Cited by 4,790
Python Materials Genomics (pymatgen): A robust, open-source python library for materials analysis
Ong, S. P., Richards, W. D., Jain, A., Hautier, G., Kocher, M., Cholia, S., Gunter, D., Chevrier, V. L., Persson, K. A., & Ceder, G. (2013) · Computational Materials Science · doi:10.1016/j.commatsci.2012.10.028 · Cited by 4,534
Bayesian Learning for Neural Networks
Neal, R. M. (1996) · Lecture Notes in Statistics · doi:10.1007/978-1-4612-0745-0 · Cited by 4,276
MoleculeNet: a benchmark for molecular machine learning
Wu, Z., Ramsundar, B., Feinberg, E. N., Gomes, J., Geniesse, C., Pappu, A. S., Leswing, K., & Pande, V. (2018) · Chemical Science · doi:10.1039/c7sc02664a · Cited by 3,107
Automatic Chemical Design Using a Data-Driven Continuous Representation of Molecules
Gómez-Bombarelli, R., Wei, J. N., Duvenaud, D., Hernández-Lobato, J. M., Sánchez-Lengeling, B., Sheberla, D., Aguilera-Iparraguirre, J., Hirzel, T. D., Adams, R. P., & Aspuru-Guzik, A. (2018) · ACS Central Science · doi:10.1021/acscentsci.7b00572 · Cited by 3,106
Convolutional Networks on Graphs for Learning Molecular Fingerprints
Duvenaud, D., Maclaurin, D., Aguilera-Iparraguirre, J., Gómez-Bombarelli, R., Hirzel, T., Aspuru-Guzik, A., & Adams, R. P. (2015) · arXiv · doi:10.48550/arxiv.1509.09292 · Cited by 2,628
Deep Potential Molecular Dynamics: A Scalable Model with the Accuracy of Quantum Mechanics
Zhang, L., Han, J., Wang, H., Car, R., & Weinan, E. (2018) · Physical Review Letters · doi:10.1103/physrevlett.120.143001 · Cited by 2,392
SchNet – A deep learning architecture for molecules and materials
Schütt, K. T., Sauceda, H. E., Kindermans, P.-J., Tkatchenko, A., & Müller, K.-R. (2018) · The Journal of Chemical Physics · doi:10.1063/1.5019779 · Cited by 2,217
Inverse molecular design using machine learning: Generative models for matter engineering
Sánchez-Lengeling, B., & Aspuru‐Guzik, A. (2018) · Science · doi:10.1126/science.aat2663 · Cited by 2,177
Quantum chemistry structures and properties of 134 kilo molecules
Ramakrishnan, R., Dral, P. O., Rupp, M., & von Lilienfeld, O. A. (2014) · Scientific Data · doi:10.1038/sdata.2014.22 · Cited by 1,966
ANI-1: an extensible neural network potential with DFT accuracy at force field computational cost
Smith, J. S., Isayev, O., & Roitberg, A. E. (2017) · Chemical Science · doi:10.1039/c6sc05720a · Cited by 1,921
A general-purpose machine learning framework for predicting properties of inorganic materials
Ward, L., Agrawal, A., Choudhary, A., & Wolverton, C. (2016) · npj Computational Materials · doi:10.1038/npjcompumats.2016.28 · Cited by 1,831
Automatic Chemical Design Using a Data-Driven Continuous Representation of Molecules.
Gómez‐Bombarelli, R., Wei, J. N., Duvenaud, D., Hernández-Lobato, J. M., Sánchez-Lengeling, B., Sheberla, D., Aguilera‐Iparraguirre, J., Hirzel, T. D., Adams, R. P., & Aspuru‐Guzik, A. (2018) · Cambridge University Engineering Department Publications Database · doi:10.17863/cam.34134 · Cited by 1,813
Anomaly Detection with Robust Deep Autoencoders
Zhou, C., & Paffenroth, R. C. (2017) · ACM SIGKDD Conference on Knowledge Discovery and Data Mining (KDD) · doi:10.1145/3097983.3098052 · Cited by 1,607
AFLOW: An automatic framework for high-throughput materials discovery
Stefano Curtarolo, A., Setyawan, W., Hart, G. L. W., Jahnátek, M., Chepulskii, R. V., Taylor, R. H., Wang, S., Junkai Xue, A., Yang, K., Levy, O., et al. (2012) · Computational Materials Science · doi:10.1016/j.commatsci.2012.02.005 · Cited by 1,577
Generating Focused Molecule Libraries for Drug Discovery with Recurrent Neural Networks
Segler, M. H. S., Kogej, T., Tyrchan, C., & Waller, M. P. (2018) · ACS Central Science · doi:10.1021/acscentsci.7b00512 · Cited by 1,537
Perspective: Machine learning potentials for atomistic simulations
Behler, J. (2016) · The Journal of Chemical Physics · doi:10.1063/1.4966192 · Cited by 1,489
Quantum-chemical insights from deep tensor neural networks
Schütt, K. T., Arbabzadah, F., Chmiela, S., Müller, K. R., & Tkatchenko, A. (2017) · Nature Communications · doi:10.1038/ncomms13890 · Cited by 1,445
Machine learning of accurate energy-conserving molecular force fields
Chmiela, S., Tkatchenko, A., Sauceda, H. E., Poltavsky, I., Schütt, K. T., & Müller, K. (2017) · Science Advances · doi:10.1126/sciadv.1603015 · Cited by 1,237
Accelerating materials property predictions using machine learning
Pilania, G., Wang, C., Jiang, X., Rajasekaran, S., & Ramprasad, R. (2013) · Scientific Reports · doi:10.1038/srep02810 · Cited by 871
Snapshot Ensembles: Train 1, get M for freePreprint
Huang, G. M., Li, Y., Pleiss, G., Liu, Z., Hopcroft, J. E., & Weinberger, K. Q. (2017) · arXiv (Cornell University) · doi:10.48550/arxiv.1704.00109 · Cited by 816
Hansen, K., Biegler, F., Ramakrishnan, R., Pronobis, W., von Lilienfeld, O. A., Müller, K.-R., & Tkatchenko, A. (2015) · The Journal of Physical Chemistry Letters · doi:10.1021/acs.jpclett.5b00831 · Cited by 815
Less is more: Sampling chemical space with active learning
Smith, J. S., Nebgen, B., Lubbers, N., Isayev, O., & Roitberg, A. E. (2018) · The Journal of Chemical Physics · doi:10.1063/1.5023802 · Cited by 811
Comparing molecules and solids across structural and alchemical space
De, S., Bartók, A. P., Csányi, G., & Ceriotti, M. (2016) · Physical Chemistry Chemical Physics · doi:10.1039/c6cp00415f · Cited by 778
Accelerated discovery of stable lead-free hybrid organic-inorganic perovskites via machine learning
Lu, S., Zhou, Q., Ouyang, Y., Guo, Y., Li, Q., & Wang, J. (2018) · Nature Communications · doi:10.1038/s41467-018-05761-w · Cited by 725
Towards Deep Neural Network Architectures Robust to Adversarial ExamplesPreprint
Gu, S., & Rigazio, L. (2014) · arXiv (Cornell University) · doi:10.48550/arxiv.1412.5068 · Cited by 658
Prediction Errors of Molecular Machine Learning Models Lower than Hybrid DFT Error
Faber, F. A., Hutchison, L., Huang, B., Gilmer, J., Schoenholz, S. S., Dahl, G. E., Vinyals, O., Kearnes, S., Riley, P. F., & von Lilienfeld, O. A. (2017) · Journal of Chemical Theory and Computation · doi:10.1021/acs.jctc.7b00577 · Cited by 651
Ulissi, Z. W., Medford, A. J., Bligaard, T., & Nørskov, J. K. (2017) · Nature Communications · doi:10.1038/ncomms14621 · Cited by 614
Deep k-Nearest Neighbors: Towards Confident, Interpretable and Robust Deep LearningPreprint
Papernot, N., & McDaniel, P. D. (2018) · arXiv (Cornell University) · doi:10.48550/arxiv.1803.04765 · Cited by 592
Ren, F., Ward, L. T., Williams, T., Laws, K. J., Wolverton, C., Hattrick-Simpers, J. R., & Mehta, A. (2018) · Science Advances · doi:10.1126/sciadv.aaq1566 · Cited by 536
The TensorMol-0.1 model chemistry: a neural network augmented with long-range physics
Yao, K., Herr, J. E., Toth, D. W., Mckintyre, R., & Parkhill, J. (2018) · Chemical Science · doi:10.1039/c7sc04934j · Cited by 489
Detecting Backdoor Attacks on Deep Neural Networks by Activation Clustering
Chen, B., Carvalho, W., Baracaldo, N., Ludwig, H., Edwards, B., Lee, T., Molloy, I., & Srivastava, B. (2018) · arXiv · doi:10.48550/arxiv.1811.03728 · Cited by 485
Kitchin, J. R. (2018) · Nature Catalysis · doi:10.1038/s41929-018-0056-y · Cited by 481
Predicting the Band Gaps of Inorganic Solids by Machine Learning
Zhuo, Y., Tehrani, A. M., & Brgoch, J. (2018) · The Journal of Physical Chemistry Letters · doi:10.1021/acs.jpclett.8b00124 · Cited by 476
Convolutional embedding of attributed molecular graphs for physical property prediction
Coley, C. W., Barzilay, R., Green, W. H., Jaakkola, T. S., & Jensen, K. F. (2017) · Journal of Chemical Information and Modeling · doi:10.1021/acs.jcim.6b00601 · Cited by 470
Machine learning for heterogeneous catalyst design and discovery
Goldsmith, B. R., Esterhuizen, J. A., Liu, J., Bartel, C. J., & Sutton, C. A. (2018) · AIChE Journal · doi:10.1002/aic.16198 · Cited by 460
Machine-Learning-Augmented Chemisorption Model for CO2 Electroreduction Catalyst Screening
Ma, X., Li, Z., Achenie, L. E. K., & Xin, H. (2015) · The Journal of Physical Chemistry Letters · doi:10.1021/acs.jpclett.5b01660 · Cited by 430
Accelerated Discovery of Large Electrostrains in BaTiO3‐Based Piezoelectrics Using Active Learning
Yuan, R., Liu, Z., Balachandran, P. V., Xue, D., Zhou, Y., Ding, X., Sun, J., Xue, D., & Lookman, T. (2018) · Advanced Materials · doi:10.1002/adma.201702884 · Cited by 409
Hierarchical modeling of molecular energies using a deep neural network
Lubbers, N., Smith, J. S., & Barros, K. M. (2018) · The Journal of Chemical Physics · doi:10.1063/1.5011181 · Cited by 357
To Trust Or Not To Trust A ClassifierPreprint
Jiang, H., Kim, B., Guan, M. Y., & Gupta, M. R. (2018) · arXiv (Cornell University) · doi:10.48550/arxiv.1805.11783 · Cited by 340
ANI-1, A data set of 20 million calculated off-equilibrium conformations for organic molecules
Smith, J. S., Isayev, O., & Roitberg, A. E. (2017) · Scientific Data · doi:10.1038/sdata.2017.193 · Cited by 319
Virshup, A. M., Contreras-García, J., Wipf, P., Yang, W., & Beratan, D. N. (2013) · Journal of the American Chemical Society · doi:10.1021/ja401184g · Cited by 294
Huang, B., & von Lilienfeld, O. A. (2016) · The Journal of Chemical Physics · doi:10.1063/1.4964627 · Cited by 294
Janet, J. P., & Kulik, H. J. (2017) · The Journal of Physical Chemistry A · doi:10.1021/acs.jpca.7b08750 · Cited by 289
Self-citationMeredig, B., Antono, E., Church, C., Hutchinson, M., Ling, J., Paradiso, S. P., Blaiszik, B. J., Foster, I. T., Gibbons, B. M., Hattrick-Simpers, J. R., et al. (2018) · Molecular Systems Design & Engineering · doi:10.1039/c8me00012c · Cited by 284
molSimplify: A toolkit for automating discovery in inorganic chemistry
Ioannidis, E. I., Gani, T. Z. H., & Kulik, H. J. (2016) · Journal of Computational Chemistry · doi:10.1002/jcc.24437 · Cited by 240
Self-citationReliable and explainable machine-learning methods for accelerated material discovery
Kailkhura, B., Gallagher, B. J., Kim, S., Hiszpanski, A. M., & Han, T. Y.-J. (2019) · npj Computational Materials · doi:10.1038/s41524-019-0248-2 · Cited by 213
Machine learning meets volcano plots: computational discovery of cross-coupling catalysts
Meyer, B., Sawatlon, B., Heinen, S., von Lilienfeld, O. A., & Corminboeuf, C. (2018) · Chemical Science · doi:10.1039/c8sc01949e · Cited by 209
Broto, P., Moreau, G., & Vandycke, C. (1984) · Chimie thérapeutique · Cited by 208
Machine learning of molecular properties: Locality and active learning
Gubaev, K., Podryabinkin, E. V., & Shapeev, A. V. (2018) · The Journal of Chemical Physics · doi:10.1063/1.5005095 · Cited by 177
Addressing uncertainty in atomistic machine learning
Peterson, A. A., Christensen, R., & Khorshidi, A. (2017) · Physical Chemistry Chemical Physics · doi:10.1039/c7cp00375g · Cited by 175
Fast and Accurate Uncertainty Estimation in Chemical Machine Learning
Musil, F., Willatt, M. J., Langovoy, M., & Ceriotti, M. (2019) · Journal of Chemical Theory and Computation · doi:10.1021/acs.jctc.8b00959 · Cited by 163
Strategies and Software for Machine Learning Accelerated Discovery in Transition Metal Chemistry
Nandy, A., Duan, C., Janet, J. P., Gugler, S., & Kulik, H. J. (2018) · Industrial & Engineering Chemistry Research · doi:10.1021/acs.iecr.8b04015 · Cited by 161
Self-citationAtomic convolutional networks for predicting protein-ligand binding affinity
Gomes, J., Ramsundar, B., Feinberg, E. N., & Pande, V. S. (2017) · arXiv · doi:10.48550/arxiv.1703.10603 · Cited by 150
He, Y., Cubuk, E. D., Allendorf, M. D., & Reed, E. J. (2018) · The Journal of Physical Chemistry Letters · doi:10.1021/acs.jpclett.8b01707 · Cited by 127
Intrinsic Bond Energies from a Bonds-in-Molecules Neural Network
Yao, K., Herr, J. E., Brown, S. N., & Parkhill, J. (2017) · The Journal of Physical Chemistry Letters · doi:10.1021/acs.jpclett.7b01072 · Cited by 126
Constant size descriptors for accurate machine learning models of molecular properties
Collins, C. R., Gordon, G. J., von Lilienfeld, O. A., & Yaron, D. (2018) · The Journal of Chemical Physics · doi:10.1063/1.5020441 · Cited by 124
Catalyst design: knowledge extraction from high-throughput experimentation
Caruthers, J. M., Lauterbach, J. A., Thomson, K. T., Venkatasubramanian, V., Snively, C. M., Bhan, A., Katare, S. R., & Oskarsdottir, G. (2003) · Journal of Catalysis · doi:10.1016/s0021-9517(02)00036-2 · Cited by 115
Janet, J. P., Liu, F., Nandy, A., Duan, C., Yang, T., Lin, S., & Kulik, H. J. (2019) · Inorganic Chemistry · doi:10.1021/acs.inorgchem.9b00109 · Cited by 114
Self-citationCortés‐Ciriano, I., & Bender, A. (2018) · Journal of Chemical Information and Modeling · doi:10.1021/acs.jcim.8b00542 · Cited by 105
Neural Message Passing with Edge Updates for Predicting Properties of Molecules and MaterialsPreprint
Jørgensen, P. B., Jacobsen, K. W., & Schmidt, M. N. (2018) · arXiv (Cornell University) · doi:10.48550/arxiv.1806.03146 · Cited by 97
Duan, C., Janet, J. P., Liu, F., Nandy, A., & Kulik, H. J. (2019) · Journal of Chemical Theory and Computation · doi:10.1021/acs.jctc.9b00057 · Cited by 87
Self-citationHierarchical visualization of materials space with graph convolutional neural networks
Xie, T., & Grossman, J. C. (2018) · The Journal of Chemical Physics · doi:10.1063/1.5047803 · Cited by 84
Error-Controlled Exploration of Chemical Reaction Networks with Gaussian Processes
Simm, G. N. C., & Reiher, M. (2018) · Journal of Chemical Theory and Computation · doi:10.1021/acs.jctc.8b00504 · Cited by 82
Liu, R., & Wallqvist, A. (2018) · Journal of Chemical Information and Modeling · doi:10.1021/acs.jcim.8b00597 · Cited by 79
Corma, A., Díaz-Cabañas, M. J., Moliner, M., & Martı́nez, C. (2006) · Journal of Catalysis · doi:10.1016/j.jcat.2006.04.036 · Cited by 72
An Intelligent System for Reaction Kinetic Modeling and Catalyst Design
Katare, S. R., Caruthers, J. M., Delgass, W. N., & Venkatasubramanian, V. (2004) · Industrial & Engineering Chemistry Research · doi:10.1021/ie034067h · Cited by 72
Ab Initio Reactive Computer Aided Molecular Design
Martı́nez, T. J. (2017) · Accounts of Chemical Research · doi:10.1021/acs.accounts.7b00010 · Cited by 51
Liu, R., Glover, K., Feasel, M. G., & Wallqvist, A. (2018) · Journal of Chemical Information and Modeling · doi:10.1021/acs.jcim.8b00114 · Cited by 44
Improved Chemical Prediction from Scarce Data Sets via Latent Space Enrichment
Iovanac, N. C., & Savoie, B. M. (2019) · The Journal of Physical Chemistry A · doi:10.1021/acs.jpca.9b01398 · Cited by 41
Morais, C. L. M., Lima, K. M. G., & Martin, F. L. (2018) · Analytica Chimica Acta · doi:10.1016/j.aca.2018.09.022 · Cited by 38
Proceedings of the 11th Python in Science Conference
(2012) · Proceedings of the Python in Science Conferences · doi:10.25080/majora-54c7f2c8-00d · Cited by 32
Research works printed but not linked: 9
- van der Maaten, 2008, J. Mach. Learn. Res., 9, 2579
- Y. Gal and Z.Ghahramani , in Dropout as a Bayesian Approximation: Representing Model Uncertainty in Deep Learning, international conference on machine learning , 2016 , pp. 1050–1059
- Duvenaud, 2015, Adv. Neural Inf. Process. Syst., 2215
- Larsen, 2017, J. Phys.: Condens. Matter, 29, 273002
- J. H. Metzen , T.Genewein , V.Fischer and B.Bischoff , On Detecting Adversarial Perturbations , in 5th International Conference on Learning Representations , ICLR , 2017
- T. Schlegl , P.Seeböck , S. M.Waldstein , U.Schmidt-Erfurth and G.Langs , in Unsupervised Anomaly Detection with Generative Adversarial Networks to Guide Marker Discovery, Information Processing in Medical Imaging , Springer International Publishing , 2017 , pp. 146–157
- Breiman, 1996, Mach. Learn., 24, 123
- C. C. Aggarwal , A.Hinneburg and D. A.Keim , in On the Surprising Behavior of Distance Metrics in High Dimensional Space, Database Theory—ICDT 2001 , ed. J. Van den Bussche and V. Vianu , Springer Berlin Heidelberg , Berlin, Heidelberg , 2001 , pp. 420–434
- Broto, 1984, Eur. J. Med. Chem., 19, 71
Cited by
Sorted by citations
Gaussian Process Regression for Materials and Molecules
Deringer, V. L., Bartók, A. P., Bernstein, N., Wilkins, D. M., Ceriotti, M., & Cśanyi, G. (2021) · Chemical Reviews · doi:10.1021/acs.chemrev.1c00022 · Cited by 1,311
Drug discovery with explainable artificial intelligence
Jiménez-Luna, J., Grisoni, F., & Schneider, G. (2020) · Nature Machine Intelligence · doi:10.1038/s42256-020-00236-4 · Cited by 1,063
Predicting into unknown space? Estimating the area of applicability of spatial prediction models
Meyer, H., & Pebesma, E. (2021) · Methods in Ecology and Evolution · doi:10.1111/2041-210x.13650 · Cited by 662
Big-Data Science in Porous Materials: Materials Genomics and Machine Learning
Jablonka, K. M., Ongari, D., Moosavi, S. M., & Smit, B. (2020) · Chemical Reviews · doi:10.1021/acs.chemrev.0c00004 · Cited by 656
Fan, Z., Wang, Y., Ying, P., Song, K., Wang, J., Wang, Y., Zeng, Z., Xu, K. W., Lindgren, E., Rahm, J. M., et al. (2022) · The Journal of Chemical Physics · doi:10.1063/5.0106617 · Cited by 515
Metadata
- Authors
- Janet, J. P., Duan, C., Yang, T., Nandy, A., & Kulik, H. J.
- Affiliations
- Massachusetts Institute of Technology (US)
- Corresponding author
- Kulik, Heather J.
- Venue
- Chemical Science
- Publisher
- Royal Society of Chemistry (RSC)
- Published
- 2019
- Volume
- 10
- Issue
- 34
- Pages
- 7913-7922
- ISSN
- 2041-6520 (ISSN-L)
- 2041-6539
- PMC
- PMC6764470
- OpenAlex
- W2959623824
- Cited by
- 243
- References
- 87
- Citations by year
- 2026: 43 · 2025: 29 · 2024: 34 · 2023: 23 · 2022: 37 · 2021: 39 · 2020: 29 · 2019: 8
- FWCI
- 10.20
- Type
- journal article
- Language
- en
- Open access
- diamond
- doi.org
- Licence
- Locations
- Chemical Science (publishedVersion, cc-by-nc)
- ChemRxiv (acceptedVersion, cc-by-nc-nd)
- PubMed Central (publishedVersion, cc-by-nc)
- PubMed (publishedVersion)
- DSpace@MIT (Massachusetts Institute of Technology) (submittedVersion, cc-by-nc)
- Figshare (submittedVersion, cc-by-nc-nd)
- Funders
- Office of Naval Research Global (N00014-18-1-2434)
- Burroughs Wellcome Fund (Career Award at the Scientific Interface)
- American Association for the Advancement of Science (Marion Milligan Mason Award)
- Defense Advanced Research Projects Agency (D18AP00039)
- Topics
- Physical Sciences › Materials Science › Materials Chemistry › Machine Learning in Materials Science
- Life Sciences › Pharmacology, Toxicology and Pharmaceutics › Drug Discovery › Computational Drug Discovery Methods
- Physical Sciences › Computer Science › Artificial Intelligence › Adversarial Robustness in Machine Learning
- Keywords
- uncertainty quantification, neural network model, chemical discoveries, prediction error, active learning (machine learning), chemical space exploration, model calibration, inorganic chemistry, organic chemistry
About these checks
Registry, retraction, Cites and statistics results are computed, not judged, with one exception: a printed reference that no index lists is read once by a model before it counts as a citation error. Claims are extracted by a model and kept only when their quote appears verbatim in the text; each cited source is then checked, with a model’s help, for whether it says what the claim relies on. Those verdicts can be wrong — read the claim’s quote and the cited source before relying on one.
Statistics and arithmetic are recomputed, not judged.
Confidence bands are shown only for fields calibrated on our annotated test set. None is calibrated yet, so no band is shown.
What counts as a claim ›How we measure confidence ›How we check this ›
Are you an author, or do you see a problem with this page? Request a review
