

The DOI matches its Crossref record; 3 of the 3 references it cites were found in a registry or an index.
Increased Expression of Axogenesis-Related Genes and Mossy Fibre Length in Dentate Granule Cells from Adult HuD Overexpressor Mice
Overview
The claims and statistics of this paper haven’t been checked yet.
Run the check — free, no account needed. It reads the open-access text and checks the sources it cites.
Integrity signals
Registry
Cites
Statistics
Figures
Verification
Claims the paper makes
The claims and statistics of this paper haven’t been checked yet.
Run the check — free, no account needed. It reads the open-access text and checks the sources it cites.
Claims other papers make about this one
Each is checked against this paper’s own text: does it say what the citing paper says it does?
The cited source says what the claim attributes to it.
In the citing paper
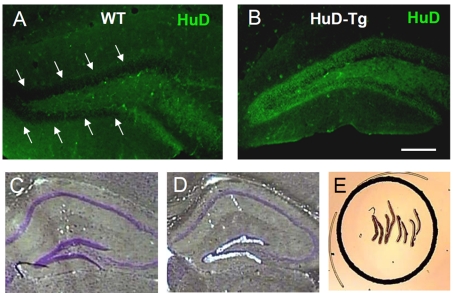
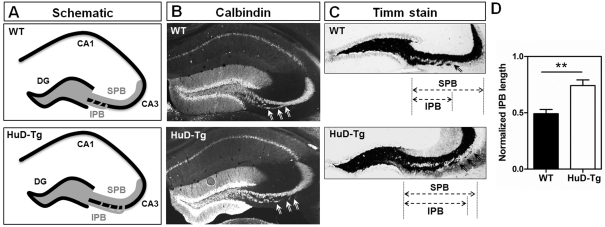
“In support of these findings, transgenic mice ectopically expressing HuD (HuD-Tg) in forebrain neurons under the control of the CAMKIIα promoter (Bolognani et al. 2007b) were shown to contain increased mossy fiber length (Perrone-Bizzozero et al. 2011).”
From Emerging complexity of the HuD/ELAVl4 gene; implications for neuronal development, function, and dysfunction (2013) · cites this paper as Perrone-Bizzozero et al. 2011
The cited source says what the claim attributes to it.
In the citing paper
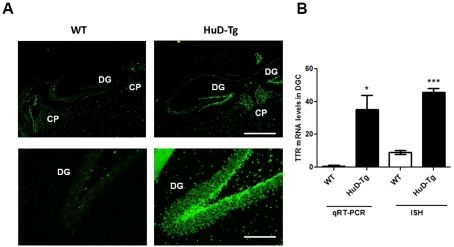
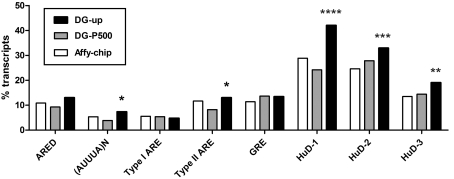
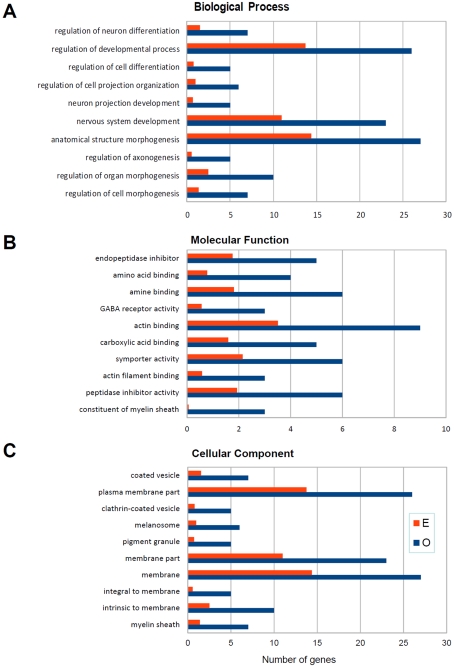
“Furthermore, as mentioned above, microarray analysis of HuD-targeted mRNAs in DGCs demonstrated that HuD-Tg mice contained increased expression of transcripts whose products regulate neuronal development and axogenesis (Perrone-Bizzozero et al. 2011).”
From Emerging complexity of the HuD/ELAVl4 gene; implications for neuronal development, function, and dysfunction (2013) · cites this paper as Perrone-Bizzozero et al. 2011
Self-check
Percentages, sums and reported differences re-computed from the paper’s own numbers.
The self-check needs the paper’s full text.
Citations
Cites
Zoeller, R. T., & Rovet, J. (2004) · Journal of Neuroendocrinology · doi:10.1111/j.1365-2826.2004.01243.x · Cited by 605
Akten, B., Kye, M. J., Hao, L. T., Wertz, M. H., Singh, S., Nie, D., Huang, J., Merianda, T. T., Twiss, J. L., Beattie, C. E., et al. (2011) · Proceedings of the National Academy of Sciences · doi:10.1073/pnas.1104928108 · Cited by 203
Deschênes-Furry, J., Mousavi, K., Bolognani, F., Neve, R. L., Parks, R. J., Perrone-Bizzozero, N. I., & Jasmin, B. J. (2007) · The Journal of Neuroscience · doi:10.1523/jneurosci.4626-06.2007 · Cited by 43
Self-citation
Research works printed but not linked: 50
- 10.1073/pnas.96.17.9885 · DOI
- 10.1073/pnas.0407523102 · DOI · Paper page
- 10.1046/j.1471-4159.2000.0751103.x · DOI
- 10.1006/exnr.2000.7599 · DOI
- 10.1016/S0014-4886(03)00103-1 · DOI · Paper page
- 10.1016/S0092-8674(03)00267-8 · DOI
- 10.1093/nar/gkj052 · DOI
- 10.1016/0006-8993(71)90079-5 · DOI
- 10.1242/dev.120.5.1097 · DOI
- 10.1016/j.neulet.2004.08.074 · DOI · Paper page
- 10.1111/j.1471-4159.2005.03607.x · DOI
- 10.1007/s11064-007-9388-8 · DOI
- 10.1016/j.nlm.2006.11.004 · DOI
- 10.1002/jnr.21473 · DOI
- 10.1093/nar/gkp863 · DOI · Paper page
- 10.1016/j.neuint.2009.07.010 · DOI
- 10.1016/S0968-0004(00)89102-1 · DOI · Paper page
- 10.1016/S0165-3806(98)00074-1 · DOI · Paper page
- 10.1002/bies.20449 · DOI · Paper page
- 10.1073/pnas.121146698 · DOI
- 10.1523/JNEUROSCI.3631-10.2011 · DOI · Paper page
- 10.1073/pnas.0407262101 · DOI
- 10.1111/j.1471-4159.2007.04828.x · DOI
- 10.1002/jnr.21957 · DOI
- 10.1093/hmg/ddq500 · DOI · Paper page
- 10.1046/j.1365-2443.1999.00292.x · DOI · Paper page
- 10.1101/lm.86906 · DOI
- 10.1159/000112397 · DOI
- 10.1042/BJ20082090 · DOI
- 10.1007/s002210050313 · DOI
- 10.1523/JNEUROSCI.1801-06.2006 · DOI
- 10.1523/JNEUROSCI.23-20-07710.2003 · DOI · Paper page
- 10.1113/jphysiol.2003.045948 · DOI
- 10.1046/j.1460-9568.2000.00196.x · DOI
- 10.1523/JNEUROSCI.17-09-03024.1997 · DOI · Paper page
- 10.1152/ajpcell.1997.272.2.C485 · DOI
- 10.1073/pnas.0307674100 · DOI · Paper page
- 10.1002/jnr.10175 · DOI
- 10.1093/brain/123.1.19 · DOI
- 10.1016/j.neulet.2007.05.040 · DOI
- 10.1016/0092-8674(86)90341-7 · DOI
- 10.1002/neu.20038 · DOI · Paper page
- 10.1016/j.brainres.2008.10.024 · DOI
- 10.1146/annurev.neuro.24.1.299 · DOI
- 10.1002/hipo.20442 · DOI · Paper page
- 10.1016/j.neuroscience.2008.12.045 · DOI
- 10.1016/j.molcel.2007.11.024 · DOI
- 10.1242/dev.124.17.3449 · DOI · Paper page
- 10.1038/35067025 · DOI
- 10.1016/j.expneurol.2009.08.011 · DOI
Cited by
Sorted by citations
Mostafavi, S., Gaiteri, C., Sullivan, S. E., White, C. C., Tasaki, S., Xu, J., Taga, M., Klein, H.-U., Patrick, E., Komashko, V., et al. (2018) · Nature Neuroscience · doi:10.1038/s41593-018-0154-9 · Cited by 509
Bronicki, L. M., & Jasmin, B. J. (2013) · RNA · doi:10.1261/rna.039164.113 · Cited by 126
DeBoer, E. M., Azevedo, R., Vega, T. A., Brodkin, J., Akamatsu, W., Okano, H., Wagner, G. C., & Rasin, M.-R. (2014) · The Journal of Neuroscience · doi:10.1523/jneurosci.3703-13.2014 · Cited by 72
Metadata
- Authors
- Perrone-Bizzozero, N. I., Tanner, D. C., Mounce, J., & Bolognani, F.
- Affiliations
- Departmemt of Neurosciences, University of New Mexico School of Medicine, Albuquerque, NM 87131, USA
- Venue
- ASN Neuro
- Publisher
- Informa UK Limited
- Published
- 2011-10
- Volume
- 3
- Issue
- 5
- ISSN
- 1759-0914
- PMC
- PMC3234101
- Cited by
- 25
- References
- 3
- Language
- en
About these checks
Registry, retraction, Cites and statistics results are computed, not judged, with one exception: a printed reference that no index lists is read once by a model before it counts as a citation error. Claims are extracted by a model and kept only when their quote appears verbatim in the text; each cited source is then checked, with a model’s help, for whether it says what the claim relies on. Those verdicts can be wrong — read the claim’s quote and the cited source before relying on one.
Statistics and arithmetic are recomputed, not judged.
Confidence bands are shown only for fields calibrated on our annotated test set. None is calibrated yet, so no band is shown.
What counts as a claim ›How we measure confidence ›How we check this ›
Are you an author, or do you see a problem with this page? Request a review
