

The DOI matches its Crossref record; 71 of the 71 references it cites were found in a registry or an index.
Cell-specific and region-specific transcriptomics in the multiple sclerosis model: Focus on astrocytes
Open accessAbstract
Significance: Molecular mechanisms underlying distinct disabilities during neurological diseases may differ based on the neurological pathway involved. Multiple sclerosis (MS) is multifocal, characterized by distinct disabilities affecting walking, vision, cognition, and fatigue. Neuroprotective treatments tailored for each disability may be more effective than nonspecific treatments aiming to reduce a composite of disabilities in clinical trials. Here, we use the MS model to apply a cell-specific and region-specific gene expression approach to discover targets in distinct neuroanatomic regions. Altered cholesterol synthesis gene expression in astrocytes in spinal cord and optic nerve was identified as a potential target for walking and visual disabilities, respectively. This disability-specific discovery approach represents a strategy for finding neuroprotective treatments for multifocal neurodegenerative diseases.
Overview
The claims and statistics of this paper haven’t been checked yet.
Run the check — free, no account needed. It reads the open-access text and checks the sources it cites.
Integrity signals
Registry
Cites
Statistics
Figures
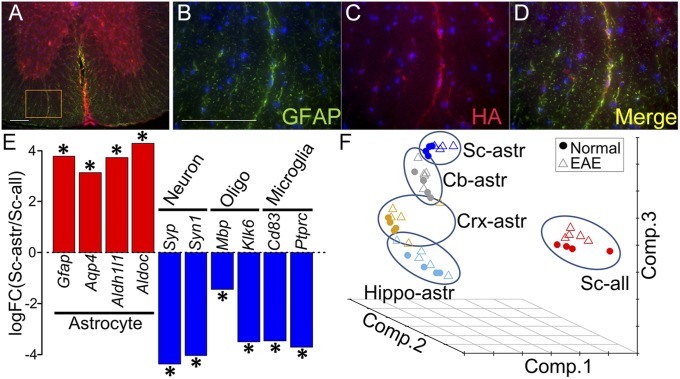
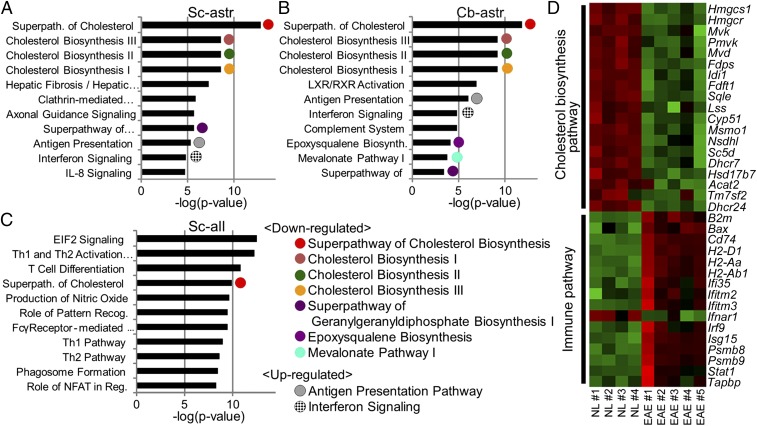
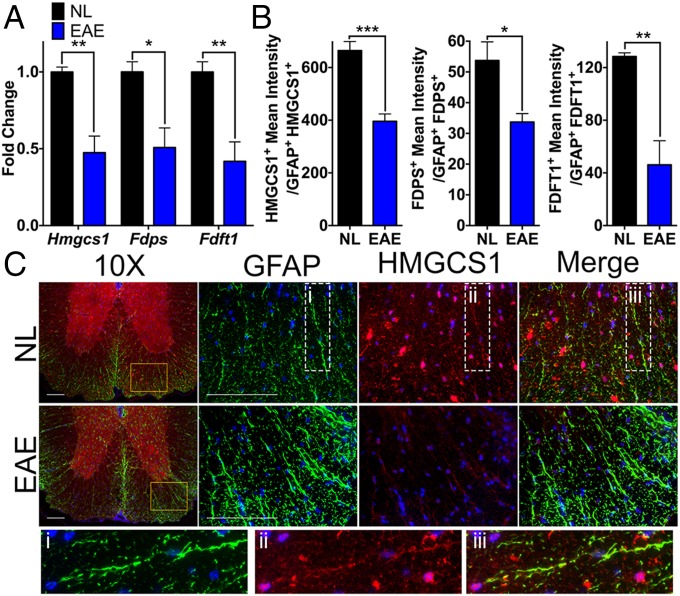
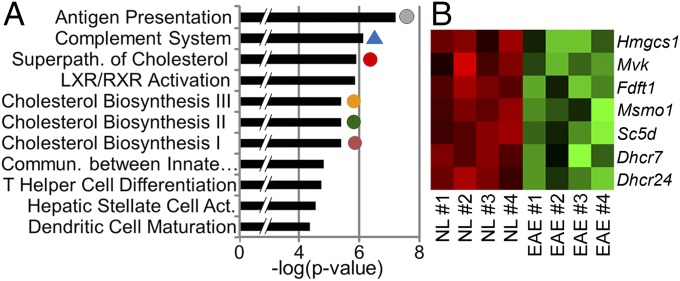
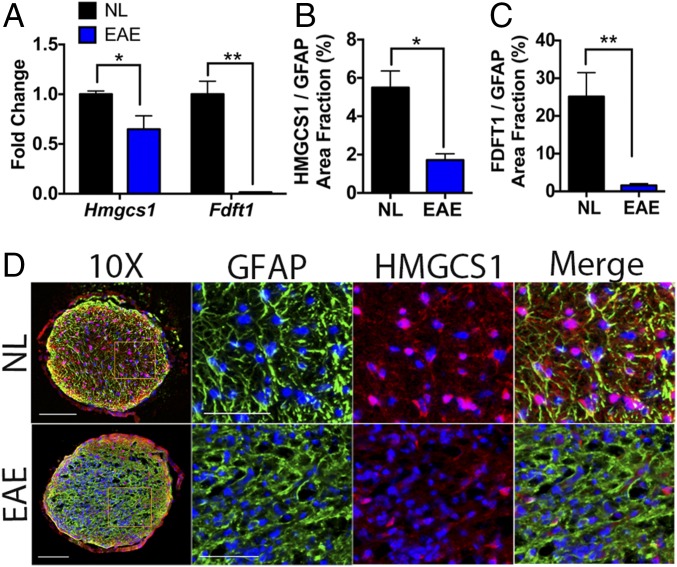
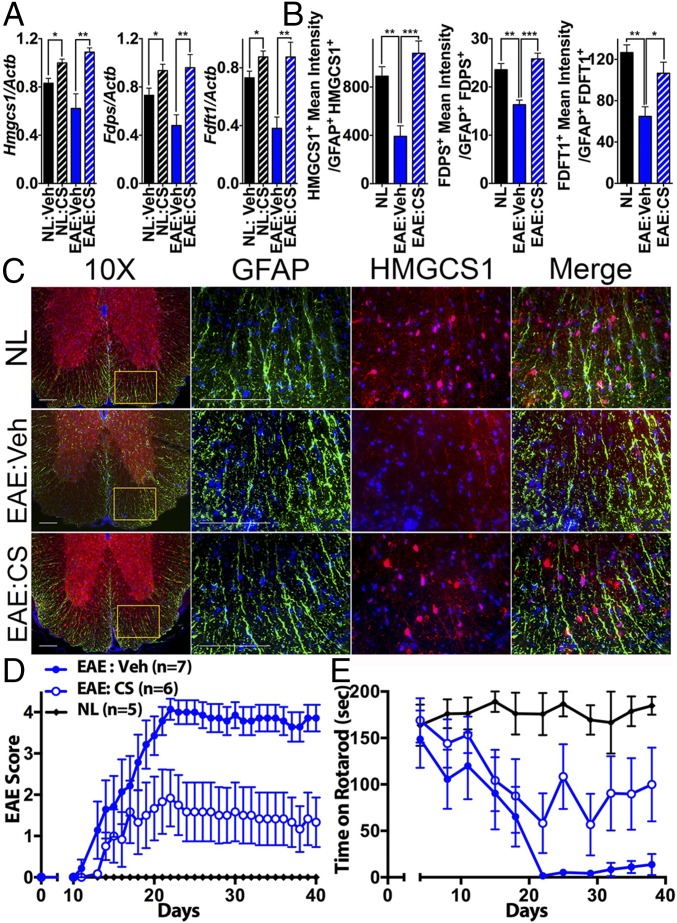
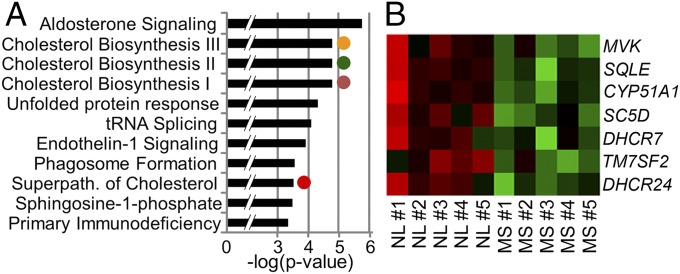
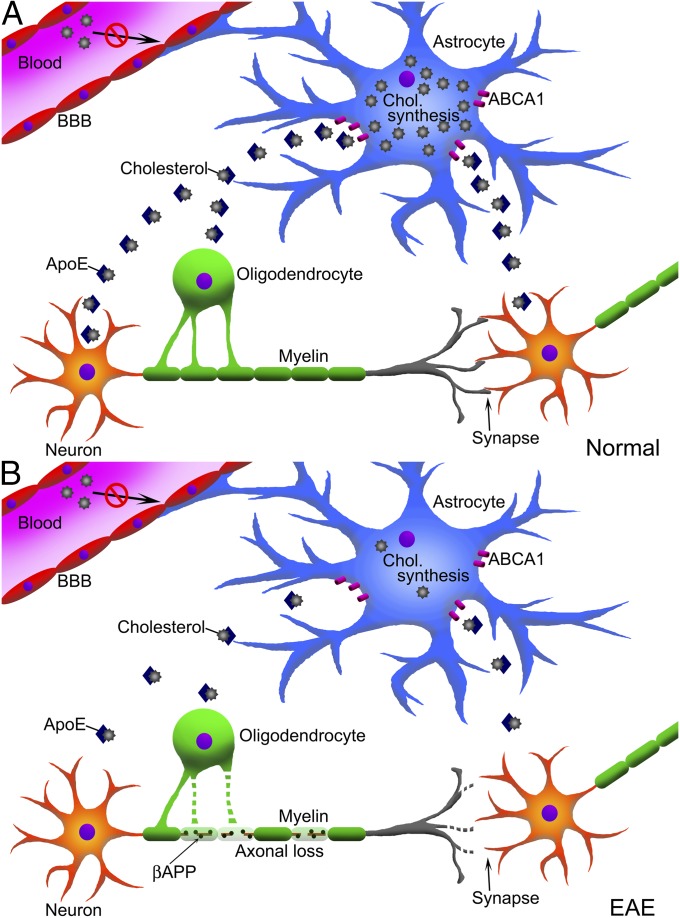
Verification
Claims the paper makes
The claims and statistics of this paper haven’t been checked yet.
Run the check — free, no account needed. It reads the open-access text and checks the sources it cites.
Claims other papers make about this one
Each is checked against this paper’s own text: does it say what the citing paper says it does?
The source backs part of the claim, not all of it — or backs it for a different population, condition or comparison.
In the citing paper
“Such transcriptomic profiling specifically shows that reactive astrocytes adopt distinct molecular states in different disease models48,66–70, in different CNS regions70, and in brain tumors71.”
From Reactive astrocyte nomenclature, definitions, and future directions (2021) · cites this paper as [70]
Experimental — accuracy not yet measuredThe cited source says what the claim attributes to it.
In the citing paper
“Likewise, reactive astrocytes are also diverse, as unequivocally demonstrated by microarray-based66–68 and RNAseq-based48,69–71 transcriptomic profiling of mouse bulk astrocytes48,66–70 or of astrocyte populations preselected according to cell-surface markers71.”
From Reactive astrocyte nomenclature, definitions, and future directions (2021) · cites this paper as [70]
The cited source says what the claim attributes to it.
In the citing paper
“These studies also suggested complex functional changes in reactive astrocytes, including novel regenerative functions70, proliferation, and neural stem cell potential68, as well as loss of homeostatic functions66.”
From Reactive astrocyte nomenclature, definitions, and future directions (2021) · cites this paper as [70]
Self-check
Percentages, sums and reported differences re-computed from the paper’s own numbers.
The self-check needs the paper’s full text.
Citations
Cites
Cognitive impairment in multiple sclerosis
Chiaravalloti, N. D., & DeLuca, J. (2008) · The Lancet Neurology · doi:10.1016/s1474-4422(08)70259-x · Cited by 2,088
Astrocyte scar formation aids central nervous system axon regeneration
Anderson, M. A., Burda, J. E., Ren, Y., Ao, Y., O’Shea, T. M., Kawaguchi, R., Coppola, G., Khakh, B. S., Deming, T. J., & Sofroniew, M. V. (2016) · Nature · doi:10.1038/nature17623 · Cited by 1,851
Self-citationCNS synaptogenesis promoted by glia-derived cholesterol
Mauch, D. H., Nägler, K., Schumacher, S., Göritz, C., Müller, E.-C., Otto, A., & Pfrieger, F. W. (2001) · Science · doi:10.1126/science.294.5545.1354 · Cited by 1,711
Diversity of astrocyte functions and phenotypes in neural circuits
Khakh, B. S., & Sofroniew, M. V. (2015) · Nature Neuroscience · doi:10.1038/nn.4043 · Cited by 1,239
Self-citationAstrocyte barriers to neurotoxic inflammation
Sofroniew, M. V. (2015) · Nature Reviews Neuroscience · doi:10.1038/nrn3898 · Cited by 1,202
Self-citationMicroglia development follows a stepwise program to regulate brain homeostasis
Matcovitch-Natan, O., Winter, D. R., Giladi, A., Vargas Aguilar, S., Spinrad, A., Sarrazin, S., Ben-Yehuda, H., David, E., Zelada González, F., Perrin, P., et al. (2016) · Science · doi:10.1126/science.aad8670 · Cited by 1,180
Youssef, S., Stüve, O., Patarroyo, J. C., Ruiz, P. J., Radosevich, J. L., Hur, E. M., Bravo, M., Mitchell, D. J., Sobel, R. A., Steinman, L., et al. (2002) · Nature · doi:10.1038/nature01158 · Cited by 1,096
Cell-type-specific isolation of ribosome-associated mRNA from complex tissues
Sanz, E., Yang, L., Su, T., Morris, D. R., McKnight, G. S., & Amieux, P. S. (2009) · Proceedings of the National Academy of Sciences · doi:10.1073/pnas.0907143106 · Cited by 976
High cholesterol level is essential for myelin membrane growth
Saher, G., Brügger, B., Lappe-Siefke, C., Möbius, W., Tozawa, R.-I., Wehr, M. C., Wieland, F., Ishibashi, S., & Nave, K.-A. (2005) · Nature Neuroscience · doi:10.1038/nn1426 · Cited by 799
Differential regulation of central nervous system autoimmunity by TH1 and TH17 cells
Stromnes, I. M., Cerretti, L., Liggitt, D., Harris, R. A., & Goverman, J. M. (2008) · Nature Medicine · doi:10.1038/nm1715 · Cited by 644
Voskuhl, R. R., Peterson, R. S., Song, B., Ao, Y., Morales, L. B. J., Tiwari-Woodruff, S. K., & Sofroniew, M. V. (2009) · Journal of Neuroscience · doi:10.1523/jneurosci.1514-09.2009 · Cited by 478
Self-citationIntracortical multiple sclerosis lesions are not associated with increased lymphocyte infiltration
Bø, L., Vedeler, C. A., Nyland, H., Trapp, B. D., & Mørk, S. J. (2003) · Multiple Sclerosis Journal · doi:10.1191/1352458503ms917oa · Cited by 478
Chataway, J., Schuerer, N., Alsanousi, A., Chan, D., MacManus, D. G., Hunter, K., Anderson, V. M., Bangham, C. R. M., Clegg, S., Nielsen, C. F., et al. (2014) · The Lancet · doi:10.1016/s0140-6736(13)62242-4 · Cited by 456
Treatment of multiple sclerosis with the pregnancy hormone estriol
Sicotte, N. L., Liva, S. M., Klutch, R., Pfeiffer, P., Bouvier, S., Odesa, S., Wu, T. C. J., & Voskuhl, R. R. (2002) · Annals of Neurology · doi:10.1002/ana.10301 · Cited by 435
Self-citationRisk factors for and management of cognitive dysfunction in multiple sclerosis
Benedict, R., & Zivadinov, R. (2011) · Nature Reviews Neurology · doi:10.1038/nrneurol.2011.61 · Cited by 400
Regional hippocampal atrophy in multiple sclerosis.
Sicotte, N., Kern, K. C., Giesser, B., Arshanapalli, A., Schultz, A., Montag, M. J., Wang, H., & Bookheimer, S. (2008) · Brain : a journal of neurology · doi:10.1093/brain/awn030 · Cited by 376
Identification of Common Transcriptional Regulatory Elements in Interleukin-17 Target Genes
Shen, F., Hu, Z., Goswami, J., & Gaffen, S. L. (2006) · Journal of Biological Chemistry · doi:10.1074/jbc.m604597200 · Cited by 299
Lipocalin-2 Is an Autocrine Mediator of Reactive Astrocytosis
Lee, S., Park, J., Lee, W., Kim, H., Park, H., Mori, K., & Suk, K. (2009) · Journal of Neuroscience · doi:10.1523/jneurosci.5273-08.2009 · Cited by 286
The astrocyte in multiple sclerosis revisited
Brosnan, C. F., & Raine, C. S. (2013) · Glia · doi:10.1002/glia.22443 · Cited by 274
Sex-related factors in multiple sclerosis susceptibility and progression
Voskuhl, R. R., & Gold, S. M. (2012) · Nature Reviews Neurology · doi:10.1038/nrneurol.2012.43 · Cited by 262
Self-citationNeuroprotective effects of estrogens and androgens in CNS inflammation and neurodegeneration
Spence, R. D., & Voskuhl, R. R. (2011) · Frontiers in Neuroendocrinology · doi:10.1016/j.yfrne.2011.12.001 · Cited by 259
Self-citationBiological markers in CSF and blood for axonal degeneration in multiple sclerosis
Teunissen, C. E., Dijkstra, C. D., & Polman, C. H. (2004) · The Lancet Neurology · doi:10.1016/s1474-4422(04)00964-0 · Cited by 252
Neuroactive steroids: State of the art and new perspectives
Melcangi, R. C., García‐Segura, L. M., & Mensah‐Nyagan, A. G. (2007) · Cellular and Molecular Life Sciences · doi:10.1007/s00018-007-7403-5 · Cited by 249
Neuroprotection mediated through estrogen receptor-α in astrocytes
Spence, R. D., Hamby, M. E., Umeda, E. A., Itoh, N., Du, S., Wisdom, A. J., Cao, Y., Bondar, G., Lam, J., Ao, Y., et al. (2011) · Proceedings of the National Academy of Sciences · doi:10.1073/pnas.1103833108 · Cited by 240
Self-citationTiwari-Woodruff, S., Morales, L. B. J., Lee, R., & Voskuhl, R. R. (2007) · Proceedings of the National Academy of Sciences · doi:10.1073/pnas.0703783104 · Cited by 234
Self-citationTransplantation reveals regional differences in oligodendrocyte differentiation in the adult brain
Viganò, F., Möbius, W., Götz, M., & Dimou, L. (2013) · Nature Neuroscience · doi:10.1038/nn.3503 · Cited by 230
Cognitive Impairment in Multiple Sclerosis: Clinical, Radiologic and Pathologic Insights
DeLuca, G. C., Yates, R. L., Beale, H., & Morrow, S. A. (2014) · Brain Pathology · doi:10.1111/bpa.12220 · Cited by 228
Testosterone Treatment in Multiple Sclerosis
Sicotte, N. L., Giesser, B. S., Tandon, V., Klutch, R., Steiner, B., Drain, A. E., Shattuck, D. W., Hull, L., Wang, H.-J., Elashoff, R. M., et al. (2007) · Archives of Neurology · doi:10.1001/archneur.64.5.683 · Cited by 215
Self-citationVoskuhl, R. R., Wang, H.-J., Wu, T. C. J., Sicotte, N. L., Nakamura, K., Kurth, F., Itoh, N., Bardens, J., Bernard, J. T., Corboy, J. R., et al. (2015) · The Lancet Neurology · doi:10.1016/s1474-4422(15)00322-1 · Cited by 206
Self-citationEffects of central and peripheral inflammation on hippocampal synaptic plasticity
Filippo, M. D., Chiasserini, D., Gardoni, F., Viviani, B., Tozzi, A., Giampà, C., Costa, C., Tantucci, M., Zianni, E., Boraso, M., et al. (2013) · Neurobiology of Disease · doi:10.1016/j.nbd.2012.12.009 · Cited by 206
Cholesterol in myelin biogenesis and hypomyelinating disorders
Saher, G., & Stumpf, S. K. (2015) · Biochimica et Biophysica Acta (BBA) - Molecular and Cell Biology of Lipids · doi:10.1016/j.bbalip.2015.02.010 · Cited by 192
Hippocampal CA1 atrophy and synaptic loss during experimental autoimmune encephalomyelitis, EAE
Ziehn, M. O., Avedisian, A., Tiwari-Woodruff, S., & Voskuhl, R. (2010) · Laboratory Investigation · doi:10.1038/labinvest.2010.6 · Cited by 190
Self-citationThe neural androgen receptor: a therapeutic target for myelin repair in chronic demyelination
Hussain, R., Ghoumari, A. M., Bielecki, B., Steibel, J., Boehm, N., Lière, P., Macklin, W. B., Kumar, N., Habert, R., Mhaouty‐Kodja, S., et al. (2013) · Brain · doi:10.1093/brain/aws284 · Cited by 189
Mechanisms regulating regional localization of inflammation during CNS autoimmunity
Pierson, E. R., Simmons, S. B., Castelli, L., & Goverman, J. M. (2012) · Immunological Reviews · doi:10.1111/j.1600-065x.2012.01126.x · Cited by 188
Lipocalin-2 Is a Chemokine Inducer in the Central Nervous System
Lee, S., Kim, J., Kim, J., Seo, J.-W., Han, H. S., Lee, W., Mori, K., Nakao, K., Barasch, J. M., & Suk, K. (2011) · Journal of Biological Chemistry · doi:10.1074/jbc.m111.299248 · Cited by 175
Luchetti, S., Huitinga, I., & Swaab, D. F. (2011) · Neuroscience · doi:10.1016/j.neuroscience.2011.04.010 · Cited by 164
Initiation and Progression of Axonopathy in Experimental Autoimmune Encephalomyelitis
Soulika, A. M., Lee, E., McCauley, E., Miers, L. A., Bannerman, P. G. C., & Pleasure, D. (2009) · Journal of Neuroscience · doi:10.1523/jneurosci.3794-09.2009 · Cited by 161
Inflammation Subverts Hippocampal Synaptic Plasticity in Experimental Multiple Sclerosis
Nisticò, R., Mango, D., Mandolesi, G., Piccinin, S., Berretta, N., Pignatelli, M., Feligioni, M., Musella, A., Gentile, A., Mori, F., et al. (2013) · PLoS ONE · doi:10.1371/journal.pone.0054666 · Cited by 161
Rasmussen, S., Wang, Y., Kivisäkk, P., Bronson, R. T., Meyer, M., Imitola, J., & Khoury, S. J. (2007) · Brain · doi:10.1093/brain/awm219 · Cited by 154
Peterson, R. S., Saldanha, C. J., & Schlinger, B. A. (2001) · Journal of Neuroendocrinology · doi:10.1046/j.1365-2826.2001.00647.x · Cited by 141
Neuroprotective effects of testosterone treatment in men with multiple sclerosis
Kurth, F., Eileen Luders, A., Sicotte, N. L., Gaser, C., Giesser, B. S., Swerdloff, R. S., Montag, M. J., Voskuhl, R. R., & MacKenzie‐Graham, A. J. (2014) · NeuroImage Clinical · doi:10.1016/j.nicl.2014.03.001 · Cited by 138
Self-citationLipocalin-2 Protein Deficiency Ameliorates Experimental Autoimmune Encephalomyelitis
Nam, Y., Kim, J.-H., Seo, M., Kim, J., Jin, M., Jeon, S., Seo, J.-W., Lee, W., Bing, S. J., Jee, Y., et al. (2014) · Journal of Biological Chemistry · doi:10.1074/jbc.m113.542282 · Cited by 137
Du, S., Itoh, N., Askarinam, S., Hill, H., Arnold, A. P., & Voskuhl, R. R. (2014) · Proceedings of the National Academy of Sciences · doi:10.1073/pnas.1307091111 · Cited by 131
Self-citationFester, L., Zhou, L., Bütow, A., Huber, C., von Lossow, R., Prange‐Kiel, J., Jarry, H., & Rune, G. M. (2009) · Hippocampus · doi:10.1002/hipo.20548 · Cited by 129
Bielicki, J. K., Zhang, H., Cortez, Y., Zheng, Y. Y., Narayanaswami, V., Patel, A., Johansson, J., & Azhar, S. (2010) · Journal of Lipid Research · doi:10.1194/jlr.m003665 · Cited by 126
ABCA1 Agonist Reverses the ApoE4-Driven Cognitive and Brain Pathologies
Boehm-Cagan, A., Bar, R., Liraz, O., Bielicki, J. K., Johansson, J. O., & Michaelson, D. M. (2016) · Journal of Alzheimer's Disease · doi:10.3233/jad-160467 · Cited by 116
Ziehn, M. O., Avedisian, A., Dervin, S., Umeda, E., O'Dell, T., & Voskuhl, R. (2012) · Journal of Neuroscience · doi:10.1523/jneurosci.2796-12.2012 · Cited by 98
Self-citationPathological differences between white and grey matter multiple sclerosis lesions
Prins, M., Schul, E., Geurts, J. J. G., van der Valk, P., Drukarch, B., & van Dam, A. (2015) · Annals of the New York Academy of Sciences · doi:10.1111/nyas.12841 · Cited by 89
van de Kraats, C., Killestein, J., Popescu, V., Rijkers, E., Vrenken, H., Lütjohann, D., Barkhof, F., Polman, C. H., & Teunissen, C. E. (2013) · Multiple Sclerosis Journal · doi:10.1177/1352458513499421 · Cited by 85
Ko, Y., Ament, S. A., Eddy, J. A., Caballero-Pérez, J., Earls, J. C., Hood, L., & Price, N. D. (2013) · Proceedings of the National Academy of Sciences · doi:10.1073/pnas.1222897110 · Cited by 84
Gender Differences in Multiple Sclerosis
Luchetti, S., van Eden, C. G., Schuurman, K. G., van Strien, M. E., Swaab, D. F., & Huitinga, I. (2014) · Journal of Neuropathology & Experimental Neurology · doi:10.1097/nen.0000000000000037 · Cited by 82
APOE ε4 allele is associated with cognitive impairment in patients with multiple sclerosis
Shi, J., Zhao, C., Vollmer, T. R., Tyry, T. M., & Kuniyoshi, S. M. (2007) · Neurology · doi:10.1212/01.wnl.0000264004.62612.44 · Cited by 82
Purkinje Cell Loss in Experimental Autoimmune Encephalomyelitis
MacKenzie-Graham, A., Tiwari-Woodruff, S., Sharma, G., Aguilar, C., Vo, K., Strickland, L. V., Morales, L., Fubara, B., Martin, M., Jacobs, R., et al. (2009) · NeuroImage · doi:10.1016/j.neuroimage.2009.06.073 · Cited by 76
Self-citationSTAT1, NF-κB and ERKs play a role in the induction of lipocalin-2 expression in adipocytes
Zhao, P., & Stephens, J. M. (2013) · Molecular Metabolism · doi:10.1016/j.molmet.2013.04.003 · Cited by 73
Koenig, K. A., Sakaie, K., Lowe, M. J., Lin, J. Y., Stone, L. A., Bermel, R. A., Beall, E. B., Rao, S. M., Trapp, B. D., & Phillips, M. D. (2014) · Magnetic Resonance Imaging · doi:10.1016/j.mri.2013.12.012 · Cited by 73
Clarkson, B. D. S., Walker, A. J., Harris, M. G., Rayasam, A., Sándor, M., & Fábry, Z. (2014) · The Journal of Immunology · doi:10.4049/jimmunol.1401320 · Cited by 68
Giatti, S., D’Intino, G., Maschi, O., Pesaresi, M., García‐Segura, L. M., Calzà, L., Caruso, D., & Melcangi, R. C. (2009) · Neurochemistry International · doi:10.1016/j.neuint.2009.09.009 · Cited by 63
Stoolman, J. S., Duncker, P. C., Huber, A. K., & Segal, B. M. (2014) · The Journal of Immunology · doi:10.4049/jimmunol.1400825 · Cited by 55
Estriol preserves synaptic transmission in the hippocampus during autoimmune demyelinating disease
Ziehn, M. O., Avedisian, A., Dervin, S., O'Dell, T., & Voskuhl, R. (2012) · Laboratory Investigation · doi:10.1038/labinvest.2012.76 · Cited by 55
Self-citationPathological Involvement of Astrocyte-Derived Lipocalin-2 in the Demyelinating Optic Neuritis
Chun, B. Y., Kim, J., Nam, Y., Huh, M., Han, S. W., & Suk, K. (2015) · Investigative Ophthalmology & Visual Science · doi:10.1167/iovs.15-16851 · Cited by 47
Bringing CLARITY to gray matter atrophy
Spence, R. D., Kurth, F., Itoh, N., Mongerson, C. R., Wailes, S. H., Peng, M. S., & MacKenzie‐Graham, A. J. (2014) · NeuroImage · doi:10.1016/j.neuroimage.2014.07.017 · Cited by 44
Self-citationItoh, N., Kim, R. Y., Peng, M. S., DiFilippo, E., Johnsonbaugh, H. B., MacKenzie‐Graham, A. J., & Voskuhl, R. R. (2016) · Journal of Neuroimmunology · doi:10.1016/j.jneuroim.2016.09.017 · Cited by 44
Self-citationBurbach, G. J., Dehn, D., Nagel, B., Turco, D. D., & Deller, T. (2004) · Journal of Neuroscience Methods · doi:10.1016/j.jneumeth.2004.03.022 · Cited by 44
Burbach, G. J., Dehn, D., Turco, D. D., Staufenbiel, M., & Deller, T. (2004) · Glia · doi:10.1002/glia.20057 · Cited by 36
Differential effects of apoE4 and activation of ABCA1 on brain and plasma lipoproteins
Boehm-Cagan, A., Bar, R., Harats, D., Shaish, A., Levkovitz, H., Bielicki, J. K., Johansson, J. O., & Michaelson, D. M. (2016) · PLOS ONE · doi:10.1371/journal.pone.0166195 · Cited by 29
Disability-Specific Atlases of Gray Matter Loss in Relapsing-Remitting Multiple Sclerosis
MacKenzie-Graham, A., Kurth, F., Itoh, Y., Wang, H.-J., Montag, M. J., Elashoff, R., & Voskuhl, R. (2016) · JAMA Neurology · doi:10.1001/jamaneurol.2016.0966 · Cited by 28
Self-citationCognitive Impairment in Neurological Diseases: Lessons from Apolipoprotein E
Shi, J., Han, P., & Kuniyoshi, S. M. (2013) · Journal of Alzheimer s Disease · doi:10.3233/jad-130623 · Cited by 22
Why use sex hormones in relapsing-remitting multiple sclerosis? – Authors' reply
Voskuhl, R. R., Wang, H., & Elashoff, R. M. (2016) · The Lancet Neurology · doi:10.1016/s1474-4422(16)00129-0 · Cited by 6
Self-citationSimvastatin in patients with progressive multiple sclerosis
Giovannoni, G., Baker, D., & Schmierer, K. (2014) · The Lancet · doi:10.1016/s0140-6736(14)61621-4 · Cited by 2
Cortical Volume Loss and Neurologic Dysfunction in Multiple Sclerosis
Racke, M. K., & Imitola, J. (2016) · JAMA Neurology · doi:10.1001/jamaneurol.2016.1535 · Cited by 2
Zujovic (2000) · doi:10.1002/(sici)1098-1136(20000215)29:4
Cited by
Sorted by citations
Reactive astrocyte nomenclature, definitions, and future directions
Escartin, C., Galea, E., Lakatos, A., O’Callaghan, J. P., Petzold, G. C., Serrano-Pozo, A., Steinhäuser, C., Volterra, A., Carmignoto, G., Agarwal, A., et al. (2021) · Nature Neuroscience · doi:10.1038/s41593-020-00783-4 · Cited by 2,513
Self-citationIdentification of region-specific astrocyte subtypes at single cell resolution
Batiuk, M. Y., Martirosyan, A., Wahis, J., de Vin, F., Marneffe, C., Kusserow, C., Koeppen, J., Viana, J. F., Oliveira, J. F., Voet, T., et al. (2020) · Nature Communications · doi:10.1038/s41467-019-14198-8 · Cited by 805
Astrocyte Reactivity: Subtypes, States, and Functions in CNS Innate Immunity
Sofroniew, M. V. (2020) · Trends in Immunology · doi:10.1016/j.it.2020.07.004 · Cited by 721
Self-citationFunction and therapeutic value of astrocytes in neurological diseases
Lee, H.-G., Wheeler, M. A., & Quintana, F. J. (2022) · Nature Reviews Drug Discovery · doi:10.1038/s41573-022-00390-x · Cited by 662
MAFG-driven astrocytes promote CNS inflammation
Wheeler, M. A., Clark, I. C., Tjon, E. C., Li, Z., Zandee, S. E. J., Couturier, C. P., Watson, B. R., Scalisi, G., Alkwai, S., Rothhammer, V., et al. (2020) · Nature · doi:10.1038/s41586-020-1999-0 · Cited by 501
Metadata
- Authors
- Itoh, N., Itoh, Y., Tassoni, A., Ren, E., Kaito, M., Ohno, A., Ao, Y., Farkhondeh, V., Johnsonbaugh, H., Burda, J., Sofroniew, M. V., & Voskuhl, R. R.
- Affiliations
- University of California, Los Angeles (US)
- Department of Neurobiology, University of California, Los Angeles, CA 90095
- Corresponding author
- Voskuhl, Rhonda R.
- ORCID
- Venue
- Proceedings of the National Academy of Sciences
- Publisher
- National Academy of Sciences
- Published
- 2017-12-26
- Volume
- 115
- Issue
- 2
- Pages
- E302-E309
- ISSN
- 0027-8424 (ISSN-L)
- 1091-6490
- PMC
- PMC5777065
- OpenAlex
- W2777702274
- Cited by
- 253
- References
- 71
- Citations by year
- 2026: 10 · 2025: 22 · 2024: 25 · 2023: 38 · 2022: 37 · 2021: 42 · 2020: 40 · 2019: 27 · 2018: 12
- FWCI
- 16.96
- Type
- journal article
- Language
- en
- Open access
- hybrid
- doi.org
- Licence
- Locations
- Proceedings of the National Academy of Sciences (publishedVersion, cc-by-nc-nd)
- Europe PMC (PubMed Central) (publishedVersion, cc-by-nc-nd)
- PubMed Central (publishedVersion, cc-by-nc-nd)
- PubMed (publishedVersion)
- eScholarship (California Digital Library) (submittedVersion)
- eScholarship (California Digital Library) (submittedVersion, cc-by-nc-nd)
- Funders
- Conrad N. Hilton Foundation (20150232)
- Office of Extramural Research, National Institutes of Health (R01NS096748)
- California Community Foundation (BAPP-15-118094)
- Topics
- Health Sciences › Medicine › Clinical Neurology › Multiple Sclerosis Research Studies
- Life Sciences › Neuroscience › Neurology › Neuroinflammation and Neurodegeneration Mechanisms
- Life Sciences › Biochemistry, Genetics and Molecular Biology › Molecular Biology › Single-cell and spatial transcriptomics
- Keywords
- multiple sclerosis, experimental autoimmune encephalomyelitis, astrocytes, region-specific gene expression, RiboTag, cholesterol biosynthesis, neuroinflammation, spinal cord, optic nerve, optic chiasm, cerebellum, cerebral cortex, hippocampus, multifocality
- MeSH terms
- Animals, Astrocytes, Cholesterol, Encephalomyelitis, Autoimmune, Experimental, Gene Expression Regulation, Homeostasis, Mice, Inbred C57BL, Multiple Sclerosis, RNA, Messenger, Down-Regulation, Up-Regulation, Mice, Transcriptome
About these checks
Registry, retraction, Cites and statistics results are computed, not judged, with one exception: a printed reference that no index lists is read once by a model before it counts as a citation error. Claims are extracted by a model and kept only when their quote appears verbatim in the text; each cited source is then checked, with a model’s help, for whether it says what the claim relies on. Those verdicts can be wrong — read the claim’s quote and the cited source before relying on one.
Statistics and arithmetic are recomputed, not judged.
Confidence bands are shown only for fields calibrated on our annotated test set. None is calibrated yet, so no band is shown.
What counts as a claim ›How we measure confidence ›How we check this ›
Are you an author, or do you see a problem with this page? Request a review
