Cited by 56

The DOI matches its Crossref record; 5 of the 5 references it cites were found in a registry or an index.

Increased thermogenesis by a noncanonical pathway in ANGPTL3/8-deficient mice

Banfi, Serena, Gusarova, Viktoria, Gromada, Jesper, Cohen, Jonathan C., Hobbs, Helen H.·2018·Proceedings of the National Academy of Sciences

Abstract

Significance: White adipose tissue (WAT) serves as an energy reservoir during fasting and is replenished with fatty acids from circulating triglycerides upon refeeding. We showed previously that postprandial partitioning of fatty acids between oxidative and storage tissues is mediated by angiopoietin-like proteins 3 (A3) and 8 (A8). Here, we show that disruption of both Angptl3 and Angptl8 in mice causes striking alterations in energy metabolism: reduced fat mass, hyperthermia, increased metabolic rate, and beiging of subcutaneous WAT. The hypermetabolic features of the A3 −/− A8 −/− mice were most pronounced in fed animals, and attenuated with fasting and β3-adrenergic receptor blockade. These data indicate that A3 and A8 promote efficient energy utilization by tissues and limit the increase in energy expenditure associated with food intake.

Overview

The claims and statistics of this paper haven’t been checked yet.

Run the check — free, no account needed. It reads the open-access text and checks the sources it cites.

A few free checks a day · papers already verified open instantly · results are public

Integrity signals

Registry

Crossref · 10.1073/pnas.1717420115

Cites

5 of 5 references verified0 citation errors · 0 not checkable

Statistics

Figures

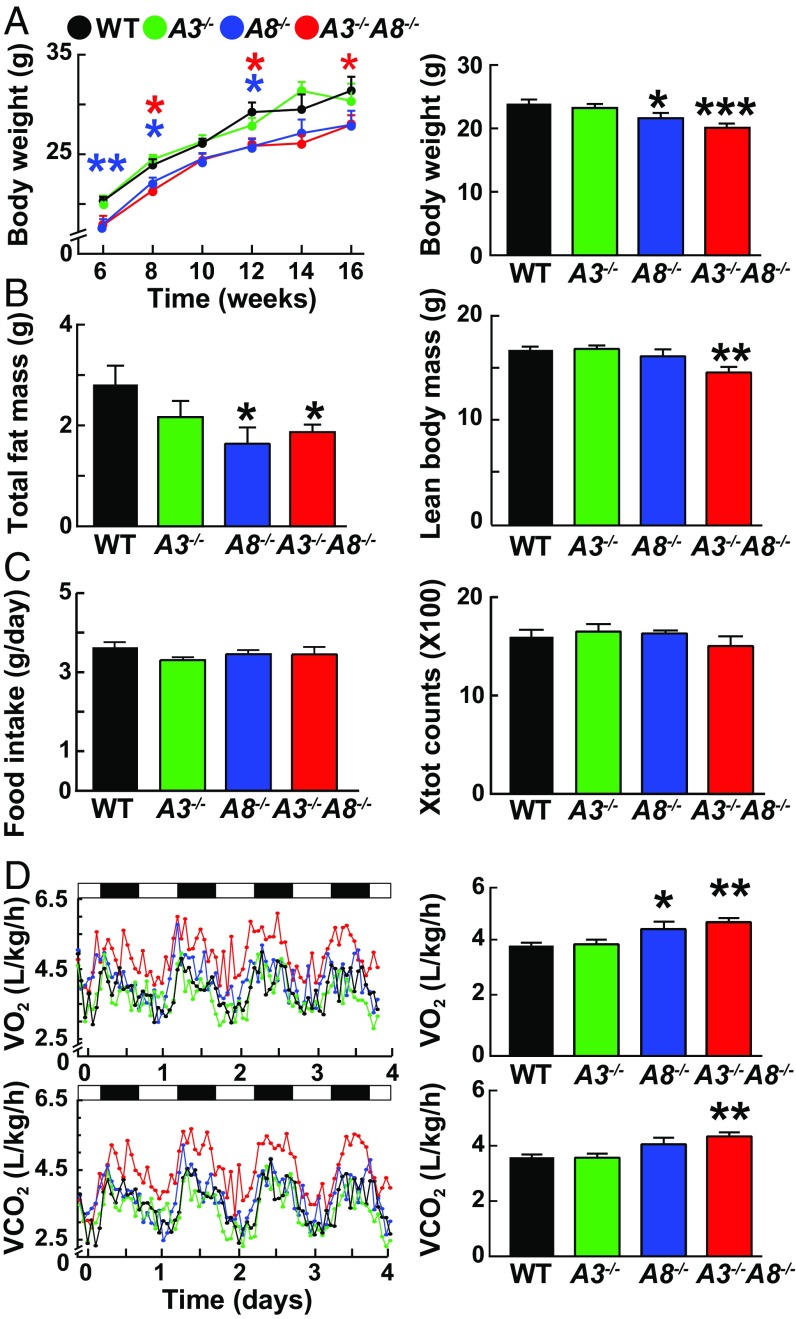
Fig. 1. Metabolic characterization of A3−/−, A8−/−, A3−/−A8−/−, and WT male mice. (A) Body weights of A3−/−, A8−/−, A3−/−A8−/−, and WT mice (n = 10–12 per group) were measured every other week starting at 6 wk of age (Right). Body weight (A) and composition (B) were measured in mice aged 8–10 wk (n = 6 per group). The experiment was repeated once, and the results were similar. (C) Food intake (Left) and total activity (Right) were assessed in mice housed individually in metabolic cages for 7 d. (D) Both O2 consumption and CO2 output were measured for 1 min at 30-min intervals for four consecutive days while the mice were housed in metabolic cages (n = 9; age 8–12 wk). Values are means ± SEM. Group means for VO2 consumption and VCO2 output were compared by ANCOVA with body weight as a covariate; similar results were obtained with an unpaired t test. Group means for other parameters were compared by using unpaired t tests. *P < 0.05; **P < 0.01; ***P < 0.001.
Fig. 1. Metabolic characterization of A3−/−, A8−/−, A3−/−A8−/−, and WT male mice. (A) Body weights of A3−/−, A8−/−, A3−/−A8−/−, and WT mice (n = 10–12 per group) were measured every other week starting at 6 wk of age (Right). Body weight (A) and composition (B) were measured in mice aged 8–10 wk (n = 6 per group). The experiment was repeated once, and the results were similar. (C) Food intake (Left) and total activity (Right) were assessed in mice housed individually in metabolic cages for 7 d. (D) Both O2 consumption and CO2 output were measured for 1 min at 30-min intervals for four consecutive days while the mice were housed in metabolic cages (n = 9; age 8–12 wk). Values are means ± SEM. Group means for VO2 consumption and VCO2 output were compared by ANCOVA with body weight as a covariate; similar results were obtained with an unpaired t test. Group means for other parameters were compared by using unpaired t tests. *P < 0.05; **P < 0.01; ***P < 0.001.CC BY-NC-ND · PubMed Central
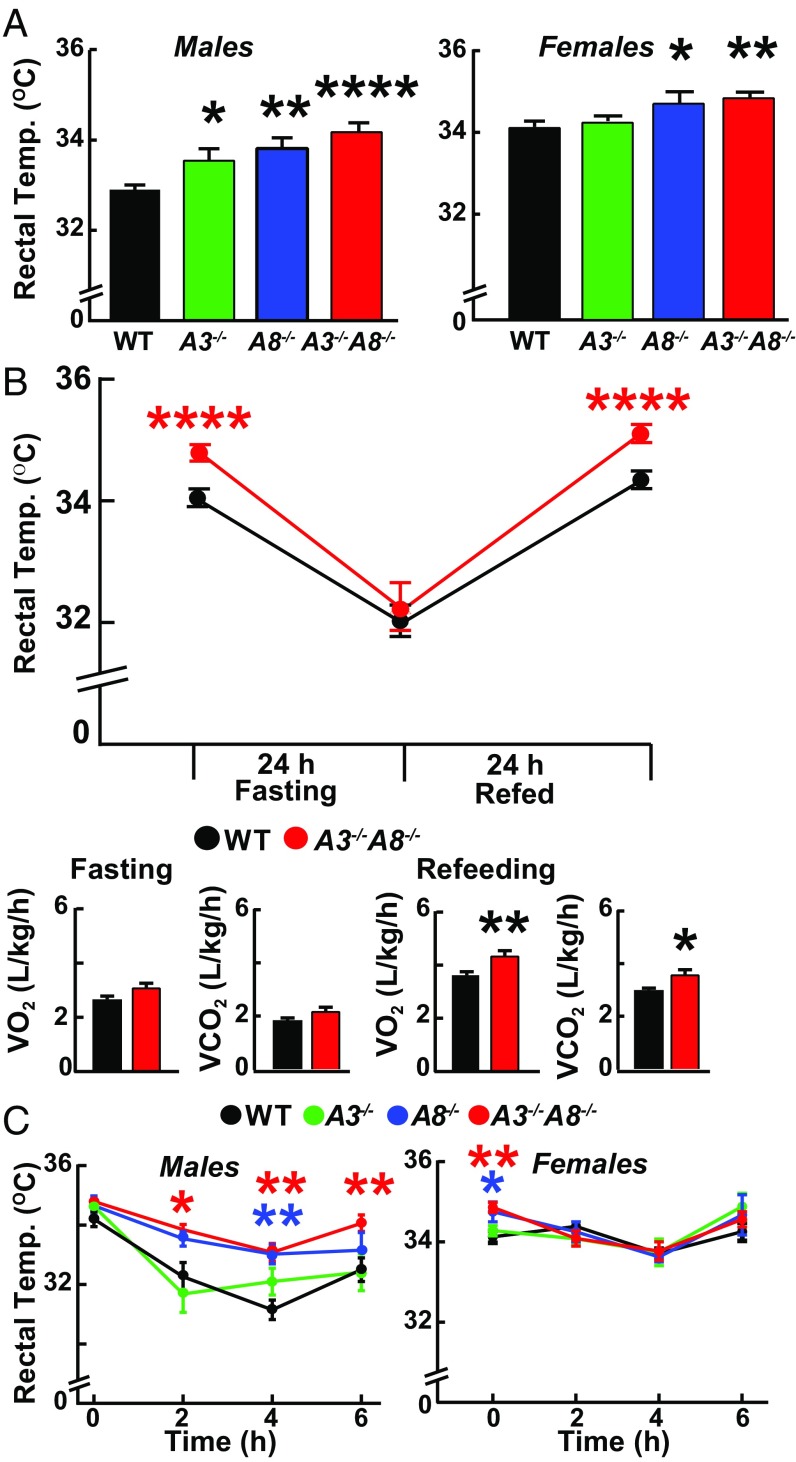
Fig. 2. Rectal temperatures of A3−/−, A8−/−, A3−/−A8−/−, and WT littermates at ambient temperature (21–23 °C) and after exposure to cold (6 °C). (A) Rectal temperatures were measured in male (Left) and female (Right) mice (n = 8–9 per group; age 7–9 wk) fed ad libitum. (B) Rectal temperatures (Upper) and indirect calorimetry measurements (Lower) were obtained in male mice (n = 11 per group, age 6–8 wk) that were fed ad libitum (Right Lower) and then after fasting for 24 h. Food was then provided, and the rectal temperature was remeasured at 24 h. VO2 consumption and CO2 output measurements were taken during the last 6 h of the fasting and refeeding periods. (C) Rectal temperatures were obtained every 2 h in male (Left) and female (Right) mice maintained for 6 h at 6 °C with free access to food (n = 5 or 6 per group, age 13–15 wk). Values are means ± SEM. Groups were compared by using unpaired t tests. *P < 0.05; **P < 0.01; ****P < 0.0001. The experiments were repeated twice, and the results were similar.
Fig. 2. Rectal temperatures of A3−/−, A8−/−, A3−/−A8−/−, and WT littermates at ambient temperature (21–23 °C) and after exposure to cold (6 °C). (A) Rectal temperatures were measured in male (Left) and female (Right) mice (n = 8–9 per group; age 7–9 wk) fed ad libitum. (B) Rectal temperatures (Upper) and indirect calorimetry measurements (Lower) were obtained in male mice (n = 11 per group, age 6–8 wk) that were fed ad libitum (Right Lower) and then after fasting for 24 h. Food was then provided, and the rectal temperature was remeasured at 24 h. VO2 consumption and CO2 output measurements were taken during the last 6 h of the fasting and refeeding periods. (C) Rectal temperatures were obtained every 2 h in male (Left) and female (Right) mice maintained for 6 h at 6 °C with free access to food (n = 5 or 6 per group, age 13–15 wk). Values are means ± SEM. Groups were compared by using unpaired t tests. *P < 0.05; **P < 0.01; ****P < 0.0001. The experiments were repeated twice, and the results were similar.CC BY-NC-ND · PubMed Central
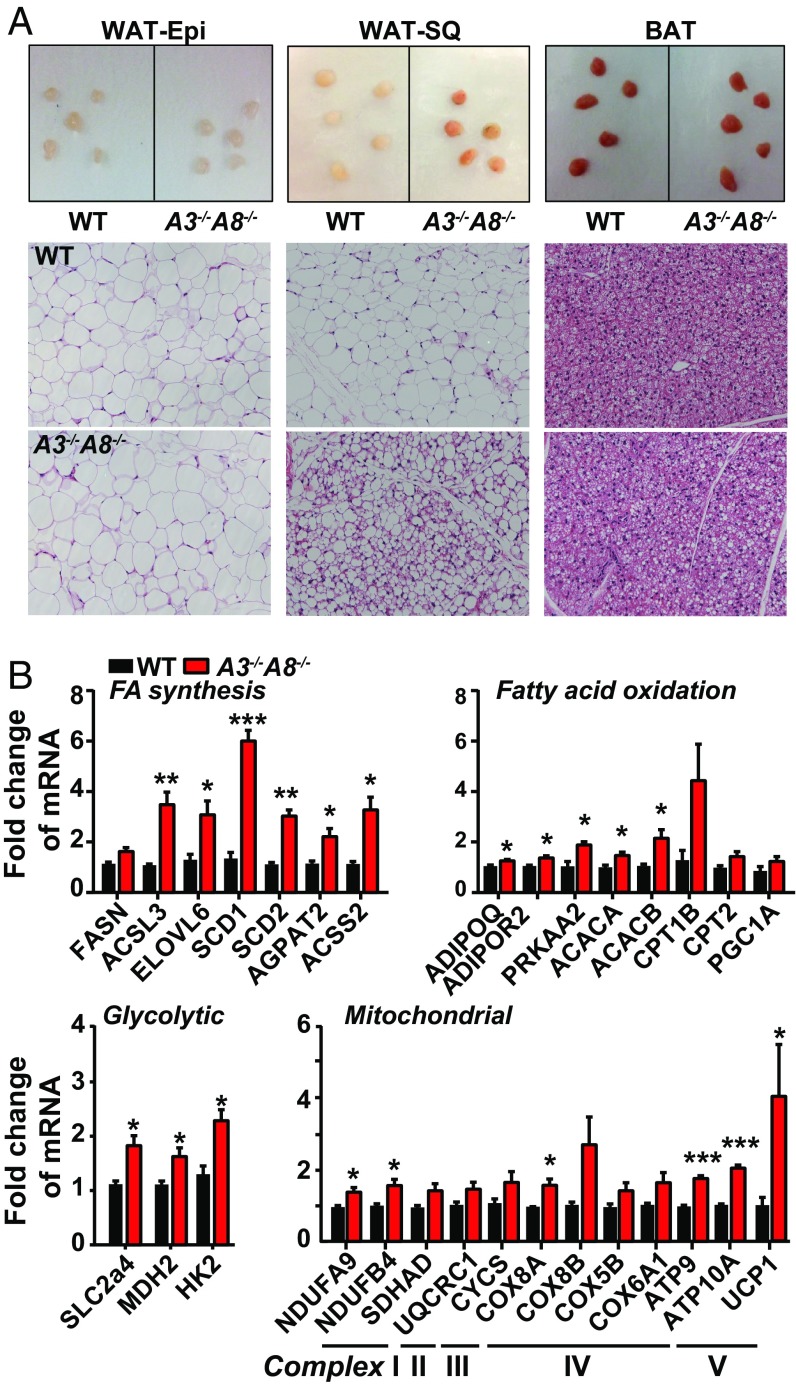
Fig. 3. Adipose tissue morphology and mRNA levels in chow-fed A3−/−A8−/− and WT littermates. (A) Representative images of tissue chunks (Upper) and H&E staining of adipose tissue sections (Lower) (n = 4; age 18 wk; three fields per mouse). (Magnification: 20×.) The experiment was repeated twice, and the results were similar. (Scale bars: 50 μm.) (B) Fold changes in levels of selected mRNAs encoding proteins involved in fatty synthesis and oxidation (Upper) and glycolysis and mitochondrial function (Lower) in WAT-SQ of male WT and A3−/−A8−/− mice (n = 3 per group; age 18 wk) fasted overnight and then fed for 4 h. Transcript levels were determined by RNA-seq as described in Materials and Methods. Values are means ± SEM. Groups were compared using unpaired t tests. *P < 0.05; **P < 0.01; ***P < 0.001. The experiment was repeated once, and the results were similar.
Fig. 3. Adipose tissue morphology and mRNA levels in chow-fed A3−/−A8−/− and WT littermates. (A) Representative images of tissue chunks (Upper) and H&E staining of adipose tissue sections (Lower) (n = 4; age 18 wk; three fields per mouse). (Magnification: 20×.) The experiment was repeated twice, and the results were similar. (Scale bars: 50 μm.) (B) Fold changes in levels of selected mRNAs encoding proteins involved in fatty synthesis and oxidation (Upper) and glycolysis and mitochondrial function (Lower) in WAT-SQ of male WT and A3−/−A8−/− mice (n = 3 per group; age 18 wk) fasted overnight and then fed for 4 h. Transcript levels were determined by RNA-seq as described in Materials and Methods. Values are means ± SEM. Groups were compared using unpaired t tests. *P < 0.05; **P < 0.01; ***P < 0.001. The experiment was repeated once, and the results were similar.CC BY-NC-ND · PubMed Central
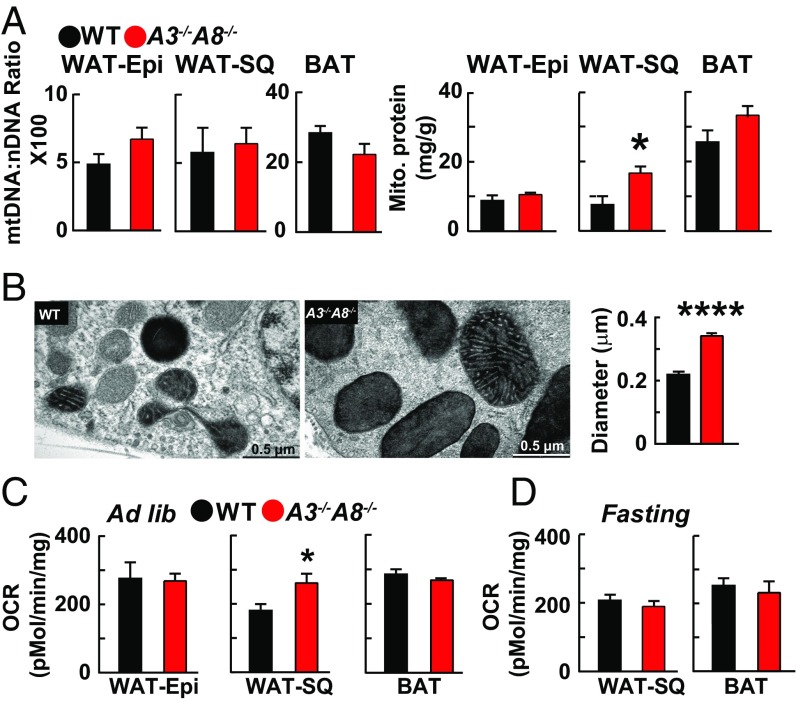
Fig. 4. Mitochondrial number, protein content, and size in WAT-SQ from A3−/−A8−/− and WT mice. (A) Ratio of mitochondrial to nuclear DNA (Left) and mitochondrial protein content (Right) of WAT-Epi, WAT-SQ, and BAT was determined by using mitochondria isolated by centrifugation. The amount of protein was normalized by tissue sample weight (n = 6 mice per group; age 11–13 wk). (B) Electron micrographs (Left) and mean (±SE) diameter (Right) of the mitochondria from WAT-SQ. (Scale bars: 0.5 μm.) (C and D) A Seahorse XF24 analyzer was used to measure extracellular OCRs in adipose tissue in mice fed a chow diet ad libitum (C) and after a 14-h fast (D) (n = 6; with five replicates per mouse). Values are means ± SEM. Groups were compared by using unpaired t tests. *P < 0.05; ****P < 0.00001.
Fig. 4. Mitochondrial number, protein content, and size in WAT-SQ from A3−/−A8−/− and WT mice. (A) Ratio of mitochondrial to nuclear DNA (Left) and mitochondrial protein content (Right) of WAT-Epi, WAT-SQ, and BAT was determined by using mitochondria isolated by centrifugation. The amount of protein was normalized by tissue sample weight (n = 6 mice per group; age 11–13 wk). (B) Electron micrographs (Left) and mean (±SE) diameter (Right) of the mitochondria from WAT-SQ. (Scale bars: 0.5 μm.) (C and D) A Seahorse XF24 analyzer was used to measure extracellular OCRs in adipose tissue in mice fed a chow diet ad libitum (C) and after a 14-h fast (D) (n = 6; with five replicates per mouse). Values are means ± SEM. Groups were compared by using unpaired t tests. *P < 0.05; ****P < 0.00001.CC BY-NC-ND · PubMed Central
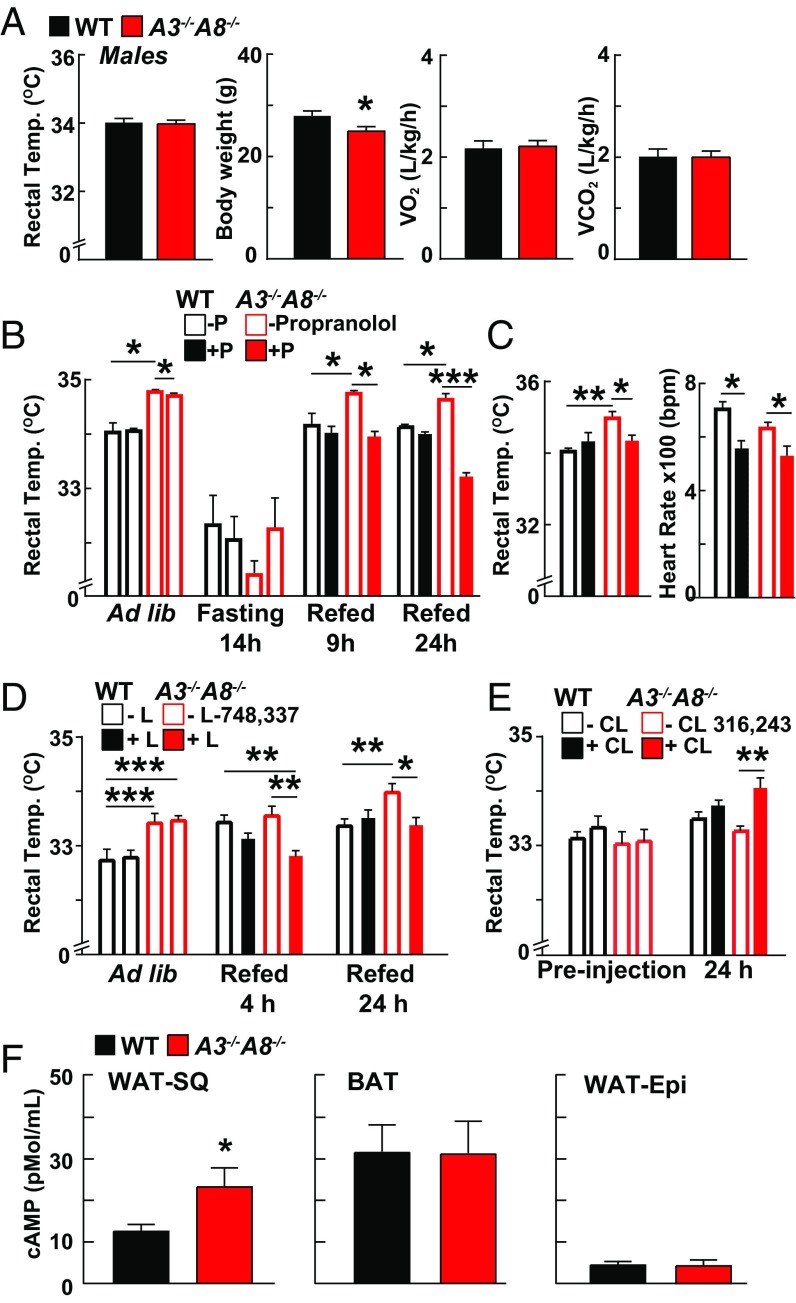
Fig. 5. Effect of thermoneutrality and β-AR blockade on rectal temperature in A3−/−A8−/− and WT chow-fed mice. (A) Six-week-old male A3−/−A8−/− and WT mice (n = 8 per group) were maintained at thermoneutrality for 5 wk. Rectal temperatures, body weights, VO2 consumption, and VCO2 output were measured as described in the Materials and Methods. (B) Rectal temperatures were obtained in mice fed ad libitum (first 4 bars) or after a 14-h fast (second 4 bars) (n = 6; age 9–12 wk). The mice were then treated with a nonselective β-adrenergic blocker (propranolol; 5 mg/kg) and provided food. Temperatures were monitored as described in Materials and Methods. (C) Male mice (n = 5 per group) were treated chronically with propranolol (0.5 mg/mL in the drinking water) starting at 6 wk of age for 5 wk. Heart rates were measured as a control for propranolol activity. (D) Mice (n = 5 per group; age 7–9 wk) were treated with l-748,337 compound, a β3-receptor blocker (5 mg/kg). (E) Male mice were maintained at thermoneutrality for 5 wk and then injected twice with CL 316,243 (1 mg/kg, 18 h apart) (n = 4; age 16–17 wk). Values are means ± SEM. Group means were compared by using unpaired t tests. Experiments were repeated once, and the results were similar. (F) cAMP levels were measured in tissue lysates from WAT-SQ, BAT, and WAT-Epi of WT and A3−/−A8−/− mice fed ad libitum (n = 5; age 8–11 wk). Levels were measured by using an ELISA, as described in Materials and Methods. Values are means ± SEM. Groups were compared by using unpaired t tests. Experiments were repeated once, and the results were similar. CL, CL 316,243; L, l-748,337; P, propranolol. *P < 0.05; **P < 0.01; ***P < 0.001.
Fig. 5. Effect of thermoneutrality and β-AR blockade on rectal temperature in A3−/−A8−/− and WT chow-fed mice. (A) Six-week-old male A3−/−A8−/− and WT mice (n = 8 per group) were maintained at thermoneutrality for 5 wk. Rectal temperatures, body weights, VO2 consumption, and VCO2 output were measured as described in the Materials and Methods. (B) Rectal temperatures were obtained in mice fed ad libitum (first 4 bars) or after a 14-h fast (second 4 bars) (n = 6; age 9–12 wk). The mice were then treated with a nonselective β-adrenergic blocker (propranolol; 5 mg/kg) and provided food. Temperatures were monitored as described in Materials and Methods. (C) Male mice (n = 5 per group) were treated chronically with propranolol (0.5 mg/mL in the drinking water) starting at 6 wk of age for 5 wk. Heart rates were measured as a control for propranolol activity. (D) Mice (n = 5 per group; age 7–9 wk) were treated with l-748,337 compound, a β3-receptor blocker (5 mg/kg). (E) Male mice were maintained at thermoneutrality for 5 wk and then injected twice with CL 316,243 (1 mg/kg, 18 h apart) (n = 4; age 16–17 wk). Values are means ± SEM. Group means were compared by using unpaired t tests. Experiments were repeated once, and the results were similar. (F) cAMP levels were measured in tissue lysates from WAT-SQ, BAT, and WAT-Epi of WT and A3−/−A8−/− mice fed ad libitum (n = 5; age 8–11 wk). Levels were measured by using an ELISA, as described in Materials and Methods. Values are means ± SEM. Groups were compared by using unpaired t tests. Experiments were repeated once, and the results were similar. CL, CL 316,243; L, l-748,337; P, propranolol. *P < 0.05; **P < 0.01; ***P < 0.001.CC BY-NC-ND · PubMed Central
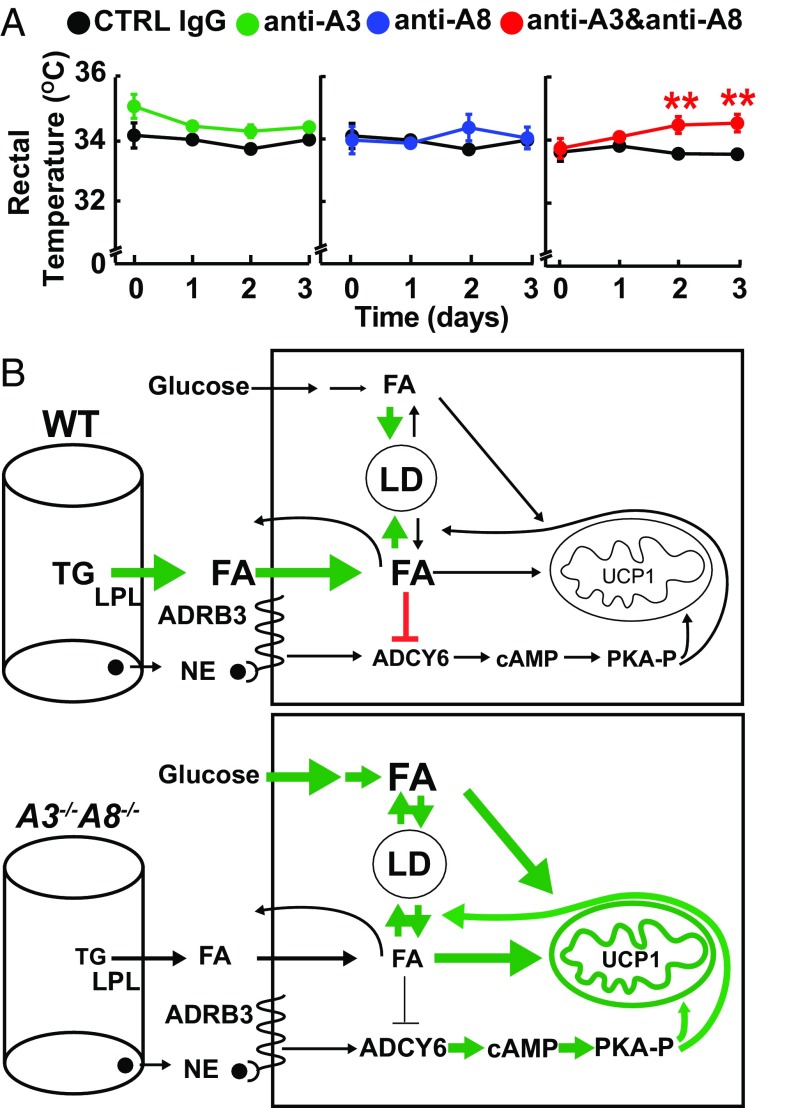
Fig. 6. Effect of inactivating circulating A3, A8, and A3 plus A8 on rectal temperature. (A) Anti-human A8 (REGN3776; 10 mg/kg) and anti-mouse A3 (REGN1500; 10 mg/kg) or control monoclonal antibodies (CTRL IgG; RG1945) were given i.v. for 3 d to ANGPTL8hum/hum mice (n = 6 per group; age 9 wk). Values are means ± SEM. Groups were compared by using unpaired t tests. **P < 0.01. The experiment was repeated, and the results were similar. (B) Overview of postprandial TG metabolism in WAT-SQ from WT (Upper) and A3−/−A8−/− (Lower) mice. In fed WT mice, circulating dietary TGs are hydrolyzed by LPL, and FAs are taken up into adipocytes, where they are esterified and stored as TG in lipid droplets. Norepinephrine (NE) activates β3-AR, resulting in activation of ADCY6, which generates cAMP and subsequent phosphorylation and activation of protein kinase A (PKA-P). PKA-P activates both TG hydrolysis and oxidative phosphorylation; the rise in intracellular FA inhibits ADCY6, thus inhibiting these downstream pathways. In WAT-SQ from A3−/−A8−/− mice, LPL in oxidative tissues fails to be suppressed, resulting in diminished delivery of circulating TG to WAT (9). Glucose uptake and its conversion to FAs is increased in these animals. The reduced intracellular concentration of FA may fail to suppress ADCY6, accounting for the increased in cAMP levels. We hypothesize that this results in activation of PKA, causing an increase in both lipolysis and oxidative phosphorylation.
Fig. 6. Effect of inactivating circulating A3, A8, and A3 plus A8 on rectal temperature. (A) Anti-human A8 (REGN3776; 10 mg/kg) and anti-mouse A3 (REGN1500; 10 mg/kg) or control monoclonal antibodies (CTRL IgG; RG1945) were given i.v. for 3 d to ANGPTL8hum/hum mice (n = 6 per group; age 9 wk). Values are means ± SEM. Groups were compared by using unpaired t tests. **P < 0.01. The experiment was repeated, and the results were similar. (B) Overview of postprandial TG metabolism in WAT-SQ from WT (Upper) and A3−/−A8−/− (Lower) mice. In fed WT mice, circulating dietary TGs are hydrolyzed by LPL, and FAs are taken up into adipocytes, where they are esterified and stored as TG in lipid droplets. Norepinephrine (NE) activates β3-AR, resulting in activation of ADCY6, which generates cAMP and subsequent phosphorylation and activation of protein kinase A (PKA-P). PKA-P activates both TG hydrolysis and oxidative phosphorylation; the rise in intracellular FA inhibits ADCY6, thus inhibiting these downstream pathways. In WAT-SQ from A3−/−A8−/− mice, LPL in oxidative tissues fails to be suppressed, resulting in diminished delivery of circulating TG to WAT (9). Glucose uptake and its conversion to FAs is increased in these animals. The reduced intracellular concentration of FA may fail to suppress ADCY6, accounting for the increased in cAMP levels. We hypothesize that this results in activation of PKA, causing an increase in both lipolysis and oxidative phosphorylation.CC BY-NC-ND · PubMed Central

Verification

Claims the paper makes

The claims and statistics of this paper haven’t been checked yet.

Run the check — free, no account needed. It reads the open-access text and checks the sources it cites.

A few free checks a day · papers already verified open instantly · results are public

Claims other papers make about this one

Each is checked against this paper’s own text: does it say what the citing paper says it does?

Self-check

Percentages, sums and reported differences re-computed from the paper’s own numbers.

The self-check needs the paper’s full text.

Citations

Cites

Show all 5 references

Research works printed but not linked: 35

  1. 10.1016/0026-0495(88)90178-3 · DOI
  2. 10.1016/j.bbalip.2014.03.013 · DOI
  3. 10.1074/jbc.M004029200 · DOI · Paper page
  4. 10.1152/ajpendo.00084.2012 · DOI · Paper page
  5. 10.1016/j.bbrc.2012.07.038 · DOI · Paper page
  6. 10.1073/pnas.1217552109 · DOI · Paper page
  7. 10.1073/pnas.1315292110 · DOI · Paper page
  8. 10.1073/pnas.1515374112 · DOI · Paper page
  9. 10.1194/jlr.M075689 · DOI · Paper page
  10. 10.1016/j.cmet.2015.09.007 · DOI
  11. 10.2337/db14-0647 · DOI
  12. 10.1016/j.cmet.2008.10.004 · DOI
  13. 10.1242/dev.126.10.2045 · DOI
  14. 10.1371/journal.pone.0087405 · DOI
  15. 10.1038/210426a0 · DOI
  16. 10.1038/nm.3361 · DOI · Paper page
  17. S Collins, , Impaired expression and functional activity of the beta 3- and beta 1-adrenergic receptors in adipose tissue of congenitally obese (C57BL/6J ob/ob) mice. Mol Endocrinol 8, 518–527 (1994).
  18. 10.1194/jlr.M054890 · DOI · Paper page
  19. 10.1210/en.2016-1894 · DOI
  20. 10.1079/BJN19740042 · DOI
  21. 10.1016/j.tem.2015.11.002 · DOI
  22. 10.1371/journal.pgen.1004514 · DOI
  23. 10.1152/ajpendo.00093.2016 · DOI
  24. 10.1002/j.1460-2075.1991.tb04940.x · DOI
  25. 10.1002/j.1550-8528.1997.tb00584.x · DOI
  26. 10.1016/j.cmet.2008.12.014 · DOI · Paper page
  27. 10.1152/ajpendo.00097.2017 · DOI
  28. 10.1073/pnas.94.19.10261 · DOI
  29. 10.1172/JCI200515972 · DOI
  30. 10.1074/jbc.M113.469270 · DOI · Paper page
  31. 10.1016/j.bbalip.2012.11.011 · DOI
  32. 10.1152/ajpendo.00039.2011 · DOI
  33. 10.1016/0003-2697(76)90527-3 · DOI · Paper page
  34. 10.1016/B978-0-12-800280-3.00013-X · DOI
  35. 10.1038/nmeth.1806 · DOI · Paper page

Cited by

Sorted by citations

Metadata

Authors
Banfi, S., Gusarova, V., Gromada, J., Cohen, J. C., & Hobbs, H. H.
Affiliations
  • Department of Molecular Genetics, University of Texas Southwestern Medical Center, Dallas, TX 75390;
  • Regeneron Pharmaceuticals, Inc., Tarrytown, NY 10591;
  • Department of Internal Medicine, University of Texas Southwestern Medical Center, Dallas, TX 75390;
Venue
Proceedings of the National Academy of Sciences
Published
2018-01-22
Volume
115
Issue
6
ISSN
  • 0027-8424
  • 1091-6490
Cited by
56
References
5
Language
en
Funders
HHS | National Institutes of Health (5 PO1 HL20948.)

About these checks

Registry, retraction, Cites and statistics results are computed, not judged, with one exception: a printed reference that no index lists is read once by a model before it counts as a citation error. Claims are extracted by a model and kept only when their quote appears verbatim in the text; each cited source is then checked, with a model’s help, for whether it says what the claim relies on. Those verdicts can be wrong — read the claim’s quote and the cited source before relying on one.

Statistics and arithmetic are recomputed, not judged.

Confidence bands are shown only for fields calibrated on our annotated test set. None is calibrated yet, so no band is shown.

What counts as a claim ›How we measure confidence ›How we check this ›

Are you an author, or do you see a problem with this page? Request a review