

The DOI matches its Crossref record; 35 of the 36 references it cites were found in a registry or an index.
Geospatial analysis of near-term potential for carbon-negative bioenergy in the United States
Open accessAbstract
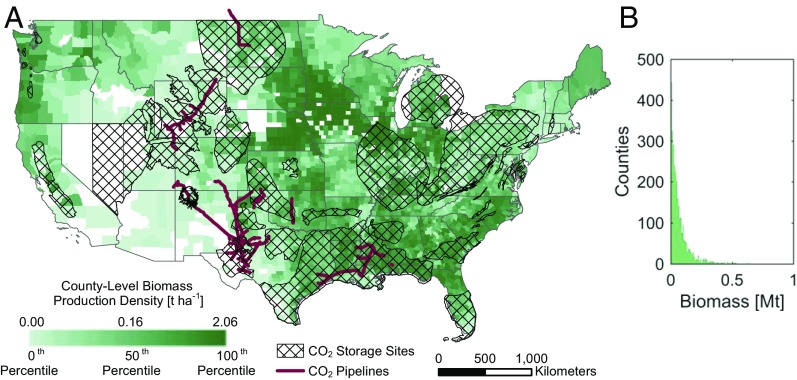
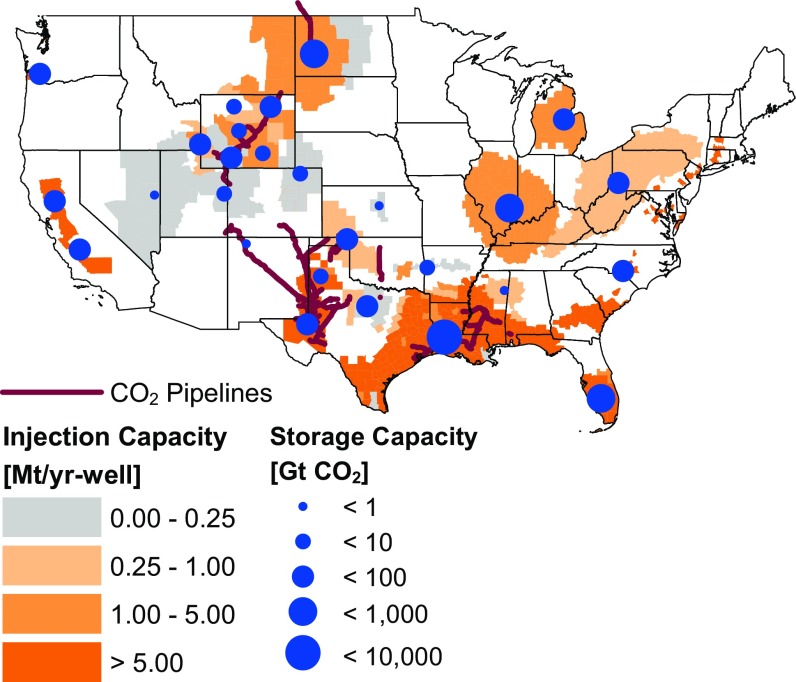
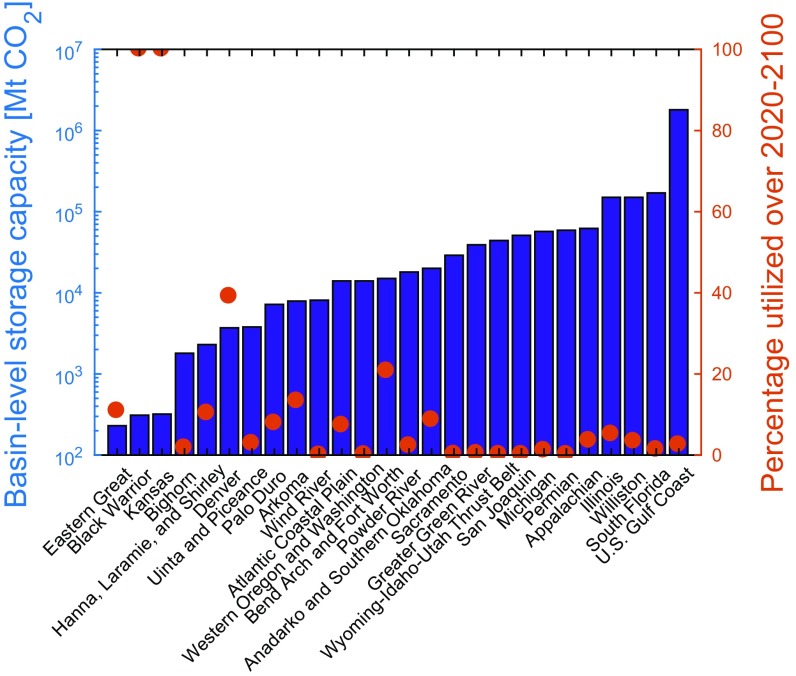
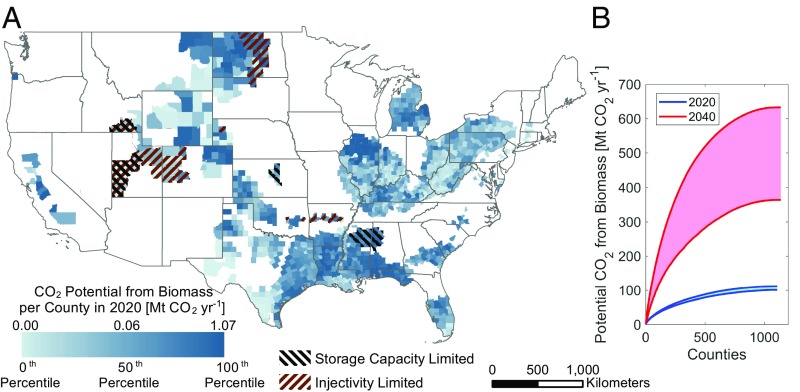
Significance: Bioenergy with carbon capture and storage (BECCS) is widely utilized in ambitious climate mitigation scenarios as a negative-emissions technology. However, the future technical potential of BECCS remains uncertain. Two significant deployment barriers that have largely been overlooked by previous studies are the suitability of existing storage sites and the availability of transportation of biomass and/or CO 2 . This study assesses the near-term deployment potential of BECCS in the United States in the absence of long-distance transportation networks. Considering these constraints, 30% of the projected available 2020 biomass resources can be utilized for BECCS, yielding a negative-emissions potential of 100 Mt CO 2 ⋅y −1 . The analysis further pinpoints areas with colocated resources that could be prioritized for near-term deployment of BECCS.
Overview
The claims and statistics of this paper haven’t been checked yet.
Run the check — free, no account needed. It reads the open-access text and checks the sources it cites.
Integrity signals
Registry
Cites
Statistics
Figures
Verification
Claims the paper makes
The claims and statistics of this paper haven’t been checked yet.
Run the check — free, no account needed. It reads the open-access text and checks the sources it cites.
Claims other papers make about this one
Each is checked against this paper’s own text: does it say what the citing paper says it does?
The source backs part of the claim, not all of it — or backs it for a different population, condition or comparison.
In the citing paper
“An important limitation for CO 2 sequestration in subsurface pore space is the maximum injectivity achievable in a given reservoir, which is 0.001-60 MtCO 2 /yr in the U.S. in sedimentary reservoirs”
From An Overview of the Status and Challenges of CO2 Storage in Minerals and Geological Formations (2019) · cites this paper as Baik et al., 2018
Experimental — accuracy not yet measuredIn the citing paper
“For example, our ERW CDR range is comparable with large-scale implementation of BECCS in USA by 2040 (0.3-0.6 Gt CO2 yr -1 ), as constrained by biomass productivity, location and capacity of CO2 storage sites 24 .”
From Potential for large-scale CO2 removal via enhanced rock weathering with croplands (2020) · cites this paper as [24]
Self-check
Percentages, sums and reported differences re-computed from the paper’s own numbers.
The self-check needs the paper’s full text.
Citations
Cites
Climate Change 2014: Mitigation of Climate Change
Change, I. P. O. C. (2015) · Cambridge University Press eBooks · doi:10.1017/cbo9781107415416 · Cited by 4,731
Biophysical and economic limits to negative CO2 emissions
Smith, P., Davis, S. J., Creutzig, F., Fuss, S., Minx, J., Gabrielle, B., Kato, E., Jackson, R. B., Cowie, A., Kriegler, E., et al. (2016) · Nature Climate Change · doi:10.1038/nclimate2870 · Cited by 1,440
The contribution of biomass in the future global energy supply: a review of 17 studies
Berndes, G., Hoogwijk, M., & van den Broek, R. (2003) · Biomass and Bioenergy · doi:10.1016/s0961-9534(02)00185-x · Cited by 1,149
Bioenergy and climate change mitigation: an assessment
Creutzig, F., Ravindranath, N. H., Berndes, G., Bolwig, S., Bright, R., Cherubini, F., Chum, H., Corbera, E., Delucchi, M., Faaij, A., et al. (2015) · GCB Bioenergy · doi:10.1111/gcbb.12205 · Cited by 752
Michael, K., Golab, A. N., Shulakova, V., Ennis‐King, J., Allinson, G., Sharma, S., & Aiken, T. (2010) · International journal of greenhouse gas control · doi:10.1016/j.ijggc.2009.12.011 · Cited by 733
Netz, B., Davidson, O. R., Bösch, P., Dave, R., & Meyer, L. (2007) · Cited by 604
McCoy, S., & Rubin, E. S. (2007) · International journal of greenhouse gas control · doi:10.1016/s1750-5836(07)00119-3 · Cited by 402
US Environmental Protection Agency (1985) · PubMed · Cited by 367
Riahi, K., Kriegler, E., Johnson, N., Bertram, C., den Elzen, M., Eom, J., Schaeffer, M., Edmonds, J., Isaac, M., Krey, V., et al. (2015) · Technological Forecasting and Social Change · doi:10.1016/j.techfore.2013.09.016 · Cited by 360
Azar, C., Lindgren, K., Obersteiner, M. H., Riahi, K., van Vuuren, D. P., den Elzen, M. G. J., Möllersten, K., & Larson, E. D. (2010) · Climatic Change · doi:10.1007/s10584-010-9832-7 · Cited by 308
Carbon dioxide capture and storage: issues and prospects
de Coninck, H., & Benson, S. M. (2014) · Annual Review of Environment and Resources · doi:10.1146/annurev-environ-032112-095222 · Cited by 268 · cited 1×
“Other potential factors influencing the ability to deploy BECCS include sufficient policy support, appropriate market conditions, and favorable public perceptions (40).”
BackgroundSelf-citationInvestigating afforestation and bioenergy CCS as climate change mitigation strategies
Humpenöder, F., Popp, A., Dietrich, J. P., Klein, D., Lotze‐Campen, H., Bonsch, M., Bodirsky, B. L., Weindl, I., Stevanović, M., & Müller, C. (2014) · Environmental Research Letters · doi:10.1088/1748-9326/9/6/064029 · Cited by 216
Popp, A., Dietrich, J. P., Lotze-Campen, H., Klein, D., Bauer, N., Krause, M., Beringer, T., Gerten, D., & Edenhofer, O. (2011) · Environmental Research Letters · doi:10.1088/1748-9326/6/3/034017 · Cited by 203
Establishing the optimal sizes of different kinds of biorefineries
Wright, M. M., & Brown, R. C. (2007) · Biofuels Bioproducts and Biorefining · doi:10.1002/bbb.25 · Cited by 197
The role of negative CO2 emissions for reaching 2 °C—insights from integrated assessment modelling
van Vuuren, D. P., Deetman, S., van Vliet, J., van den Berg, M., van Ruijven, B. J., & Koelbl, B. S. (2013) · Climatic Change · doi:10.1007/s10584-012-0680-5 · Cited by 197
Biomass enables the transition to a carbon-negative power system across western North America
Sanchez, D. L., Nelson, J. H., Johnston, J., Mileva, A., & Kammen, D. M. (2015) · Nature Climate Change · doi:10.1038/nclimate2488 · Cited by 192
Self-citationAn overview of the Illinois Basin – Decatur Project
Finley, R. J. (2014) · Greenhouse Gases Science and Technology · doi:10.1002/ghg.1433 · Cited by 161
Galik, C. S., Abt, R. C., & Yun, W. (2009) · Journal of Forestry · doi:10.1093/jof/107.2.69 · Cited by 148
Comparison of Corn and Soybean Yields in the United States: Historical Trends and Future Prospects
Egli, D. B. (2008) · Agronomy Journal · doi:10.2134/agronj2006.0286c · Cited by 148
Modeling meets science and technology: an introduction to a special issue on negative emissions
Tavoni, M., & Socolow, R. H. (2013) · Climatic Change · doi:10.1007/s10584-013-0757-9 · Cited by 148
Catalysing a political shift from low to negative carbon
Peters, G. P., & Geden, O. (2017) · Nature Climate Change · doi:10.1038/nclimate3369 · Cited by 143
Biomass Energy Data Book: Edition 4
USDOE Office of Energy Efficiency and Renewable Energy (EERE), O. O. S. T. B. T. O. (., Boundy, R. G., Diegel, S. W., Wright, L. L., & Davis, S. C. (2011) · doi:10.2172/1050890 · Cited by 139
Biomass energy with carbon capture and storage (BECCS or Bio‐CCS)
Gough, C., & Upham, P. (2011) · Greenhouse Gases Science and Technology · doi:10.1002/ghg.34 · Cited by 138
Is atmospheric carbon dioxide removal a game changer for climate change mitigation?
Kriegler, E., Edenhofer, O., Reuster, L., Luderer, G., & Klein, D. (2013) · Climatic Change · doi:10.1007/s10584-012-0681-4 · Cited by 130
A commercialization strategy for carbon-negative energy
Sanchez, D. L., & Kammen, D. M. (2016) · Nature Energy · doi:10.1038/nenergy.2015.2 · Cited by 127
Self-citationThe value of bioenergy in low stabilization scenarios: an assessment using REMIND-MAgPIE
Klein, D., Luderer, G., Kriegler, E., Strefler, J., Bauer, N., Leimbach, M., Popp, A., Dietrich, J. P., Humpenöder, F., Lotze‐Campen, H., et al. (2013) · Climatic Change · doi:10.1007/s10584-013-0940-z · Cited by 110
CO2 Pipeline Infrastructure – Lessons Learnt
Noothout, P., Wiersma, F., Hurtado, O., MacDonald, D., Kemper, J., & van Alphen, K. (2014) · Energy Procedia · doi:10.1016/j.egypro.2014.11.271 · Cited by 70
BRADSHAW, J., & Dance, T. (2005) · Elsevier eBooks · doi:10.1016/b978-008044704-9/50059-8 · Cited by 68
Dooley, J. J. (2013) · Energy Procedia · doi:10.1016/j.egypro.2013.06.429 · Cited by 64
Kato, E., & Yamagata, Y. (2014) · Earth s Future · doi:10.1002/2014ef000249 · Cited by 61
Optimal scale of carbon-negative energy facilities
Sanchez, D. L., & Callaway, D. S. (2016) · Applied Energy · doi:10.1016/j.apenergy.2016.02.134 · Cited by 46
Self-citationInjection strategies for large-scale CO2 storage sites
Michael, K., Neal, P. R., Allinson, G., Ennis‐King, J., Hou, W., Paterson, L., Sharma, S., & Aiken, T. (2011) · Energy Procedia · doi:10.1016/j.egypro.2011.02.376 · Cited by 35
Nicot, J., Hosseini, S. A., & Solano, S. V. (2011) · Energy Procedia · doi:10.1016/j.egypro.2011.02.330 · Cited by 20
Carbon Capture and Sequestration: Removing the Legal and Regulatory Barriers
Morgan, M. G., & McCoy, S. (2012) · Cited by 9
Annual 2004 Electric Generator Report
(2017) · Cited by 6
Research works printed but not linked: 3
- ; Global CCS Institute The Global Status of CCS: 2017 (Global CCS Inst, Docklands, VIC, Australia, 2017).
- ; Secretary of Energy Advisory Board Letter Report: Task Force on RD&D strategy for CO2 Utilization and/or Negative Emissions at the Gigatonne Scale (US Department of Energy, Washington, DC, 2016).
- MH Langholtz, BJ Stokes, L Eaton 2016 Billion-Ton Report (US Department of Energy, Washington, DC) Vol I, 1–411 (2016).
Cited by
Sorted by citations
Progress and perspectives of electrochemical CO2 reduction on copper in aqueous electrolyte
Nitopi, S., Bertheussen, E., Scott, S. B., Liu, X., Engstfeld, A. K., Horch, S., Seger, B., Stephens, I. E. L., Chan, K., Hahn, C., et al. (2019) · Chemical Reviews · doi:10.1021/acs.chemrev.8b00705 · Cited by 5,223
Potential for large-scale CO2 removal via enhanced rock weathering with croplands
Beerling, D. J., Kantzas, E. P., Lomas, M. R., Wade, P., Eufrasio, R. M., Renforth, P., Sarkar, B., Andrews, M. G., James, R. H., Pearce, C. R., et al. (2020) · Nature · doi:10.1038/s41586-020-2448-9 · Cited by 700
An Overview of the Status and Challenges of CO2 Storage in Minerals and Geological Formations
Kelemen, P., Benson, S. M., Pilorgé, H., Psarras, P., & Wilcox, J. (2019) · Frontiers in Climate · doi:10.3389/fclim.2019.00009 · Cited by 587
Self-citationO’Brien, C. P., Miao, R. K., Zeraati, A. S., Lee, G., Sargent, E. H., & Sinton, D. A. (2024) · Chemical Reviews · doi:10.1021/acs.chemrev.3c00206 · Cited by 386
The climate change mitigation potential of bioenergy with carbon capture and storage
Hanssen, S. V., Daioglou, V., Steinmann, Z. J. N., Doelman, J. C., Van Vuuren, D. P., & Huijbregts, M. A. J. (2020) · Nature Climate Change · doi:10.1038/s41558-020-0885-y · Cited by 301
Metadata
- Authors
- Baik, E., Sanchez, D. L., Turner, P. A., Mach, K. J., Field, C. B., & Benson, S. M.
- Affiliations
- Stanford University (US)
- Carnegie Institution for Science (US)
- Corresponding author
- Baik, Ejeong
- Venue
- Proceedings of the National Academy of Sciences
- Publisher
- National Academy of Sciences
- Published
- 2018-03-12
- Volume
- 115
- Issue
- 13
- Pages
- 3290-3295
- ISSN
- 0027-8424 (ISSN-L)
- 1091-6490
- PMC
- PMC5879697
- OpenAlex
- W2794140740
- Cited by
- 105
- References
- 36
- Citations by year
- 2026: 4 · 2025: 13 · 2024: 10 · 2023: 17 · 2022: 12 · 2021: 15 · 2020: 23 · 2019: 8 · 2018: 3
- FWCI
- 7.86
- Type
- journal article
- Language
- en
- Open access
- hybrid
- doi.org
- Licence
- Locations
- Proceedings of the National Academy of Sciences (publishedVersion, cc-by-nc-nd)
- PubMed Central (publishedVersion, cc-by-nc-nd)
- PubMed (publishedVersion)
- eScholarship (California Digital Library) (submittedVersion, cc-by-nc-nd)
- Funders
- Alexander von Humboldt-Stiftung (UDBGA, 10704)
- Topics
- Physical Sciences › Energy › Renewable Energy, Sustainability and the Environment › Forest Biomass Utilization and Management
- Physical Sciences › Energy › Renewable Energy, Sustainability and the Environment › Renewable energy and sustainable power systems
- Life Sciences › Agricultural and Biological Sciences › Agronomy and Crop Science › Bioenergy crop production and management
- Keywords
- bioenergy with carbon capture and storage, carbon dioxide removal, biomass resources, biomass transportation, CO2 transport, climate change mitigation, United States
- MeSH terms
- Biodegradation, Environmental, Carbon, Carbon Dioxide, Conservation of Energy Resources, Environmental Monitoring, Humans, United States, Biomass, Biofuels, Bioengineering, Climate Change, Carbon Sequestration
About these checks
Registry, retraction, Cites and statistics results are computed, not judged, with one exception: a printed reference that no index lists is read once by a model before it counts as a citation error. Claims are extracted by a model and kept only when their quote appears verbatim in the text; each cited source is then checked, with a model’s help, for whether it says what the claim relies on. Those verdicts can be wrong — read the claim’s quote and the cited source before relying on one.
Statistics and arithmetic are recomputed, not judged.
Confidence bands are shown only for fields calibrated on our annotated test set. None is calibrated yet, so no band is shown.
What counts as a claim ›How we measure confidence ›How we check this ›
Are you an author, or do you see a problem with this page? Request a review
