

The DOI matches its Crossref record; 2 of the 2 references it cites were found in a registry or an index.
Exosome mimetics derived from bone marrow mesenchymal stem cells deliver doxorubicin to osteosarcoma in vitro and in vivo
Overview
The claims and statistics of this paper haven’t been checked yet.
Run the check — free, no account needed. It reads the open-access text and checks the sources it cites.
Integrity signals
Registry
Cites
Statistics
Figures
Verification
Claims the paper makes
The claims and statistics of this paper haven’t been checked yet.
Run the check — free, no account needed. It reads the open-access text and checks the sources it cites.
Claims other papers make about this one
Each is checked against this paper’s own text: does it say what the citing paper says it does?
In the citing paper
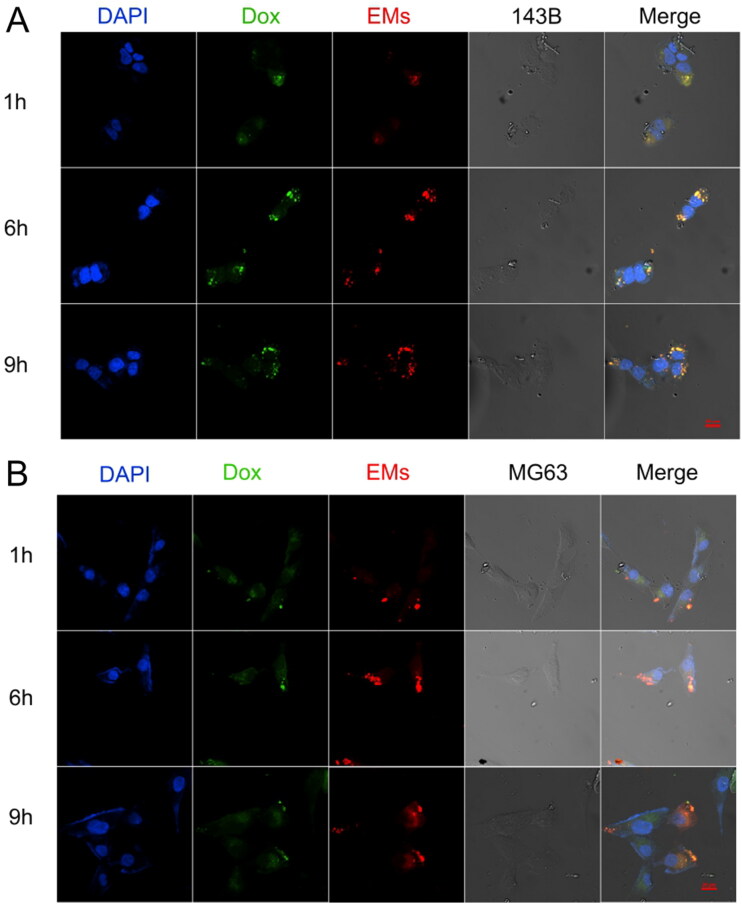
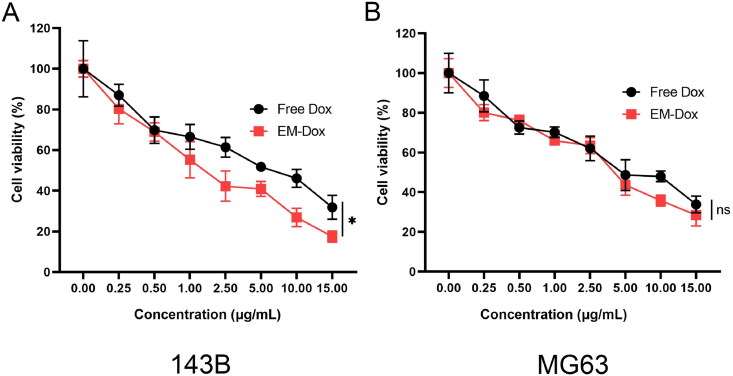
“In vitro studies confirmed efficient uptake of EM-Dox by osteosarcoma cells and demonstrated higher cytotoxicity against these cells compared to free doxorubicin.”
From Emerging role of exosomes in cancer therapy: progress and challenges (2025) · cites this paper as [282]
In the citing paper
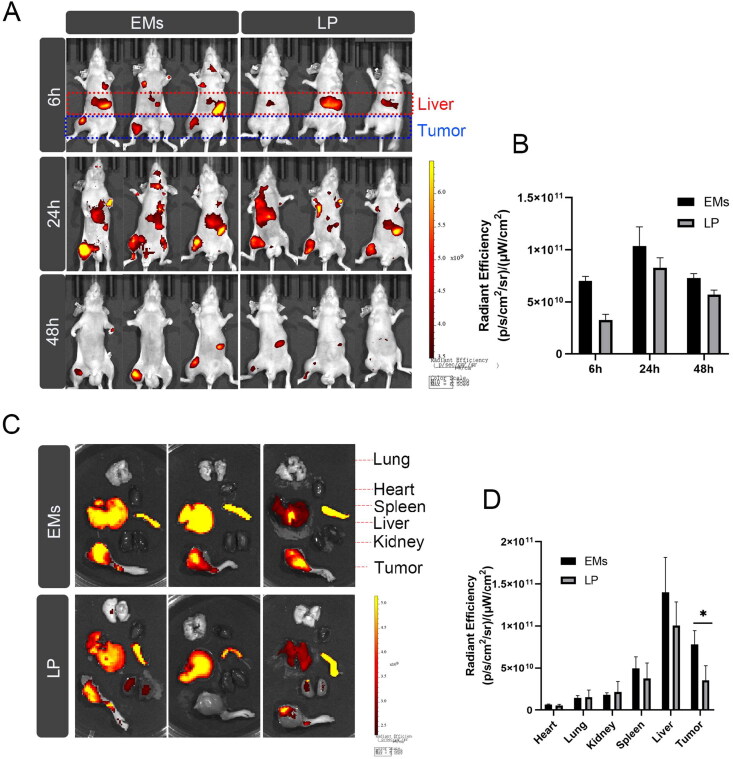
“By harnessing the natural tumor-homing ability of BMSC-derived EMs, they targeted osteosarcoma with EM-Dox to treat in situ xenografts.”
From Emerging role of exosomes in cancer therapy: progress and challenges (2025) · cites this paper as [282]
In the citing paper
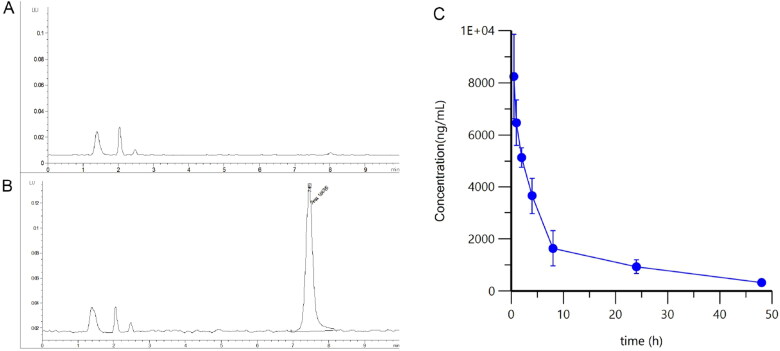
“In vivo studies showed that EM-Dox had a longer circulation time and higher accumulation in tumor tissues compared to other carriers, supporting its enhanced targeting capabilities.”
From Emerging role of exosomes in cancer therapy: progress and challenges (2025) · cites this paper as [282]
In the citing paper
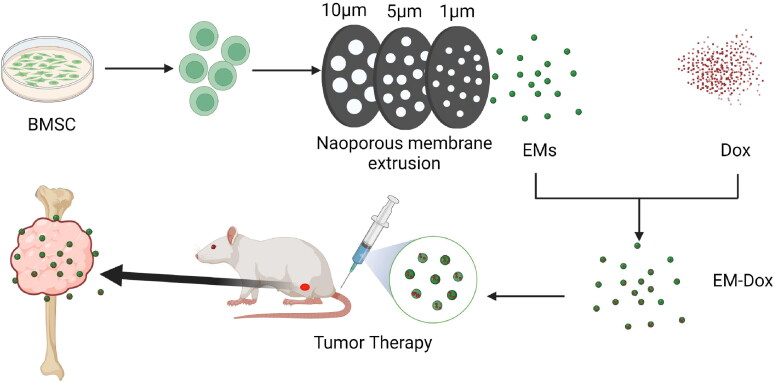
“Using sequential extrusion, they produced EMs and enclosed doxorubicin to create EM-Dox.”
From Emerging role of exosomes in cancer therapy: progress and challenges (2025) · cites this paper as [282]
In the citing paper
“The research focused on the development of EMs derived from BMSCs for delivering doxorubicin in osteosarcoma therapy.”
From Emerging role of exosomes in cancer therapy: progress and challenges (2025) · cites this paper as [282]
In the citing paper
“| Osteosarcoma | EM-Dox | Enhanced drug delivery specificity and minimized off-target toxicity | [282] |”
From Emerging role of exosomes in cancer therapy: progress and challenges (2025) · cites this paper as [282]
In the citing paper
“The findings suggest that EM-Dox could serve as a promising approach to improve osteosarcoma therapy by enhancing drug delivery specificity and minimizing off-target toxicity [282].”
From Emerging role of exosomes in cancer therapy: progress and challenges (2025) · cites this paper as [282]
Self-check
Percentages, sums and reported differences re-computed from the paper’s own numbers.
The self-check needs the paper’s full text.
Citations
Cites
Exosomes facilitate therapeutic targeting of oncogenic KRAS in pancreatic cancer
Kamerkar, S., LeBleu, V. S., Sugimoto, H., Yang, S., Ruivo, C. F., Melo, S. A., Lee, J. J., & Kalluri, R. (2017) · Nature · doi:10.1038/nature22341 · Cited by 2,639
Wei, H., Chen, J., Wang, S., Fu, F., Zhu, X., Wu, C., Liu, Z., Zhong, G., & Lin, J. (2019) · International Journal of Nanomedicine · doi:10.2147/ijn.s218988 · Cited by 317
Research works printed but not linked: 35
- 10.1038/nbt.1807 · DOI · Paper page
- 10.1016/j.ejca.2011.05.030 · DOI · Paper page
- 10.1016/j.jconrel.2012.03.020 · DOI · Paper page
- 10.1002/jev2.12163 · DOI · Paper page
- 10.1016/j.molmed.2018.01.006 · DOI · Paper page
- 10.1007/s40124-015-0075-y · DOI · Paper page
- 10.2147/IJN.S131786 · DOI
- 10.1038/s41598-017-14725-x · DOI
- 10.2147/IJN.S210731 · DOI · Paper page
- 10.1002/adfm.202008326 · DOI
- 10.1002/mrm.25376 · DOI
- 10.1007/978-1-4419-0284-9_12 · DOI
- 10.1021/nn402232g · DOI
- 10.1038/gt.2017.8 · DOI
- 10.1016/j.nano.2015.10.012 · DOI · Paper page
- 10.1002/jcp.30101 · DOI
- 10.7150/thno.18299 · DOI
- 10.1039/D0BM01296C · DOI · Paper page
- 10.1016/j.cclet.2021.11.078 · DOI
- 10.1002/adhm.202000573 · DOI
- 10.1016/j.bbcan.2021.188539 · DOI
- Meyers PA. (2015). Systemic therapy for osteosarcoma and Ewing sarcoma. Am Soc Clin Oncol Educ Book e644-7. PMID: 25993235.
- 10.1002/sctm.17-0055 · DOI
- 10.1080/20013078.2019.1692401 · DOI · Paper page
- 10.1111/jcmm.16290 · DOI
- 10.1038/srep38541 · DOI
- 10.3324/haematol.2020.251454 · DOI
- 10.1038/nrm.2017.125 · DOI · Paper page
- 10.1124/mol.119.115725 · DOI
- 10.1016/j.jconrel.2021.07.004 · DOI
- 10.3389/fonc.2022.805978 · DOI · Paper page
- Zhang XB, Zhang RH, Su X, et al. (2021). Exosomes in osteosarcoma research and preclinical practice. Am J Transl Res 13:882–97. PMID: 33841628; PMCID: PMC8014357.
- 10.1166/jbn.2019.2798 · DOI
- 10.1002/advs.201801899 · DOI
- 10.1038/mt.2011.164 · DOI · Paper page
Cited by
Sorted by citations
Emerging role of exosomes in cancer therapy: progress and challenges
Li, J., Wang, J., & Chen, Z. (2025) · Molecular Cancer · doi:10.1186/s12943-024-02215-4 · Cited by 297
Self-citation
Metadata
- Authors
- Wang, J., Li, M., Jin, L., Guo, P., Zhang, Z., Zhanghuang, C., Tan, X., Mi, T., Liu, J., Wu, X., Wei, G., & He, D.
- Venue
- Drug Delivery
- Publisher
- Informa UK Limited
- Published
- 2022-11-09
- Volume
- 29
- Issue
- 1
- Pages
- 3291-3303
- ISSN
- 1071-7544
- 1521-0464
- PMC
- PMC9662035
- Cited by
- 60
- References
- 2
- Language
- en
- Funders
- Special Key Project of Chongqing Technology Innovation and Application Development (jscx-)
About these checks
Registry, retraction, Cites and statistics results are computed, not judged, with one exception: a printed reference that no index lists is read once by a model before it counts as a citation error. Claims are extracted by a model and kept only when their quote appears verbatim in the text; each cited source is then checked, with a model’s help, for whether it says what the claim relies on. Those verdicts can be wrong — read the claim’s quote and the cited source before relying on one.
Statistics and arithmetic are recomputed, not judged.
Confidence bands are shown only for fields calibrated on our annotated test set. None is calibrated yet, so no band is shown.
What counts as a claim ›How we measure confidence ›How we check this ›
Are you an author, or do you see a problem with this page? Request a review
