

The DOI matches its Crossref record; 53 of the 53 references it cites were found in a registry or an index.
Efficacy of fecal microbiota transplantation in patients with Parkinson’s disease: clinical trial results from a randomized, placebo-controlled design
Open accessAbstract
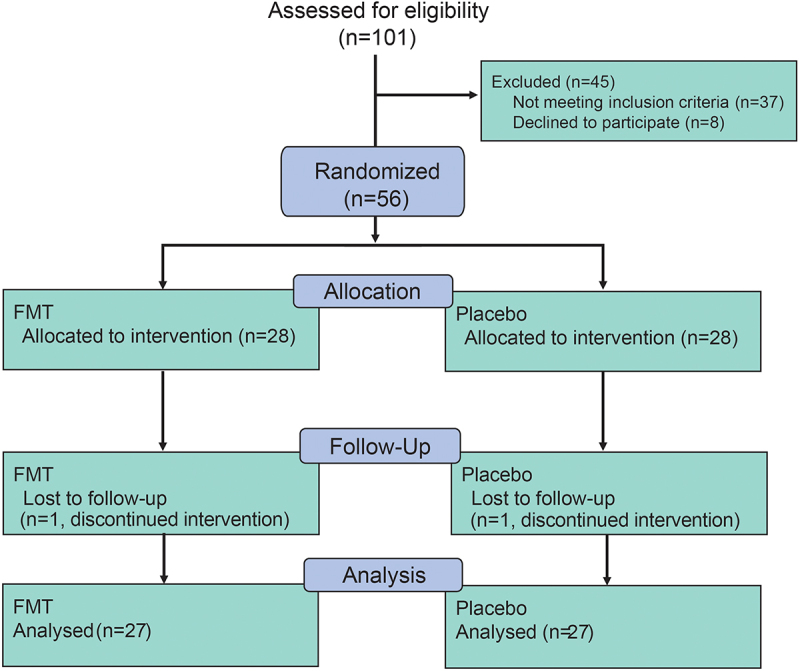
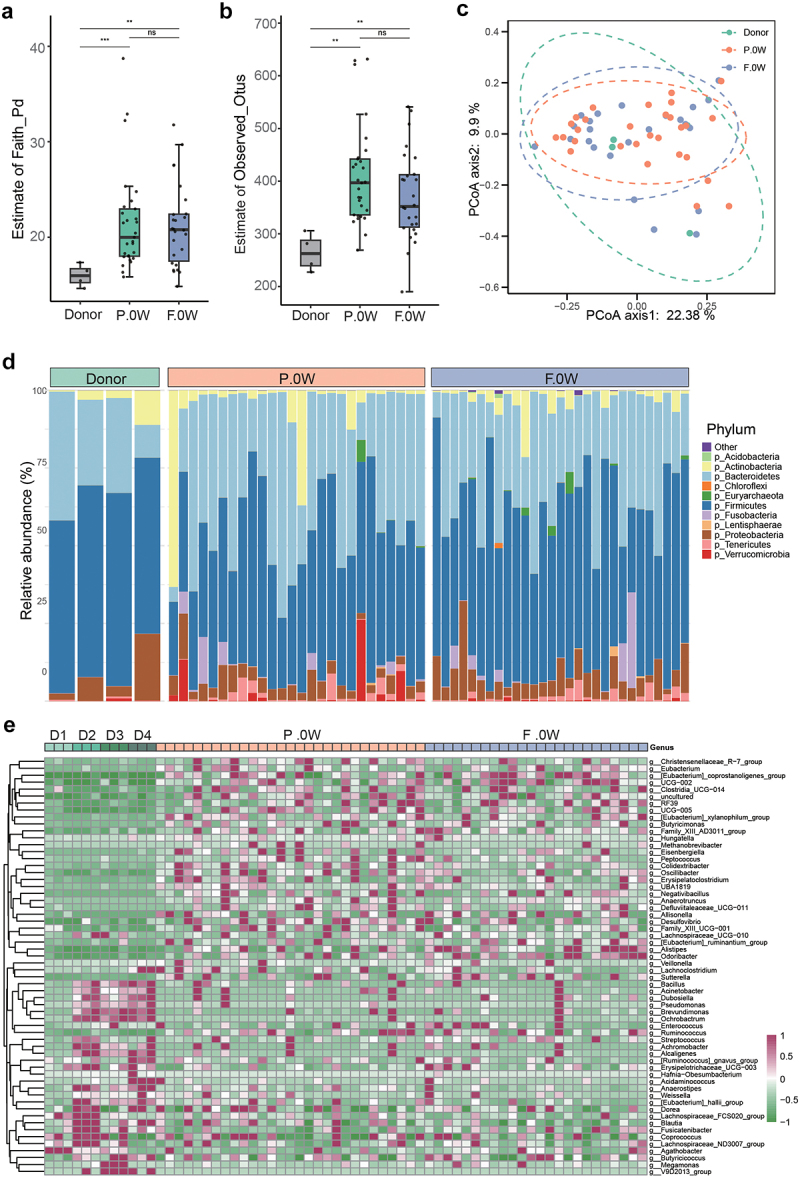
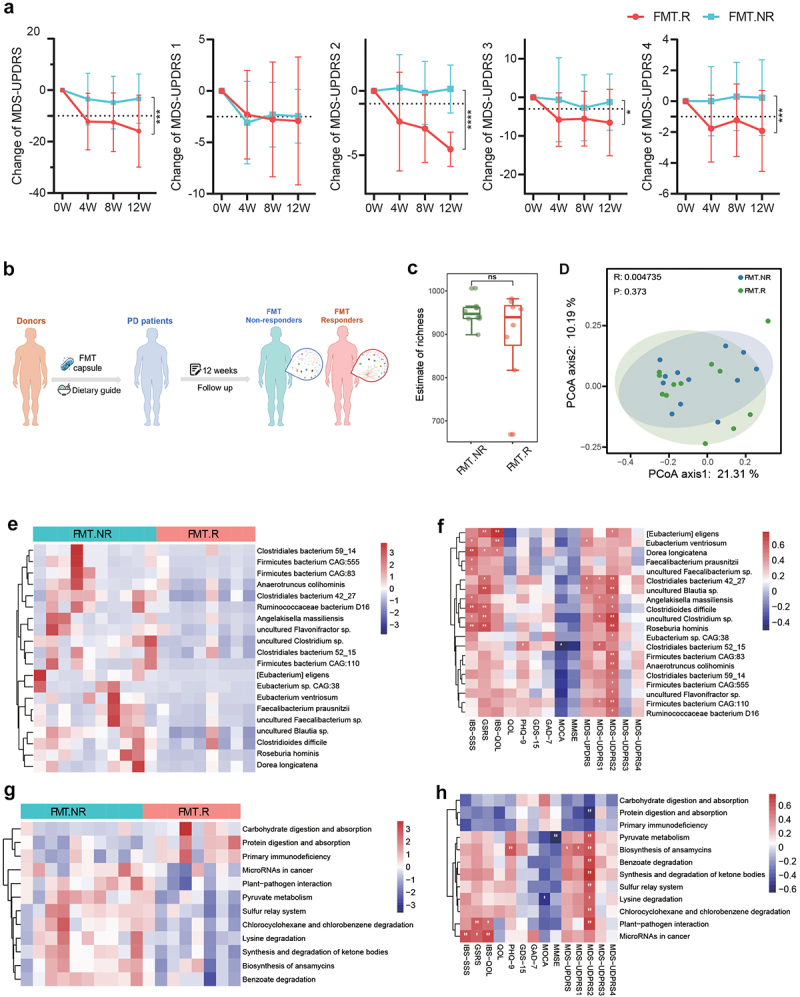
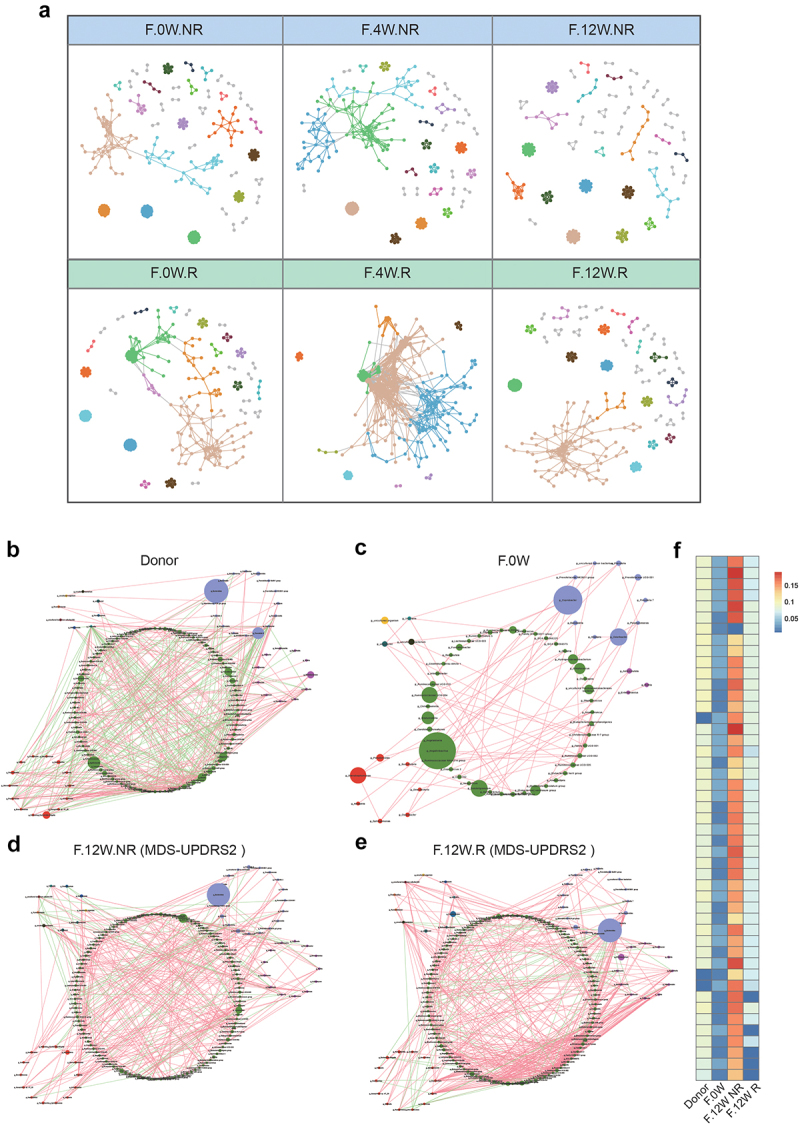
The occurrence and development of Parkinson’s disease (PD) have been demonstrated to be related to gut dysbiosis, however, the impact of fecal microbiota transplantation (FMT) on microbiota engraftment in PD patients is uncertain. We performed a randomized, placebo-controlled trial at the Department of Neurology, Army Medical University Southwest Hospital in China (ChiCTR1900021405) from February 2019 to December 2019. Fifty-six participants with mild to moderate PD (Hoehn-Yahr stage 1–3) were randomly assigned to the FMT and placebo group, 27 patients in the FMT group and 27 in the placebo group completed the whole trial. During the follow-up, no severe adverse effect was observed, and patients with FMT treatment showed significant improvement in PD-related autonomic symptoms compared with the placebo group at the end of this trial (MDS-UPDRS total score, group×time effect, B = -6.56 [−12.98, −0.13], P < 0.05). Additionally, FMT improved gastrointestinal disorders and a marked increase in the complexity of the microecological system in patients. This study demonstrated that FMT through oral administration is clinically feasible and has the potential to improve the effectiveness of current medications in the clinical symptoms of PD patients.
Overview
The claims and statistics of this paper haven’t been checked yet.
Run the check — free, no account needed. It reads the open-access text and checks the sources it cites.
Integrity signals
Registry
Cites
Statistics
Figures
Verification
Claims the paper makes
The claims and statistics of this paper haven’t been checked yet.
Run the check — free, no account needed. It reads the open-access text and checks the sources it cites.
Claims other papers make about this one
Each is checked against this paper’s own text: does it say what the citing paper says it does?
The cited source doesn’t support the claim as written.
In the citing paper
“One study reported no changes in motor function at 6 months post-FMT, although here the treatment group required smaller dose increases than placebo.”
From The gut–brain axis in early Parkinson’s disease: from prodrome to prevention (2025) · cites this paper as [207]
Checked by a reasoning model — may be wrong.
Experimental — accuracy not yet measuredThe source backs part of the claim, not all of it — or backs it for a different population, condition or comparison.
In the citing paper
“In this study, only 3% of the treatment group were reported to show a change from dysbiotic to non-dysbiotic status, compared to 33% in the placebo arm, suggesting that the FMT treatment failed to produce a significant change in the gut microbiome.”
From The gut–brain axis in early Parkinson’s disease: from prodrome to prevention (2025) · cites this paper as [207]
Experimental — accuracy not yet measuredThe cited source says what the claim attributes to it.
In the citing paper
“In these studies, the clinical findings were associated with a shift toward anti-inflammatory microbial species.”
From The gut–brain axis in early Parkinson’s disease: from prodrome to prevention (2025) · cites this paper as [207]
The cited source says what the claim attributes to it.
In the citing paper
“There are currently four RCTs with available evidence for the role of FMT in treating PD [206–209].”
From The gut–brain axis in early Parkinson’s disease: from prodrome to prevention (2025) · cites this paper as [207]
The cited source says what the claim attributes to it.
In the citing paper
“Three of these reported changes in global or motor function, and of these two reported significant improvement UPDRS PD symptom scores at 12 weeks and 12 months, respectively.”
From The gut–brain axis in early Parkinson’s disease: from prodrome to prevention (2025) · cites this paper as [207]
The check wasn’t confident either way, so it gives no verdict — never disputed.
In the citing paper
“In this study, only 3% of the treatment group were reported to show a change from dysbiotic to non-dysbiotic status, compared to 33% in the placebo arm, suggesting that the FMT treatment failed to produce a significant change in the gut microbiome.”
From The gut–brain axis in early Parkinson’s disease: from prodrome to prevention (2025) · cites this paper as [207]
Experimental — accuracy not yet measured
Self-check
Percentages, sums and reported differences re-computed from the paper’s own numbers.
The self-check needs the paper’s full text.
Citations
Cites
1 retracted
Retracted: Gut Microbiome Signatures of Risk and Prodromal Markers of Parkinson Disease
Heinzel, S., Aho, V. T. E., Suenkel, U., von Thaler, A., Schulte, C., Deuschle, C., Paulin, L., Hantunen, S., Brockmann, K., Eschweiler, G. W., et al. (2020) · Annals of Neurology · doi:10.1002/ana.25788 · Cited by 95
RetractedFast gapped-read alignment with Bowtie 2
Langmead, B., & Salzberg, S. L. (2012) · Nature Methods · doi:10.1038/nmeth.1923 · Cited by 56,400
QIIME allows analysis of high-throughput community sequencing data
Caporaso, J. G., Kuczynski, J., Stombaugh, J., Bittinger, K., Bushman, F. D., Costello, E. K., Fierer, N., Peña, A. G., Goodrich, J. K., Gordon, J. I., et al. (2010) · Nature Methods · doi:10.1038/nmeth.f.303 · Cited by 34,887
Reproducible, interactive, scalable and extensible microbiome data science using QIIME 2
Bolyen, E., Rideout, J. R., Dillon, M. R., Bokulich, N. A., Abnet, C. C., Al-Ghalith, G. A., Alexander, H., Alm, E. J., Arumugam, M., Asnicar, F., et al. (2019) · Nature Biotechnology · doi:10.1038/s41587-019-0209-9 · Cited by 23,742
Self-citationFastTree 2 – Approximately Maximum-Likelihood Trees for Large Alignments
Price, M. N., Dehal, P. S., & Arkin, A. P. (2010) · PLoS ONE · doi:10.1371/journal.pone.0009490 · Cited by 14,894
PICRUSt2 for prediction of metagenome functions
Douglas, G. M., Maffei, V. J., Zaneveld, J. R., Yurgel, S. N., Brown, J. R., Taylor, C. M., Huttenhower, C., & Langille, M. G. I. (2020) · Nature Biotechnology · doi:10.1038/s41587-020-0548-6 · Cited by 6,709
Kalia, L. V., & Lang, A. E. (2015) · The Lancet · doi:10.1016/s0140-6736(14)61393-3 · Cited by 6,184
Bloem, B. R., Okun, M. S., & Klein, C. (2021) · The Lancet · doi:10.1016/s0140-6736(21)00218-x · Cited by 3,920
Gut microbiota regulate motor deficits and neuroinflammation in a model of Parkinson's disease
Sampson, T. R., Debelius, J. W., Thron, T., Janssen, S., Shastri, G. G., Ilhan, Z. E., Challis, C., Schretter, C. E., Rocha, S., Gradinaru, V., et al. (2016) · Cell · doi:10.1016/j.cell.2016.11.018 · Cited by 3,622
Diagnosis and Treatment of Parkinson Disease: A Review
Armstrong, M. J., & Okun, M. S. (2020) · JAMA · doi:10.1001/jama.2019.22360 · Cited by 2,924
Beghini, F., McIver, L. J., Blanco-Míguez, A., Dubois, L., Asnicar, F., Maharjan, S., Mailyan, A., Manghi, P., Scholz, M., Thomas, A. M., et al. (2021) · eLife · doi:10.7554/elife.65088 · Cited by 2,303
The prevalence of Parkinson's disease: a systematic review and meta-analysis
Pringsheim, T., Jette, N., Frolkis, A., & Steeves, T. D. L. (2014) · Movement Disorders · doi:10.1002/mds.25945 · Cited by 2,188
The epidemiology of Parkinson's disease: risk factors and prevention
Ascherio, A., & Schwarzschild, M. A. (2016) · The Lancet Neurology · doi:10.1016/s1474-4422(16)30230-7 · Cited by 1,930
Colonic bacterial composition in Parkinson's disease
Keshavarzian, A., Green, S. J., Engen, P. A., Voigt, R. M., Naqib, A., Forsyth, C. B., Mutlu, E., & Shannon, K. M. (2015) · Movement Disorders · doi:10.1002/mds.26307 · Cited by 1,281
Unger, M. M., Spiegel, J., Dillmann, K.-U., Grundmann, D., Philippeit, H., Bürmann, J., Faßbender, K., Schwiertz, A., & Schäfer, K.-H. (2016) · Parkinsonism & Related Disorders · doi:10.1016/j.parkreldis.2016.08.019 · Cited by 1,159
The Role of Microbiota-Gut-Brain Axis in Neuropsychiatric and Neurological Disorders
Socała, K., Doboszewska, U., Szopa, A., Serefko, A., Włodarczyk, M., Zielińska, A., Poleszak, E., Fichna, J., & Wlaź, P. (2021) · Pharmacological Research · doi:10.1016/j.phrs.2021.105840 · Cited by 857
Sun, M.-F., Zhu, Y.-L., Zhou, Z.-L., Jia, X.-B., Xu, Y.-D., Yang, Q., Cui, C., & Shen, Y.-Q. (2018) · Brain, Behavior, and Immunity · doi:10.1016/j.bbi.2018.02.005 · Cited by 736
Romano, S., Savva, G. M., Bedarf, J. R., Charles, I. G., Hildebrand, F., & Narbad, A. (2021) · npj Parkinson's Disease · doi:10.1038/s41531-021-00156-z · Cited by 707
Diet and depression: Exploring the biological mechanisms of action
Marx, W., Lane, M., Hockey, M., Aslam, H., Berk, M., Walder, K., Borsini, A., Firth, J., Pariante, C. M., Berding, K., et al. (2021) · Molecular Psychiatry · doi:10.1038/s41380-020-00925-x · Cited by 685
Liu, P., Wu, L., Peng, G., Han, Y., Tang, R., Ge, J., Zhang, L., Jia, L., Yue, S., Zhou, K., et al. (2019) · Brain, Behavior, and Immunity · doi:10.1016/j.bbi.2019.05.008 · Cited by 669
Pathogenesis of Parkinson disease—the gut–brain axis and environmental factors
Klingelhoefer, L., & Reichmann, H. (2015) · Nature Reviews Neurology · doi:10.1038/nrneurol.2015.197 · Cited by 598
A Comprehensive Review on the Role of the Gut Microbiome in Human Neurological Disorders
Sorboni, S. G., Moghaddam, H. S., Esfehani, R. J., & Soleimanpour, S. (2022) · Clinical Microbiology Reviews · doi:10.1128/cmr.00338-20 · Cited by 586
Dysbiosis of gut microbiota and microbial metabolites in Parkinson's disease
Sun, M.-F., & Shen, Y.-Q. (2018) · Ageing Research Reviews · doi:10.1016/j.arr.2018.04.004 · Cited by 445
Fecal Microbiota Transplantation in Neurological Disorders
Vendrik, K. E. W., Ooijevaar, R. E., de Jong, P. R. C., Laman, J. D., van Oosten, B. W., van Hilten, J. J., Ducarmon, Q. R., Keller, J. J., Kuijper, E. J., & Contarino, M. F. (2020) · Frontiers in Cellular and Infection Microbiology · doi:10.3389/fcimb.2020.00098 · Cited by 413
Dan, Z., Mao, X., Liu, Q., Guo, M., Zhuang, Y., Liu, Z., Chen, K., Chen, J., Xu, R., Tang, J., et al. (2020) · Gut Microbes · doi:10.1080/19490976.2020.1747329 · Cited by 350
Self-citationGut microbiota in neurodegenerative disorders
Sarkar, S. R., & Banerjee, S. (2019) · Journal of Neuroimmunology · doi:10.1016/j.jneuroim.2019.01.004 · Cited by 325
The role of gut dysbiosis in Parkinson’s disease: mechanistic insights and therapeutic options
Wang, Q., Luo, Y., Ray Chaudhuri, K., Reynolds, R., Tan, E.-K., & Pettersson, S. (2021) · Brain · doi:10.1093/brain/awab156 · Cited by 281 · cited 2×
“During this trial, we observed a significant increase in MOCA score in the placebo participants at weeks 4, 8, and 12; moreover, FMT participants demonstrated a more significant increase in MOCA score at week 12.”
BackgroundParkinson’s disease from the gut
Liddle, R. A. (2018) · Brain Research · doi:10.1016/j.brainres.2018.01.010 · Cited by 228
The Association Between the Gut Microbiota and Parkinson’s Disease, a Meta-Analysis
Shen, T., Yue, Y., He, T., Huang, C., Qu, B., Lv, W., & Lai, H.-Y. (2021) · Frontiers in Aging Neuroscience · doi:10.3389/fnagi.2021.636545 · Cited by 219 · cited 1×
“15 Several risks (physical activity, constipation, subthreshold parkinsonism, and physical activity) and prodromal markers are also associated with alterations in gut microbiota composition.”
BackgroundOral and nasal microbiota in Parkinson's disease
Pereira, P. A. B., Aho, V. T. E., Paulin, L. G., Pekkonen, E., Auvinen, P., & Scheperjans, F. (2017) · Parkinsonism & Related Disorders · doi:10.1016/j.parkreldis.2017.02.026 · Cited by 210
Li, N., Chen, H., Cheng, Y., Xu, F., Ruan, G., Ying, S., Tang, W., Chen, L., Chen, M., Lv, L., et al. (2021) · Frontiers in Cellular and Infection Microbiology · doi:10.3389/fcimb.2021.759435 · Cited by 206
Self-citationAltered Gut Microbiota in Chinese Children With Autism Spectrum Disorders
Ma, B., Liang, J., Dai, M., Wang, J., Luo, J., Zhang, Z., & Jing, J. (2019) · Frontiers in Cellular and Infection Microbiology · doi:10.3389/fcimb.2019.00040 · Cited by 202
Holvoet, T., Joossens, M., Vázquez-Castellanos, J. F., Christiaens, E., Heyerick, L., Boelens, J., Verhasselt, B., van Vlierberghe, H., De Vos, M., Raes, J., et al. (2021) · Gastroenterology · doi:10.1053/j.gastro.2020.07.013 · Cited by 201 · cited 2×
“…analysis reveals that some butyrate-produced bacteria from the phylum Firmicutes, such as Eubacterium eligens , Eubacterium ventrio-sum , Clostridiales bacterium 42_27 , uncultured Blautia sp ., Clostridioides difficile , uncultured Clostridium sp ., and Roseburia hominis are enriched in FMT.”
BackgroundFecal microbiota transplantation therapy for Parkinson's disease: A preliminary study
Xue, L.-J., Yang, X.-Z., Tong, Q., Shen, P., Ma, S.-J., Wu, S.-N., Zheng, J.-L., & Wang, H.-G. (2020) · Medicine · doi:10.1097/md.0000000000022035 · Cited by 186
Gut Microbiota Condition the Therapeutic Efficacy of Trastuzumab in HER2-Positive Breast Cancer
Di Modica, M., Gargari, G., Regondi, V., Bonizzi, A., Arioli, S., Belmonte, B., De Cecco, L., Fasano, E., Bianchi, F., Bertolotti, A., et al. (2021) · Cancer Research · doi:10.1158/0008-5472.can-20-1659 · Cited by 184
Evaluation of fecal microbiota transplantation in Parkinson's disease patients with constipation
Kuai, X.-Y., Yao, X.-H., Xu, L.-J., Zhou, Y.-Q., Zhang, L.-P., Liu, Y., Pei, S.-F., & Zhou, C.-L. (2021) · Microbial Cell Factories · doi:10.1186/s12934-021-01589-0 · Cited by 179
DuPont, H. L., Suescun, J., Jiang, Z.-D., Brown, E. L., Essigmann, H. T., Alexander, A. S., DuPont, A. W., Iqbal, T., Utay, N. S., Newmark, M., et al. (2023) · Frontiers in Neurology · doi:10.3389/fneur.2023.1104759 · Cited by 162
Parkinson’s Disease and Gut Microbiota
Hirayama, M., & Ohno, K. (2021) · Annals of Nutrition and Metabolism · doi:10.1159/000518147 · Cited by 158
Probiotics for Parkinson’s Disease
Gazerani, P. (2019) · International Journal of Molecular Sciences · doi:10.3390/ijms20174121 · Cited by 156
Aroniadis, O. C., Brandt, L. J., Oneto, C., Feuerstadt, P., Sherman, A., Wolkoff, A. W., Kassam, Z., Sadovsky, R. G., Elliott, R. J., Budree, S., et al. (2019) · The Lancet. Gastroenterology & hepatology · doi:10.1016/s2468-1253(19)30198-0 · Cited by 153
Tian, H., Ge, X., Nie, Y., Yang, L., Ding, C., McFarland, L. V., Zhang, X., Chen, Q., Gong, J., & Li, N. (2017) · PLoS ONE · doi:10.1371/journal.pone.0171308 · Cited by 131
Study of gut microbiota alterations in Alzheimer's dementia patients from Kazakhstan
Kaiyrlykyzy, A., Kozhakhmetov, S., Babenko, D., Zholdasbekova, G., Alzhanova, D., Olzhayev, F., Baibulatova, A., Kushugulova, A. R., & Askarova, S. (2022) · Scientific Reports · doi:10.1038/s41598-022-19393-0 · Cited by 125
Fecal microbiota transplant as a potential treatment for Parkinson's disease – A case series
Segal, A., Zlotnik, Y., Moyal-Atias, K., Abuhasira, R., & Ifergane, G. (2021) · Clinical Neurology and Neurosurgery · doi:10.1016/j.clineuro.2021.106791 · Cited by 124
Horváth, K., Aschermann, Z., Kovács, M. Á., Makkos, A., Harmat, M., Janszky, J., Komoly, S., Karádi, K., & Kovács, N. (2017) · Movement Disorders · doi:10.1002/mds.26960 · Cited by 111
Association of the gut microbiota with cognitive function in midlife
Meyer, K., Lulla, A., Debroy, K., Shikany, J. M., Yaffe, K., Meirelles, O., & Launer, L. J. (2022) · JAMA Network Open · doi:10.1001/jamanetworkopen.2021.43941 · Cited by 110
Potential Role of Gut Microbiota in ALS Pathogenesis and Possible Novel Therapeutic Strategies
Mazzini, L., Mogna, L., Marchi, F. D., Amoruso, A., Pane, M., Aloisio, I., Cionci, N. B., Gaggìa, F., Lucenti, A., Bersano, E., et al. (2018) · Journal of Clinical Gastroenterology · doi:10.1097/mcg.0000000000001042 · Cited by 103
Gut Microbiome Signatures of Risk and Prodromal Markers of Parkinson Disease
Heinzel, S., Aho, V. T. E., Suenkel, U., von Thaler, A., Schulte, C., Deuschle, C., Paulin, L. G., Hantunen, S., Brockmann, K., Eschweiler, G. W., et al. (2021) · Annals of Neurology · doi:10.1002/ana.26128 · Cited by 72
Parkinson’s Disease and the Gut: Symptoms, Nutrition, and Microbiota
Yemula, N., Dietrich, C. M., Dostal, V., & Hornberger, M. (2021) · Journal of Parkinson s Disease · doi:10.3233/jpd-212707 · Cited by 71
Miller, K. M., Mercado, N. M., & Sortwell, C. E. (2021) · npj Parkinson s Disease · doi:10.1038/s41531-021-00179-6 · Cited by 54
Altered gut microbiome and metabolome in patients with multiple system atrophy
Tan, A. H., Chong, C. W., Song, S., Teh, C. S. J., Yap, I. K. S., Loke, M. F., Tan, Y. Q., Yong, H.-S., Mahadeva, S., Lang, A. E., et al. (2017) · Movement Disorders · doi:10.1002/mds.27203 · Cited by 52
Xu, F., Li, N., Wang, C., Xing, H., Chen, D., & Wei, Y. (2021) · BMC Gastroenterology · doi:10.1186/s12876-021-01630-x · Cited by 48
Self-citationKuan, W., Stott, K. M., He, X., Wood, T., Yang, S., Kwok, J. C. F., Hall, K., Zhao, Y., Tietz, O., Aigbirhio, F. I., et al. (2019) · Molecular Psychiatry · doi:10.1038/s41380-019-0608-9 · Cited by 36
Nousias, O., & Montesanto, F. (2021) · Marine Genomics · doi:10.1016/j.margen.2021.100866 · Cited by 25
Cited by
Sorted by citations
Gut Microbiota Dysbiosis: Pathogenesis, Diseases, Prevention, and Therapy
Shen, Y., Fan, N., Ma, S., Cheng, X., Yang, X., & Wang, G. (2025) · MedComm · doi:10.1002/mco2.70168 · Cited by 404
Lu, S., Zhao, Q., Yu, G., Sun, Z., Li, W., Guo, S., & Zhang, A. (2024) · Biomedicine & Pharmacotherapy · doi:10.1016/j.biopha.2024.117207 · Cited by 191
Fecal Microbiota Transplantation for Treatment of Parkinson Disease: A Randomized Clinical Trial
Scheperjans, F., Levo, R., Bosch, B., Lääperi, M., Pereira, P. A. B., Smolander, O.-P., Aho, V. T. E., Vetkas, N., Toivio, L., Kainulainen, V., et al. (2024) · JAMA Neurology · doi:10.1001/jamaneurol.2024.2305 · Cited by 128
Gut-first Parkinson’s disease is encoded by gut dysbiome
Muñoz, M., Candeias, E., Melo-Marques, I., Esteves, A. R., Maranha, A., Magalhães, J. D., Carneiro, D. R., Sant’Anna, M., Pereira-Santos, A. R., Abreu, A. E., et al. (2024) · Molecular Neurodegeneration · doi:10.1186/s13024-024-00766-0 · Cited by 89
Therapeutics for neurodegenerative diseases by targeting the gut microbiome: from bench to bedside
Ma, Y., Li, X., Yu, J., & Wang, Y. (2024) · Translational Neurodegeneration · doi:10.1186/s40035-024-00404-1 · Cited by 96
Metadata
- Authors
- Cheng, Y., Tan, G., Zhu, Q., Wang, C., Ruan, G., Ying, S., Qie, J., Hu, X., Xiao, Z., Xu, F., Chen, L., Chen, M., Pei, Y., Zhang, H., Tian, Y., Chen, D., Liu, X., Huang, H., & Wei, Y.
- Affiliations
- Army Medical University (CN)
- Suzhou Municipal Hospital (CN)
- Department of Pathogen Biology-Microbiology Division, Key Laboratory of Pathogen of Jiangsu Province; The Affiliated Suzhou Hospital of Nanjing Medical University, Suzhou Municipal Hospital Gusu School, Nanjing Medical University, Jiangsu, China
- Corresponding author
- Liu, Xingyin
- Huang, Heqing
- Wei, Yanling
- ORCID
- Venue
- Gut Microbes
- Publisher
- Informa UK Limited
- Published
- 2023-12-06
- Volume
- 15
- Issue
- 2
- Pages
- 2284247-2284247
- ISSN
- 1949-0976 (ISSN-L)
- 1949-0984
- PMC
- PMC10841011
- OpenAlex
- W4389451466
- Cited by
- 147
- References
- 53
- Citations by year
- 2026: 42 · 2025: 73 · 2024: 32
- FWCI
- 25.01
- Type
- journal article
- Language
- en
- Open access
- gold
- doi.org
- Licence
- Locations
- Gut Microbes (publishedVersion, cc-by)
- PubMed Central (publishedVersion, cc-by)
- PubMed (publishedVersion)
- DOAJ (DOAJ: Directory of Open Access Journals) (submittedVersion, cc-by-sa)
- Funders
- the National Natural Science Foundation of China (82172288)
- the Special Project for Enhancement of Science and Technology Innovation Capability of Army Medical University (2019XLC3040)
- Topics
- Health Sciences › Medicine › Clinical Neurology › Parkinson's Disease Mechanisms and Treatments
- Life Sciences › Biochemistry, Genetics and Molecular Biology › Molecular Biology › Gut microbiota and health
- Health Sciences › Medicine › Gastroenterology › Gastrointestinal motility and disorders
- Keywords
- fecal microbiota transplantation, Parkinson's disease, gut dysbiosis, autonomic symptoms, gastrointestinal diseases, MDS-UPDRS, oral administration, treatment feasibility
- MeSH terms
- Gastrointestinal Microbiome, Fecal Microbiota Transplantation, China, Feces, Humans, Parkinson Disease, Treatment Outcome, Dysbiosis
About these checks
Registry, retraction, Cites and statistics results are computed, not judged, with one exception: a printed reference that no index lists is read once by a model before it counts as a citation error. Claims are extracted by a model and kept only when their quote appears verbatim in the text; each cited source is then checked, with a model’s help, for whether it says what the claim relies on. Those verdicts can be wrong — read the claim’s quote and the cited source before relying on one.
Statistics and arithmetic are recomputed, not judged.
Confidence bands are shown only for fields calibrated on our annotated test set. None is calibrated yet, so no band is shown.
What counts as a claim ›How we measure confidence ›How we check this ›
Are you an author, or do you see a problem with this page? Request a review
