

The DOI matches its Crossref record; 38 of the 38 references it cites were found in a registry or an index.
Chronic Tumor Necrosis Factor Alters T Cell Responses by Attenuating T Cell Receptor Signaling
Open accessAbstract
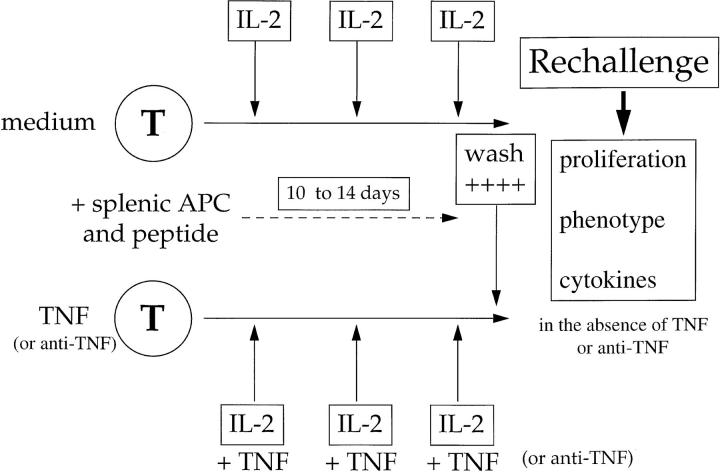
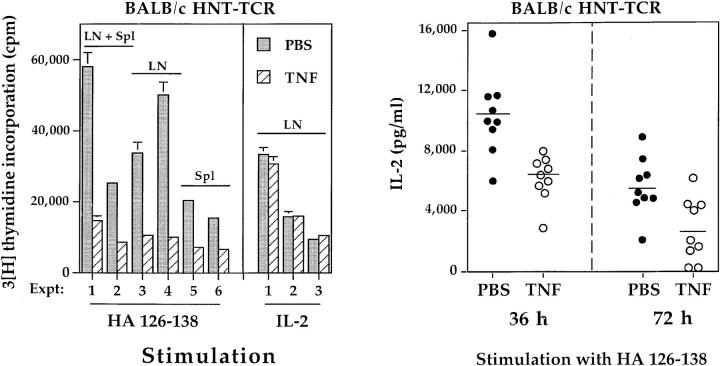
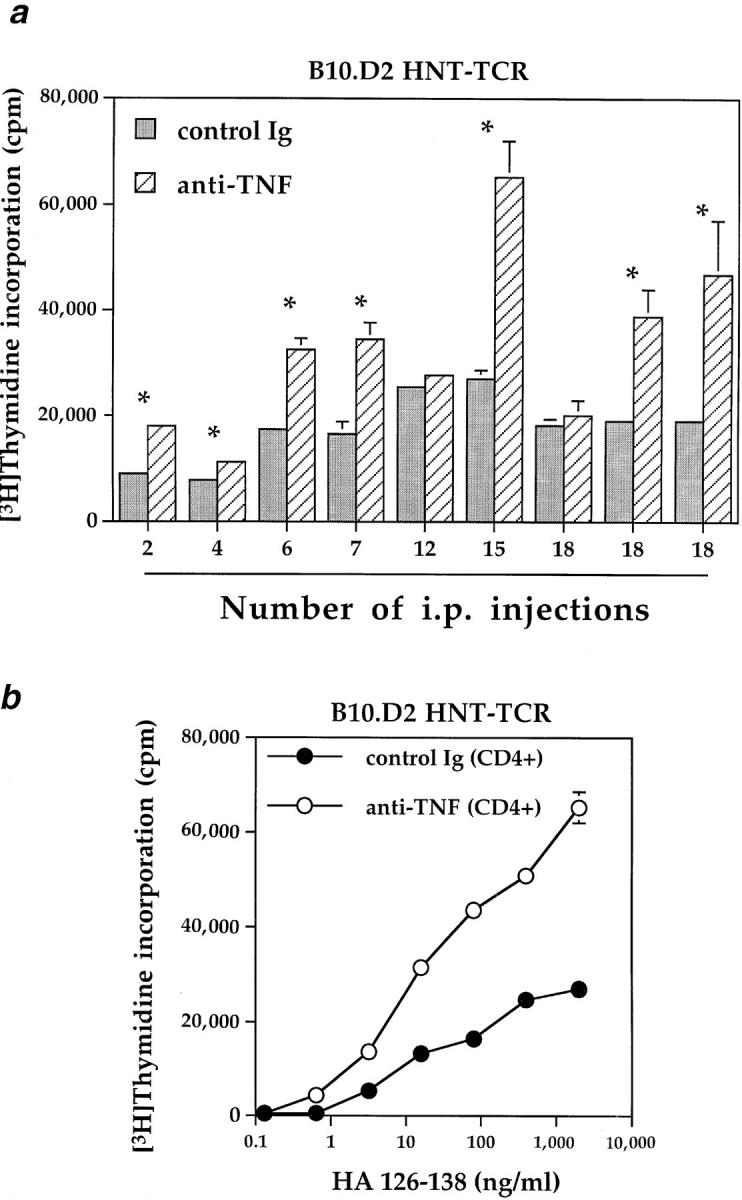
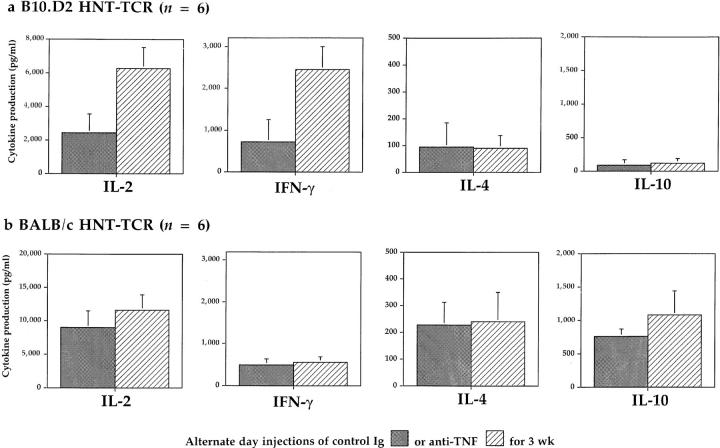
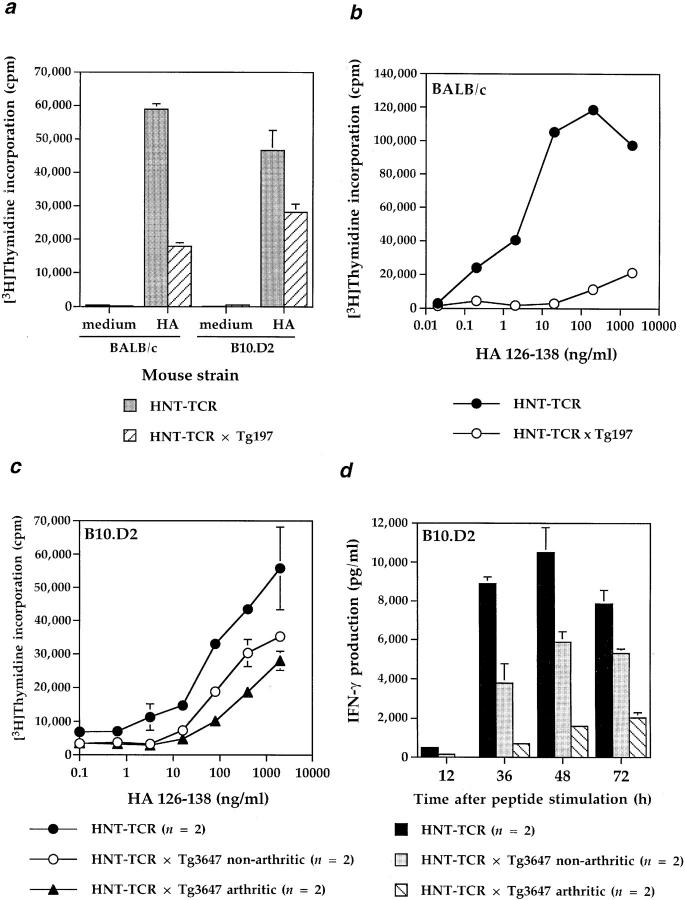
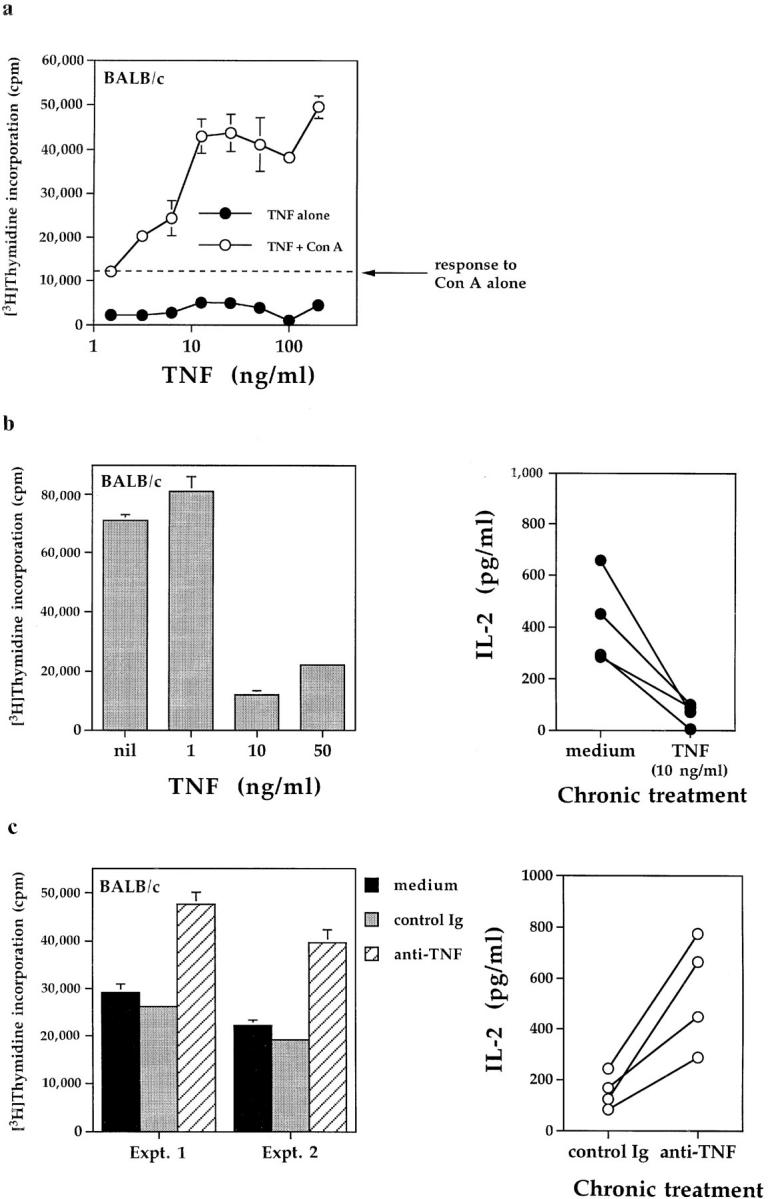
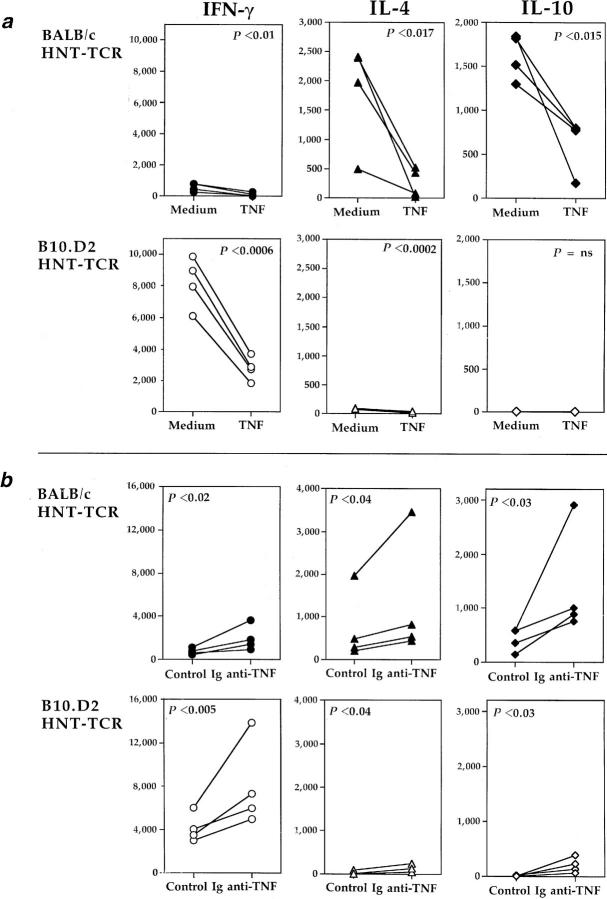
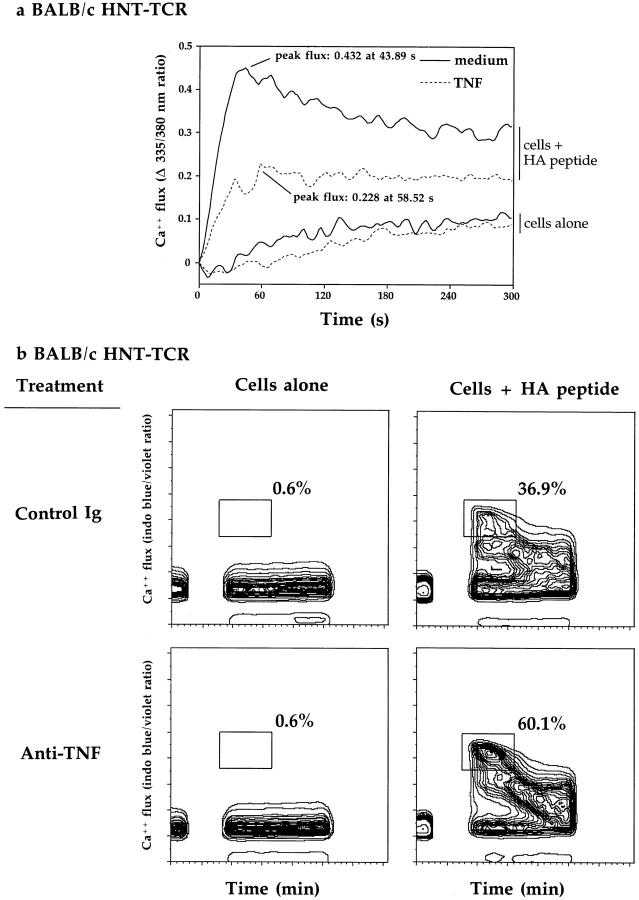
Repeated injections of adult mice with recombinant murine TNF prolong the survival of NZB/W F1 mice, and suppress type I insulin-dependent diabetes mellitus (IDDM) in nonobese diabetic (NOD) mice. To determine whether repeated TNF injections suppress T cell function in adult mice, we studied the responses of influenza hemagglutinin-specific T cells derived from T cell receptor (HNT-TCR) transgenic mice. Treatment of adult mice with murine TNF for 3 wk suppressed a broad range of T cell responses, including proliferation and cytokine production. Furthermore, T cell responses of HNT-TCR transgenic mice also expressing the human TNF-globin transgene were markedly reduced compared to HNT-TCR single transgenic littermates, indicating that sustained p55 TNF-R signaling is sufficient to suppress T cell function in vivo. Using a model of chronic TNF exposure in vitro, we demonstrate that (a) chronic TNF effects are dose and time dependent, (b) TNF suppresses the responses of both Th1 and Th2 T helper subsets, (c) the suppressive effects of endogenous TNF produced in T cell cultures could be reversed with neutralizing monoclonal antibodies to TNF, and (d) prolonged TNF exposure attenuates T cell receptor signaling. The finding that anti-TNF treatment in vivo enhances T cell proliferative responses and cytokine production provides evidence for a novel regulatory effect of TNF on T cells in healthy laboratory mice. These effects are more pronounced in chronic inflammatory disease. In addition, our data provide a mechanism through which prolonged TNF exposure suppresses disease in animal models of autoimmunity.
Overview
The claims and statistics of this paper haven’t been checked yet.
Run the check — free, no account needed. It reads the open-access text and checks the sources it cites.
Integrity signals
Registry
Cites
Statistics
Figures
Verification
Claims the paper makes
The claims and statistics of this paper haven’t been checked yet.
Run the check — free, no account needed. It reads the open-access text and checks the sources it cites.
Claims other papers make about this one
Each is checked against this paper’s own text: does it say what the citing paper says it does?
The source backs part of the claim, not all of it — or backs it for a different population, condition or comparison.
In the citing paper
“Since inflammatory cytokines that direct T cell subtype production are altered in depressed patients (12–14)”
From Inflammatory T helper 17 cells promote depression-like behavior in mice (2013) · cites this paper as [12]
Experimental — accuracy not yet measured
Self-check
Percentages, sums and reported differences re-computed from the paper’s own numbers.
The self-check needs the paper’s full text.
Citations
Cites
Sallusto, F., & Lanzavecchia, A. (1994) · The Journal of Experimental Medicine · doi:10.1084/jem.179.4.1109 · Cited by 5,129
de Waal Malefyt, R., Abrams, J., Bennett, B., Figdor, C. G., & de Vries, J. E. (1991) · The Journal of experimental medicine · doi:10.1084/jem.174.5.1209 · Cited by 3,762
Hotamisligil, G. S., Peraldi, P., Budavari, A., Ellis, R., White, M. F., & Spiegelman, B. M. (1996) · Science · doi:10.1126/science.271.5249.665 · Cited by 2,630
ROLE OF CYTOKINES IN RHEUMATOID ARTHRITIS
Feldmann, M., Brennan, F. M., & Maini, R. N. (1996) · Annual Review of Immunology · doi:10.1146/annurev.immunol.14.1.397 · Cited by 2,507
The Pathophysiology of Tumor Necrosis Factors
VASSALLI, P. (1992) · Annual Review of Immunology · doi:10.1146/annurev.iy.10.040192.002211 · Cited by 1,874
Elliott, M. J., Maini, R. N., Feldmann, M., Kalden, J. R., Antoni, C., Smolen, J. S., Leeb, B., Breedveld, F. C., Macfarlane, J. D., Bijl, J. A., et al. (1994) · The Lancet · doi:10.1016/s0140-6736(94)90628-9 · Cited by 1,682
Transgenic mice expressing human tumour necrosis factor: a predictive genetic model of arthritis.
Keffer, J., Probert, L., Cazlaris, H. E., Georgopoulos, S., Kaslaris, E., Kioussis, D., & Kollias, G. A. (1991) · The EMBO Journal · doi:10.1002/j.1460-2075.1991.tb04978.x · Cited by 1,670
Self-citationTumor necrosis factor mediates myelin and oligodendrocyte damage in vitro
Selmaj, K., & Raine, C. S. (1988) · Annals of Neurology · doi:10.1002/ana.410230405 · Cited by 1,417
Treatment of Crohn's disease with anti-tumor necrosis factor chimeric monoclonal antibody (cA2)
van Dullemen, H. M., van Deventer, S. J. H., Hommes, D. W., Bijl, H. A., Jansen, J., Tytgat, G. N. J., & Woody, J. N. (1995) · Gastroenterology · doi:10.1016/0016-5085(95)90277-5 · Cited by 1,082
Anti-tumor necrosis factor ameliorates joint disease in murine collagen-induced arthritis.
Williams, R. O., Feldmann, M., & Maini, R. N. (1992) · Proceedings of the National Academy of Sciences · doi:10.1073/pnas.89.20.9784 · Cited by 991
Cited by
Sorted by citations
Immune system to brain signaling: Neuropsychopharmacological implications
Capuron, L., & Miller, A. H. (2011) · Pharmacology & Therapeutics · doi:10.1016/j.pharmthera.2011.01.014 · Cited by 1,195
Raison, C. L., & Miller, A. H. (2003) · American Journal of Psychiatry · doi:10.1176/appi.ajp.160.9.1554 · Cited by 1,197
Davidson, A., & Diamond, B. (2001) · New England Journal of Medicine · doi:10.1056/nejm200108023450506 · Cited by 1,069
Resolution of inflammation: a new therapeutic frontier
Fullerton, J. N., & Gilroy, D. W. (2016) · Nature Reviews Drug Discovery · doi:10.1038/nrd.2016.39 · Cited by 937
New IL-12-family members: IL-23 and IL-27, cytokines with divergent functions
Hunter, C. A. (2005) · Nature reviews. Immunology · doi:10.1038/nri1648 · Cited by 857
Chen, X., Bäumel, M., Männel, D. N., Howard, O. M. Z., & Oppenheim, J. J. (2007) · The Journal of Immunology · doi:10.4049/jimmunol.179.1.154 · Cited by 561
Benham, H., Nel, H. J., Law, S. C., Mehdi, A. M., Street, S. E. A., Ramnoruth, N., Pahau, H., Lee, B. T., Ng, J., Brunck, M. E. G., et al. (2015) · Science Translational Medicine · doi:10.1126/scitranslmed.aaa9301 · Cited by 380
T cells and aging january 2002 update
Pawelec, G. (2002) · Frontiers in bioscience · doi:10.2741/a831 · Cited by 372
Pawelec, G. (1998) · Frontiers in bioscience · doi:10.2741/a266 · Cited by 357
Depression and immunity: A role for T cells?
Miller, A. H. (2009) · Brain Behavior and Immunity · doi:10.1016/j.bbi.2009.09.009 · Cited by 345
Akassoglou, K., Bauer, J., Kassiotis, G., Pasparakis, M., Lassmann, H., Kollias, G. A., & Probert, L. (1998) · American Journal Of Pathology · doi:10.1016/s0002-9440(10)65622-2 · Cited by 316
Self-citationReparon‐Schuijt, C. C., van Esch, W. J. E., van Kooten, C., Ezendam, N. P. M., Levarht, E. W. N., Breedveld, F. C., & Verweij, C. L. (2001) · Arthritis & Rheumatism · doi:10.1002/1529-0131(200109)44:9 · Cited by 34
Down-Regulation of CD28 Expression by TNF-α
Bryl, E., Vallejo, A. N., Weyand, C. M., & Goronzy, J. J. (2001) · The Journal of Immunology · doi:10.4049/jimmunol.167.6.3231 · Cited by 264
Kollias, G. A., Douni, E. K., Kassiotis, G., & Kontoyiannis, D. L. (1999) · Immunological Reviews · doi:10.1111/j.1600-065x.1999.tb01315.x · Cited by 263
Self-citationThe evolutionary significance of depression in Pathogen Host Defense (PATHOS-D)
Raison, C. L., & Miller, A. H. (2013) · Molecular Psychiatry · doi:10.1038/mp.2012.2 · Cited by 253
Inflammatory T helper 17 cells promote depression-like behavior in mice
Beurel, E., Harrington, L. E., & Jope, R. S. (2013) · Biological Psychiatry · doi:10.1016/j.biopsych.2012.09.021 · Cited by 254
Tumor necrosis factor-α regulation of CD4 + C25 + T cell levels in NOD mice
Wu, A. J., Hua, H., Munson, S. H., & McDevitt, H. O. (2002) · Proceedings of the National Academy of Sciences · doi:10.1073/pnas.172382999 · Cited by 250
Self-citationTumor necrosis factor‐α antagonists and neuropathy
Stübgen, J. (2007) · Muscle & Nerve · doi:10.1002/mus.20924 · Cited by 235
Multiple Sclerosis: Deeper Understanding of Its Pathogenesis Reveals New Targets for Therapy
Steinman, L., Martinꝉ, R., Bernard, C. C. A., Conlon, P. J., & Oksenberg, J. R. (2002) · Annual Review of Neuroscience · doi:10.1146/annurev.neuro.25.112701.142913 · Cited by 230
Is resolution the end of inflammation?
Feehan, K. T., & Gilroy, D. W. (2019) · Trends in Molecular Medicine · doi:10.1016/j.molmed.2019.01.006 · Cited by 229
Cytokines as Biomarkers in Rheumatoid Arthritis
Burska, A. N., Boissinot, M., & Ponchel, F. (2014) · Mediators of Inflammation · doi:10.1155/2014/545493 · Cited by 231
Biologic therapies in rheumatology: lessons learned, future directions
Strand, V., Kimberly, R. P., & Isaacs, J. D. (2006) · Nature Reviews Drug Discovery · doi:10.1038/nrd2196 · Cited by 223
Regulation of interleukin-12 production in antigen-presenting cells
Mal, X., & Trinchieri, G. (2001) · Advances in immunology · doi:10.1016/s0065-2776(01)79002-5 · Cited by 213
IL-10 Is Critical for Host Resistance and Survival During Gastrointestinal Helminth Infection
Schopf, L. R., Hoffmann, K. F., Cheever, A. W., Urban, J. F., & Wynn, T. A. (2002) · The Journal of Immunology · doi:10.4049/jimmunol.168.5.2383 · Cited by 211
Satisfaction (not) guaranteed: re-evaluating the use of animal models of type 1 diabetes
Roep, B. O., Atkinson, M. A., & von Herrath, M. (2004) · Nature reviews. Immunology · doi:10.1038/nri1502 · Cited by 215
Kollias, G. A., Douni, E. K., Kassiotis, G., & Kontoyiannis, D. L. (1999) · Annals of the Rheumatic Diseases · doi:10.1136/ard.58.2008.i32 · Cited by 210
Self-citationTumor Necrosis Factor (TNF)-alpha and TNF Receptors in Viral Pathogenesis
Herbein, G., & O’Brien, W. A. (2000) · Proceedings of The Society for Experimental Biology and Medicine · doi:10.1046/j.1525-1373.2000.22335.x · Cited by 205
Zganiacz, A., Santosuosso, M., Wang, J., Yang, T., Chen, L., Anzulovic, M., Alexander, S., Gicquel, B., Wan, Y., Bramson, J. L., et al. (2004) · Journal of Clinical Investigation · doi:10.1172/jci18991 · Cited by 205
The role of tumour necrosis factor (TNF-α) in experimental autoimmune uveoretinitis (EAU)
Dick, A. D., Forrester, J. V., Liversidge, J., & Cope, A. P. (2004) · Progress in Retinal and Eye Research · doi:10.1016/j.preteyeres.2004.06.005 · Cited by 197
Self-citationGreen, E. A., Eynon, E. E., & Flavell, R. A. (1998) · Immunity · doi:10.1016/s1074-7613(00)80670-6 · Cited by 197
Guillain‐Barré and Miller Fisher syndromes occurring with tumor necrosis factor α antagonist therapy
Shin, I. J., Baer, A. N., Kwon, H., Papadopoulos, E. J., & Siegel, J. N. (2006) · Arthritis & Rheumatism · doi:10.1002/art.21814 · Cited by 195
HSP70 Protects against TNF-Induced Lethal Inflammatory Shock
Molle, W. V., Wielockx, B., Mahieu, T., Takada, M., Taniguchi, T., Sekikawa, K., & Libert, C. (2002) · Immunity · doi:10.1016/s1074-7613(02)00310-2 · Cited by 191
Probert, L. (2000) · Brain · doi:10.1093/brain/123.10.2005 · Cited by 190
Self-citationInhibition of IL-1, IL-6, and TNF-α in immune-mediated inflammatory diseases
Möller, B., & Villiger, P. M. (2006) · Springer Seminars in Immunopathology · doi:10.1007/s00281-006-0012-9 · Cited by 183
Mast cells contribute to initiation of autoantibody-mediated arthritis via IL-1
Nigrovic, P. A., Binstadt, B. A., Monach, P. A., Johnsen, A. K., Gurish, M. F., Iwakura, Y., Benoist, C. O., Mathis, D. J., & Lee, D. M. (2007) · Proceedings of the National Academy of Sciences · doi:10.1073/pnas.0610852103 · Cited by 180
Kollias, G. A., & Kontoyiannis, D. L. (2002) · Cytokine & Growth Factor Reviews · doi:10.1016/s1359-6101(02)00019-9 · Cited by 177
Self-citationCytokines and anti-cytokine biologicals in autoimmunity: present and future
Andreakos, E., Foxwell, B. M. J., Brennan, F. M., Maini, R. N., & Feldmann, M. (2002) · Cytokine & Growth Factor Reviews · doi:10.1016/s1359-6101(02)00018-7 · Cited by 171
Pakala, S. V., Chivetta, M., Kelly, C. B., & Katz, J. D. (1999) · The Journal of Experimental Medicine · doi:10.1084/jem.189.7.1053 · Cited by 163
Resolution of acute inflammation bridges the gap between innate and adaptive immunity
Newson, J., Stables, M. J., Karra, E., Vargas, F. A., Quezada, S. A., Motwani, M. P., Mack, M., Yona, S., Audzevich, T., & Gilroy, D. W. (2014) · Blood · doi:10.1182/blood-2014-03-562710 · Cited by 159
Immunomodulatory activity of interferon‐beta
Kasper, L. H., & Reder, A. T. (2014) · Annals of Clinical and Translational Neurology · doi:10.1002/acn3.84 · Cited by 159
Chapter 4 Multitasking by Exploitation of Intracellular Transport Functions
Ward, E. S., & Ober, R. J. (2009) · Advances in immunology · doi:10.1016/s0065-2776(09)03004-1 · Cited by 160
TNF in the era of immune checkpoint inhibitors: friend or foe?
Chen, A. Y., Wolchok, J. D., & Bass, A. R. (2021) · Nature Reviews Rheumatology · doi:10.1038/s41584-021-00584-4 · Cited by 169
Chakravarty, S. D., Zhu, G., Tsai, M. C., Mohan, V. P., Marino, S., Kirschner, D. E., Huang, L., Flynn, J. L., & Chan, J. (2008) · Infection and Immunity · doi:10.1128/iai.01011-07 · Cited by 149
Christen, U., Wolfe, T., Möhrle, U., Hughes, A., Rodrigo, E., Green, E. A., Flavell, R., & von Herrath, M. (2001) · Journal of Immunology · doi:10.4049/jimmunol.166.12.7023 · Cited by 161
Immunoregulatory role of TNFα in inflammatory kidney diseases
Ernandez, T., & Mayadas, T. N. (2009) · Kidney International · doi:10.1038/ki.2009.142 · Cited by 148
Artis, D., Humphreys, N. E., Bancroft, A. J., Rothwell, N. J., Potten, C. S., & Grencis, R. K. (1999) · The Journal of Experimental Medicine · doi:10.1084/jem.190.7.953 · Cited by 147
TNF-α and IL-12:a balancing act in macrophage functioning
Ma, X. (2001) · Microbes and Infection · doi:10.1016/s1286-4579(00)01359-9 · Cited by 147
Hodge-Dufour, J., Marino, M. W., Horton, M. R., Jungbluth, A., Burdick, M. D., Strieter, R. M., Noble, P. W., Hunter, C. A., & Puré, E. (1998) · Proceedings of the National Academy of Sciences · doi:10.1073/pnas.95.23.13806 · Cited by 144
T cells and aging (update February 1999)
Pawelec, G. (1999) · Frontiers in bioscience · doi:10.2741/pawelec · Cited by 140
Mannan-Binding Lectin Enhances Susceptibility to Visceral Leishmaniasis
Santos, I. K. F. D. M., Costa, C. H. N., Krieger, H., Feitosa, M. F., Zurakowski, D., Fardin, B., Gomes, R., Weiner, D. L., Harn, D. A., Ezekowitz, R. A. B., et al. (2001) · Infection and Immunity · doi:10.1128/iai.69.8.5212-5215.2001 · Cited by 137
Studies of T-cell activation in chronic inflammation.
Cope, A. P. (2002) · Arthritis Research · doi:10.1186/ar557 · Cited by 137
Self-citationLee, L., Logronio, K. A., Tu, G. H., Zhai, W., Ni, I., Mei, L., Dilley, J., Yu, J., Rajpal, A., Brown, C. N., et al. (2012) · Proceedings of the National Academy of Sciences · doi:10.1073/pnas.1203795109 · Cited by 137
Regulation of autoimmunity by proinflammatory cytokines
Cope, A. P. (1998) · Current Opinion in Immunology · doi:10.1016/s0952-7915(98)80087-3 · Cited by 136
Self-citationGoronzy, J. J., Li, G., Yu, M., & Weyand, C. M. (2012) · Seminars in Immunology · doi:10.1016/j.smim.2012.04.003 · Cited by 134
Parmigiani, A., Alcaide, M. L., Freguja, R., Pallikkuth, S., Frasca, D., Fischl, M. A., & Pahwa, S. G. (2013) · PLoS ONE · doi:10.1371/journal.pone.0079816 · Cited by 132
New insights into the resolution of inflammation
Gilroy, D. W., & Maeyer, R. P. H. D. (2015) · Seminars in Immunology · doi:10.1016/j.smim.2015.05.003 · Cited by 134
Ma, H., Napierata, L., Stedman, N., Benoit, S., Collins, M. A., Nickerson‐Nutter, C. L., & Young, D. A. (2010) · Arthritis & Rheumatism · doi:10.1002/art.27203 · Cited by 130
Vielhauer, V., & Mayadas, T. N. (2007) · Seminars in Nephrology · doi:10.1016/j.semnephrol.2007.02.004 · Cited by 125
Corazza, N., Eichenberger, S., Eugster, H., & Mueller, C. (1999) · The Journal of Experimental Medicine · doi:10.1084/jem.190.10.1479 · Cited by 125
Varttala, T. (2001) · Tampere University Institutional Repository (Tampere University) · Cited by 126
The role of parvovirus B19 in the pathogenesis of giant cell arteritis: A preliminary evaluation
Gabriel, S. E., Espy, M. J., Erdman, D. D., Björnsson, J., Smith, T. F. A., & Hunder, G. G. (1999) · Arthritis & Rheumatism · doi:10.1002/1529-0131(199906)42:6 · Cited by 156
Malka, D., Vasseur, S., Bödeker, H., Ortiz, E. M., Dusetti, N., Verrando, P., Dagorn, J., & Iovanna, J. (2000) · Gastroenterology · doi:10.1053/gast.2000.16491 · Cited by 121
Bo, X., Broome, U., Remberger, M., & Sumitran-Holgersson, S. (2001) · Gut · doi:10.1136/gut.49.1.131 · Cited by 120
Role of Cytokines in the Pathogenesis of Autoimmune Diabetes Mellitus
Rabinovitch, A., & Suarez‐Pinzon, W. L. (2003) · Reviews in Endocrine and Metabolic Disorders · doi:10.1023/a:1025160614313 · Cited by 120
Isomäki, P., Panesar, M., Annenkov, A. E., Clark, J. M., Foxwell, B. M. J., Chernajovsky, Y., & Cope, A. P. (2001) · The Journal of Immunology · doi:10.4049/jimmunol.166.9.5495 · Cited by 119
Self-citationTNF-α blockade induces IL-10 expression in human CD4+ T cells
Evans, H. G., Roostalu, U., Walter, G. J., Gullick, N., Frederiksen, K. S., Roberts, C. A., Sumner, J., Baeten, D., Gerwien, J. G., Cope, A. P., et al. (2014) · Nature Communications · doi:10.1038/ncomms4199 · Cited by 119
Self-citationTNF-α: An Activator of CD4+FoxP3+TNFR2+ Regulatory T Cells
Chen, X., & Oppenheim, J. J. (2010) · Current directions in autoimmunity · doi:10.1159/000289201 · Cited by 115
Lee, L., Xu, B., Michie, S. A., Beilhack, G. F., Warganich, T., Turley, S. J., & McDevitt, H. O. (2005) · Proceedings of the National Academy of Sciences · doi:10.1073/pnas.0508122102 · Cited by 113
Self-citationDick, A. D., Duncan, L., Hale, G., Waldmann, H., & Isaacs, J. D. (1998) · Journal of Autoimmunity · doi:10.1006/jaut.1998.0197 · Cited by 113
Cytokines that regulate autoimmune responses
Falcone, M., & Sarvetnick, N. (1999) · Current Opinion in Immunology · doi:10.1016/s0952-7915(99)00035-7 · Cited by 112
TNF‐α Upregulates Sclerostin Expression in Obese Mice Fed a High‐Fat Diet
Baek, K., Hwang, H. R., Park, H., Kwon, A., Qadir, A. S., Ko, S., Woo, K. M., Ryoo, H., Kim, G., & Baek, J. (2014) · Journal of Cellular Physiology · doi:10.1002/jcp.24487 · Cited by 111
Bench-to-bedside strategies for osteoporotic fracture: From osteoimmunology to mechanosensation
Xie, Y., Zhang, L., Xiong, Q., Gao, Y., Ge, W., & Tang, P. (2019) · Bone Research · doi:10.1038/s41413-019-0066-7 · Cited by 107
TNF-α and its inhibitors in cancer
Zidi, I., Mestiri, S., Bartegi, A., & Amor, N. B. (2009) · Medical Oncology · doi:10.1007/s12032-009-9190-3 · Cited by 105
Stalder, A. K., Carson, M. J., Pagenstecher, A., Asensio, V. C., Kincaid, C., Benedict, M., Powell, H. C., Masliah, E., & Campbell, I. L. (1998) · American Journal Of Pathology · doi:10.1016/s0002-9440(10)65620-9 · Cited by 105
Insights into the biology and therapeutic implications of TNF and regulatory T cells
Salomon, B. L. (2021) · Nature Reviews Rheumatology · doi:10.1038/s41584-021-00639-6 · Cited by 106
Chen, X., & Oppenheim, J. J. (2011) · FEBS Letters · doi:10.1016/j.febslet.2011.04.025 · Cited by 97
Control of myeloid activity during retinal inflammation
Dick, A. D., Carter, D. A., Robertson, M., Broderick, C. A., Hughes, E. H., Forrester, J. V., & Liversidge, J. (2003) · Journal of Leukocyte Biology · doi:10.1189/jlb.1102535 · Cited by 98
Sacca, R. E., Cuff, C. A., & Ruddle, N. H. (1997) · Current Opinion in Immunology · doi:10.1016/s0952-7915(97)80189-6 · Cited by 96
What does tumour necrosis factor excess do to the immune system long term?
Clark, J., Vagenas, P., Panesar, M., & Cope, A. P. (2005) · Annals of the Rheumatic Diseases · doi:10.1136/ard.2005.042523 · Cited by 93
Self-citationMcDevitt, H. O., Munson, S. H., Ettinger, R., & Wu, A. J. (2002) · Arthritis Research · doi:10.1186/ar570 · Cited by 95
Self-citationLara‐Pezzi, E., Armesilla, A. L., Majano, P. L., Redondo, J. M., & López‐Cabrera, M. (1998) · The EMBO Journal · doi:10.1093/emboj/17.23.7066 · Cited by 93
Myeloid suppressor cells require membrane TNFR2 expression for suppressive activity
Polz, J., Remke, A., Weber, S., Schmidt, D., Weber‐Steffens, D., Pietryga‐Krieger, A., Müller, N. C., Ritter, U., Mostböck, S., & Männel, D. N. (2014) · Immunity Inflammation and Disease · doi:10.1002/iid3.19 · Cited by 93
Can blocking inflammation enhance immunity during aging?
Chambers, E. S., & Akbar, A. N. (2020) · Journal of Allergy and Clinical Immunology · doi:10.1016/j.jaci.2020.03.016 · Cited by 92
Tumor Necrosis Factor locus: genetic organisation and biological implications
Makhatadze, N. J. (1998) · Human Immunology · doi:10.1016/s0198-8859(98)00056-1 · Cited by 92
Menegatti, S., Bianchi, E., & Rogge, L. (2019) · Frontiers in Immunology · doi:10.3389/fimmu.2019.00382 · Cited by 94
Kim, K. N., Watanabe, S., Ma, Y., Thornton, S., Giannini, E. H., & Hirsch, R. (2000) · The Journal of Immunology · doi:10.4049/jimmunol.164.3.1576 · Cited by 90
Elyahu, Y., & Monsonego, A. (2020) · Ageing Research Reviews · doi:10.1016/j.arr.2020.101231 · Cited by 93
Berg, L., Lampa, J., Rogberg, S., van Vollenhoven, R., & Klareskog, L. (2001) · Annals of the Rheumatic Diseases · doi:10.1136/ard.60.2.133 · Cited by 88
Dobrzanski, M. J., Reome, J. B., Hollenbaugh, J. A., & Dutton, R. W. (2004) · The Journal of Immunology · doi:10.4049/jimmunol.172.3.1380 · Cited by 87
IL-7– and IL-15–Mediated TCR Sensitization Enables T Cell Responses to Self-Antigens
Deshpande, P., Cavanagh, M., Saux, S. L., Singh, K., Weyand, C. M., & Goronzy, J. J. (2013) · The Journal of Immunology · doi:10.4049/jimmunol.1201620 · Cited by 84
Control of Leishmania major Infection in Mice Lacking TNF Receptors
Nashleanas, M., Kanaly, S. T., & Scott, P. (1998) · The Journal of Immunology · doi:10.4049/jimmunol.160.11.5506 · Cited by 86
Park, E., Jia, J.-H., Quinn, M. R., & Schuller‐Levis, G. (2002) · Clinical Immunology · doi:10.1006/clim.2001.5160 · Cited by 86
Alternative versus classical macrophage activation during experimental African trypanosomosis
Namangala, B., BAETSELIER, P. D., Noël, W., Brys, L., & Beschin, A. (2001) · Journal of Leukocyte Biology · doi:10.1189/jlb.69.3.387 · Cited by 85
Neurological adverse events associated with anti-tumor necrosis factor alpha treatment
Tristano, A. G. (2010) · Journal of Neurology · doi:10.1007/s00415-010-5591-7 · Cited by 85
Stress-Related Immune Markers in Depression: Implications for Treatment
Hughes, M. M., Connor, T. J., & Harkin, A. (2016) · The International Journal of Neuropsychopharmacology · doi:10.1093/ijnp/pyw001 · Cited by 91
Tumour necrosis factor and other cytokines in murine lupus
Theofilopoulos, A. N., & Lawson, B. R. (1999) · Annals of the Rheumatic Diseases · doi:10.1136/ard.58.2008.i49 · Cited by 85
HIV infection Worsens Age-Associated Defects in Antibody Responses to Influenza Vaccine
George, V. K., Pallikkuth, S., Parmigiani, A., Alcaide, M. L., Fischl, M. A., Arheart, K. L., & Pahwa, S. G. (2015) · The Journal of Infectious Diseases · doi:10.1093/infdis/jiu840 · Cited by 83
Regulation by glycogen synthase kinase-3 of inflammation and T cells in CNS diseases
Beurel, E. (2011) · Frontiers in Molecular Neuroscience · doi:10.3389/fnmol.2011.00018 · Cited by 82
Regulation of TCR-mediated T cell activation by TNF-RII
Aspalter, R. M., Eibl, M. M., & Wolf, H. M. (2003) · Journal of Leukocyte Biology · doi:10.1189/jlb.0303112 · Cited by 76
Cell-Based Immunotherapy with Suppressor CD8+ T Cells in Rheumatoid Arthritis
Dávila, E., Kang, Y. M., Park, Y. W., Sawai, H., He, X., Pryshchep, S., Goronzy, J. J., & Weyand, C. M. (2005) · The Journal of Immunology · doi:10.4049/jimmunol.174.11.7292 · Cited by 78
Metadata
- Authors
- Cope, A. P., Liblau, R. S., Yang, X.-D., Congia, M., Laudanna, C., Schreiber, R. D., Probert, L., Kollias, G., & McDevitt, H. O.
- Affiliations
- Washington University in St. Louis (US)
- From the *Department of Microbiology and Immunology, ‡Department of Pathology, and §Department of Medicine, Stanford University School of Medicine, Stanford, California 94305; ‖Department of Pathology, Washington University School of Medicine, St. Louis, Missouri 63110; and ¶Department of Molecular Genetics, Hellenic Pasteur Institute, Athens, Greece
- ORCID
- Venue
- The Journal of Experimental Medicine
- Publisher
- Rockefeller University Press
- Published
- 1997-05-05
- Volume
- 185
- Issue
- 9
- Pages
- 1573-1584
- ISSN
- 0022-1007 (ISSN-L)
- 1540-9538
- PMC
- PMC2196294
- OpenAlex
- W2153191296
- Cited by
- 287
- References
- 38
- Citations by year
- 2026: 3 · 2025: 4 · 2023: 4 · 2022: 1 · 2021: 8 · 2020: 4 · 2019: 6 · 2018: 3 · 2017: 4 · 2016: 11 · 2015: 6 · 2014: 11 · 2013: 8 · 2012: 13
- FWCI
- 8.32
- Type
- journal article
- Language
- en
- Open access
- bronze
- doi.org
- Locations
- The Journal of Experimental Medicine (publishedVersion)
- PubMed Central (publishedVersion, cc-by-nc-sa)
- PubMed (publishedVersion)
- Funders
- Wellcome Trust
- Institut National de la Santé et de la Recherche Médicale
- National Institutes of Health
- School of Medicine, Stanford University
- Topics
- Life Sciences › Immunology and Microbiology › Immunology › T-cell and B-cell Immunology
- Health Sciences › Medicine › Rheumatology › Rheumatoid Arthritis Research and Therapies
- Life Sciences › Immunology and Microbiology › Immunology › Cytokine Signaling Pathways and Interactions
- Keywords
- TNF-α, T cell receptor signaling, T cell suppression, TNF receptor p55, T cell proliferation, cytokine production, anti-TNF therapy, autoimmunity, type 1 diabetes, chronic inflammation
- MeSH terms
- Animals, Calcium, Immunosuppressive Agents, Interferon-gamma, Interleukin-2, Lymph Nodes, Lymphocyte Activation, Male, Mice, Inbred BALB C, Mice, Transgenic, Receptors, Antigen, T-Cell, Recombinant Proteins, T-Lymphocytes, Tumor Necrosis Factor-alpha, Signal Transduction, CD4-Positive T-Lymphocytes, Interleukin-4, Interleukin-10, Receptors, Tumor Necrosis Factor, Th1 Cells, Th2 Cells, Mice
About these checks
Registry, retraction, Cites and statistics results are computed, not judged, with one exception: a printed reference that no index lists is read once by a model before it counts as a citation error. Claims are extracted by a model and kept only when their quote appears verbatim in the text; each cited source is then checked, with a model’s help, for whether it says what the claim relies on. Those verdicts can be wrong — read the claim’s quote and the cited source before relying on one.
Statistics and arithmetic are recomputed, not judged.
Confidence bands are shown only for fields calibrated on our annotated test set. None is calibrated yet, so no band is shown.
What counts as a claim ›How we measure confidence ›How we check this ›
Are you an author, or do you see a problem with this page? Request a review
