

The DOI matches its Crossref record; 46 of the 49 references it cites were found in a registry or an index.
A Point Mutation of Tyr-759 in Interleukin 6 Family Cytokine Receptor Subunit gp130 Causes Autoimmune Arthritis
Open accessAbstract
We generated a mouse line in which the src homology 2 domain–bearing protein tyrosine phosphatase (SHP)-2 binding site of gp130, tyrosine 759, was mutated to phenylalanine (gp130F759/F759). The gp130F759/F759 mice developed rheumatoid arthritis (RA)-like joint disease. The disease was accompanied by autoantibody production and accumulated memory/activated T cells and myeloid cells. Before the disease onset, the T cells were hyperresponsive and thymic selection and peripheral clonal deletion were impaired. The inhibitory effect of IL-6 on Fas ligand expression during activation-induced cell death (AICD) was augmented in gp130F759/F759 T cells in a manner dependent on the tyrosine residues of gp130 required for signal transducer and activator of transcription 3 activation. Finally, we showed that disease development was dependent on lymphocytes. These results provide evidence that a point mutation of a cytokine receptor has the potential to induce autoimmune disease.
Overview
The claims and statistics of this paper haven’t been checked yet.
Run the check — free, no account needed. It reads the open-access text and checks the sources it cites.
Integrity signals
Registry
Cites
Statistics
Figures
Verification
Claims the paper makes
The claims and statistics of this paper haven’t been checked yet.
Run the check — free, no account needed. It reads the open-access text and checks the sources it cites.
Claims other papers make about this one
Each is checked against this paper’s own text: does it say what the citing paper says it does?
The source backs part of the claim, not all of it — or backs it for a different population, condition or comparison.
In the citing paper
“On the other hand, the enhancement of IL-6–STAT3 signaling causes IL-17A-dependent autoimmune arthritis in mice (41, 63, 66).”
From IL-6 in inflammation, autoimmunity and cancer (2021) · cites this paper as [63]
Experimental — accuracy not yet measured
Self-check
Percentages, sums and reported differences re-computed from the paper’s own numbers.
The self-check needs the paper’s full text.
Citations
Cites
Hirano, T., Yasukawa, K., Harada, H., Taga, T., Watanabe, Y., Matsuda, T., Kashiwamura, S.-I., Nakajima, K., Koyama, K., Iwamatsu, A., et al. (1986) · Nature · doi:10.1038/324073a0 · Cited by 2,139 · cited 1×
“IL-6, which was originally identified as a B cell differentiation factor (13, 14), is now known to be a multifunctional cytokine that regulates the immune response, hematopoiesis, the acute phase response, and inflammation (4, 15).”
BackgroundSelf-citationVan Snick, J. (1990) · Annual Review of Immunology · doi:10.1146/annurev.iy.08.040190.001345 · Cited by 1,890 · cited 1×
“IL-6, which was originally identified as a B cell differentiation factor (13, 14), is now known to be a multifunctional cytokine that regulates the immune response, hematopoiesis, the acute phase response, and inflammation (4, 15).”
BackgroundTolerance in T-cell-receptor transgenic mice involves deletion of nonmature CD4+8+ thymocytes
Kisielow, P., Blüthmann, H., Staerz, U., Steinmetz, M., & von Boehmer, H. (1988) · Nature · doi:10.1038/333742a0 · Cited by 1,793 · cited 1×
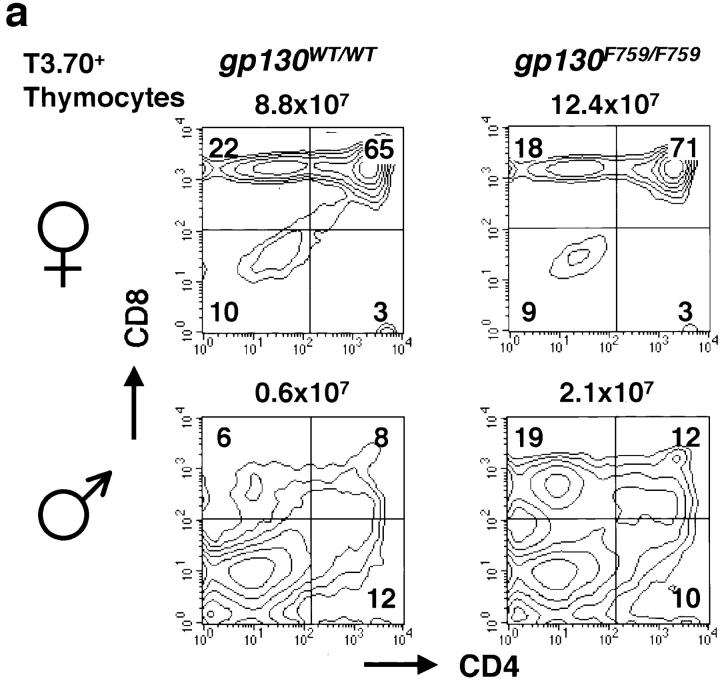
“We crossed gp130F759/F759 mice with anti–HY-TCR transgenic mice to examine the effect of the gp130F759/F759 mutation on thymic selection (39).”
MethodTransgenic mice expressing human tumour necrosis factor: a predictive genetic model of arthritis.
Keffer, J., Probert, L., Cazlaris, H. E., Georgopoulos, S., Kaslaris, E., Kioussis, D., & Kollias, G. A. (1991) · The EMBO Journal · doi:10.1002/j.1460-2075.1991.tb04978.x · Cited by 1,670 · cited 1×
“TNF- transgenic mice and TNF AU-rich elements-deficient mice revealed that TNF- is a pivotal cytokine for the induction of other proinflammatory cytokines and for the abnormal growth of synovial cells (9, 10).”
BackgroundImpaired On/Off Regulation of TNF Biosynthesis in Mice Lacking TNF AU-Rich Elements
Kontoyiannis, D. L., Pasparakis, M., Pizarro, T. T., Cominelli, F., & Kollias, G. A. (1999) · Immunity · doi:10.1016/s1074-7613(00)80038-2 · Cited by 1,329 · cited 2×
“This is in sharp contrast to the arthritis that develops in TNF AUrich elements-deficient mice, which is independent of lymphocytes (9).”
BackgroundResultHirano, T., Ishihara, K., & Hibi, M. (2000) · Oncogene · doi:10.1038/sj.onc.1203551 · Cited by 1,207
Self-citationHomeostasis and Self-Tolerance in the Immune System: Turning Lymphocytes off
Parijs, L. V., & Abbas, A. K. (1998) · Science · doi:10.1126/science.280.5361.243 · Cited by 958
Organ-specific disease provoked by systemic autoimmunity.
Kouskoff, V., Korganow, A., Duchatelle, V., Degott, C., Benoist, C., & Mathis, D. (1996) · Cell · doi:10.1016/s0092-8674(00)81989-3 · Cited by 949 · cited 1×
“Analyses of the K/BxN TCR transgenic mouse showed that an autoantibody specific to a ubiquitous molecule can induce an organ-specific autoimmune disease (2, 6, 7).”
BackgroundInterleukin 6 and its receptor: ten years later
Hirano, T. (1998) · International Reviews of Immunology · doi:10.3109/08830189809042997 · Cited by 788
Self-citationExcessive production of interleukin 6/B cell stimulatory factor-2 in rheumatoid arthritis
Hirano, T., Matsuda, T., Turner, M., Miyasaka, N., Buchan, G., Tang, B., Sato, K., Shimi, M., Maid, R., Feldmann, M., et al. (1988) · European Journal of Immunology · doi:10.1002/eji.1830181122 · Cited by 784 · cited 1×
“Since then, several pieces of evidence have been reported that suggest the involvement of IL-6 in autoimmune diseases, including RA (4, 17).”
BackgroundSelf-citationHorai, R., Saijo, S., Tanioka, H., Nakae, S., Sudo, K., Okahara, A., Ikuse, T., Asano, M., & Iwakura, Y. (2000) · The Journal of Experimental Medicine · doi:10.1084/jem.191.2.313 · Cited by 752 · cited 1×
“IL-1 transgenic mice (11) and gene targeting of an IL-1 receptor antagonist (12) indicated that the increased T.”
BackgroundKawabe, Y., & Ochi, A. (1991) · Nature · doi:10.1038/349245a0 · Cited by 703 · cited 1×
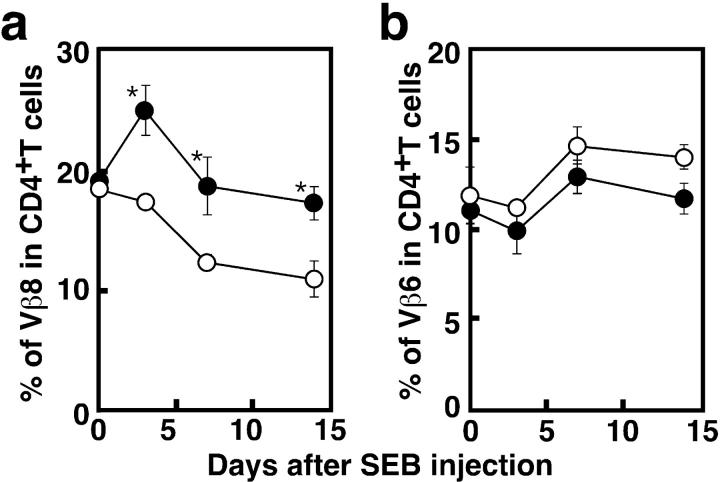
“For this study we injected a superantigen, SEB, into the mice (41).”
MethodArthritis provoked by linked T and B cell recognition of a glycolytic enzyme.
Matsumoto, I., Staub, A., Benoist, C., & Mathis, D. (1999) · Science · doi:10.1126/science.286.5445.1732 · Cited by 667 · cited 2×
“The involvement of autoantibody in RA or experimentally induced arthritis model has been recently reconsidered (2, 7).”
BackgroundFukada, T., Hibi, M., Yamanaka, Y., Takahashi-Tezuka, M., Fujitani, Y., Yamaguchi, T., Nakajima, K., & Hirano, T. (1996) · Immunity · doi:10.1016/s1074-7613(00)80501-4 · Cited by 652 · cited 1×
“Several experiments in vitro have indicated that the SHP-2– and STAT-3–mediated signal-transduction pathways that are initiated through gp130 are involved in growth, differentiation, and gene expression in various cell lines (24, 25, 27, 28).”
BackgroundSelf-citationQuantification of murine cytokine mRNAs using real time quantitative reverse transcriptase PCR.
Overbergh, L., Valckx, D., Waer, M., & Mathieu, C. (1999) · Cytokine · doi:10.1006/cyto.1998.0426 · Cited by 623
Interleukin 6 is required for the development of collagen-induced arthritis
Alonzi, T., Fattori, E., Lazzaro, D., Costa, P., Probert, L., Kollias, G., De Benedetti, F., Poli, V., & Ciliberto, G. (1998) · The Journal of Experimental Medicine · doi:10.1084/jem.187.4.461 · Cited by 604
Takeda, K., Kaisho, T., Yoshida, N., Takeda, J., Kishimoto, T., & Akira, S. (1998) · The Journal of Immunology · doi:10.4049/jimmunol.161.9.4652 · Cited by 584
Nakajima, K., Yamanaka, Y., Nakae, K., Kojima, H., Ichiba, M., Kiuchi, N., Kitaoka, T., Fukada, T., Hibi, M., & Hirano, T. (1996) · The EMBO Journal · doi:10.1002/j.1460-2075.1996.tb00734.x · Cited by 565 · cited 1×
“Several experiments in vitro have indicated that the SHP-2– and STAT-3–mediated signal-transduction pathways that are initiated through gp130 are involved in growth, differentiation, and gene expression in various cell lines (24, 25, 27, 28).”
BackgroundSelf-citationRole of cytokines in rheumatoid arthritis.
Odeh, M. (1998) · Drug News and Perspectives · doi:10.1358/dnp.1998.11.6.661380 · Cited by 483 · cited 1×
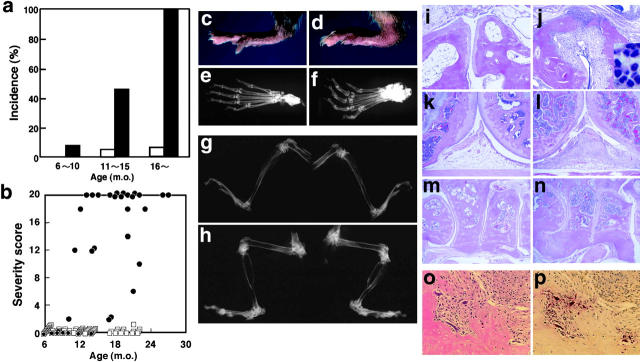
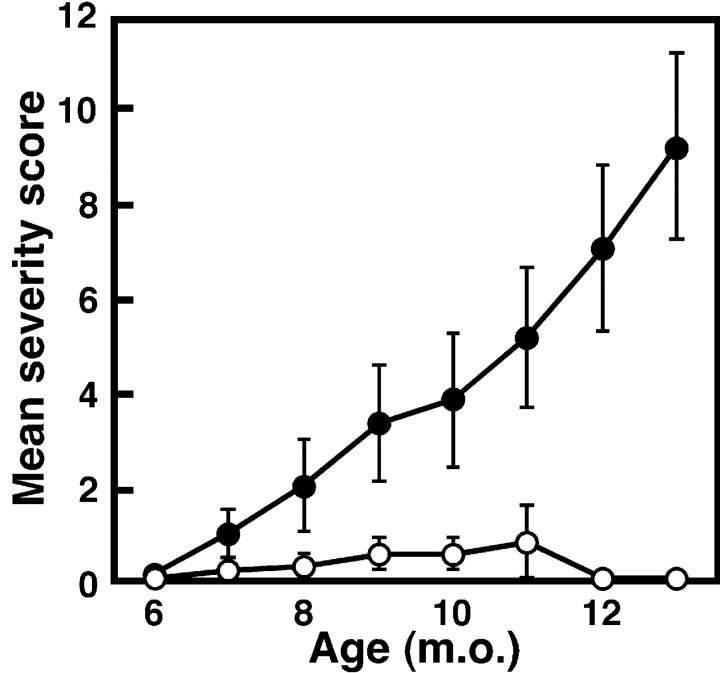
“digits of the forelimb; (2) swelling of the footpad; (3) swelling of”
BackgroundNicholson, S. E., De Souza, D., Fabri, L. J., Corbin, J., Willson, T. A., Zhang, J.-G., Silva, A., Asimakis, M., Farley, A., Nash, A. D., et al. (2000) · Proceedings of the National Academy of Sciences · doi:10.1073/pnas.100135197 · Cited by 456 · cited 9×
“Transcription levels of SOCS-3 mRNA were estimated by quantitative RT-PCR.”
BackgroundInfluentialSamoilova, E. B., Horton, J. L., Hilliard, B. A., Liu, T.-S. T., & Chen, Y. (1998) · The Journal of Immunology · doi:10.4049/jimmunol.161.12.6480 · Cited by 441 · cited 1×
“Furthermore, IL-6 is required for experimentally induced autoimmune diseases or autoimmunity, including type II collagen- and antigen-induced arthritis (18– 20), myelin oligodendrocyte protein-induced experimental autoimmune encephalomyelitis (21, 22), and pristaneinduced autoantibody production (23).”
BackgroundBouneaud, C., Kourilsky, P., & Bousso, P. (2000) · Immunity · doi:10.1016/s1074-7613(00)00080-7 · Cited by 431 · cited 1×
“It has been reported that substantially self-reactive clones with TCRs that have low avidity to self-antigen escape negative selection (43).”
BackgroundInterleukin 6 plays a key role in the development of antigen-induced arthritis
Ohshima, S., Saeki, Y., Mima, T., Sasai, M., Nishioka, K., Nomura, S., Kopf, M., Katada, Y., Tanaka, T., Suemura, M., et al. (1998) · Proceedings of the National Academy of Sciences · doi:10.1073/pnas.95.14.8222 · Cited by 406
Self-citationSchmitz, J., Weissenbach, M., Haan, S., Heinrich, P. C., & Schaper, F. (2000) · Journal of Biological Chemistry · doi:10.1074/jbc.275.17.12848 · Cited by 388 · cited 9×
“Transcription levels of SOCS-3 mRNA were estimated by quantitative RT-PCR.”
BackgroundInfluentialSignaling mechanisms through gp130: A model of the cytokine system
Hirano, T., Nakajima, K., & Hibi, M. (1997) · Cytokine & Growth Factor Reviews · doi:10.1016/s1359-6101(98)80005-1 · Cited by 375 · cited 4×
“gp130 is shared by the receptors for IL-6 family cytokines, including leukemia inhibitory factor, ciliary neurotropic factor, oncostatin M, IL-11, and cardiotropin-1 (24).”
BackgroundInfluentialSelf-citationHirano, T., Taga, T., Yasukawa, K., Nakajima, K., Nakano, N., Takatsuki, F., Shimizu, M., Murashima, A., Tsunasawa, S., & Sakiyama, F. (1987) · Proceedings of the National Academy of Sciences · doi:10.1073/pnas.84.1.228 · Cited by 351 · cited 1×
“The first suggestion that IL-6 is involved in autoimmunity came from the finding that it is produced by cardiac myxoma cells, and patients with cardiac myxoma frequently show autoimmune symptoms (16).”
BackgroundSelf-citationInduction of Inflammatory Arthropathy Resembling Rheumatoid Arthritis in Mice Transgenic for HTLV-I
Iwakura, Y., Tosu, M., Yoshida, E., Takiguchi, M., Sato, K., Kitajima, I., Nishioka, K., Yamamoto, K., Takeda, T., Hatanaka, M., et al. (1991) · Science · doi:10.1126/science.1887217 · Cited by 336 · cited 1×
“The HTLV-1 transgenic mouse is an animal model of arthritis that is triggered by viral infection (8).”
BackgroundOhtani, T., Ishihara, K., Atsumi, T., Nishida, K., Kaneko, Y., Miyata, T., Itoh, S., Narimatsu, M., Maeda, H., Fukada, T., et al. (2000) · Immunity · doi:10.1016/s1074-7613(00)80162-4 · Cited by 284 · cited 6×
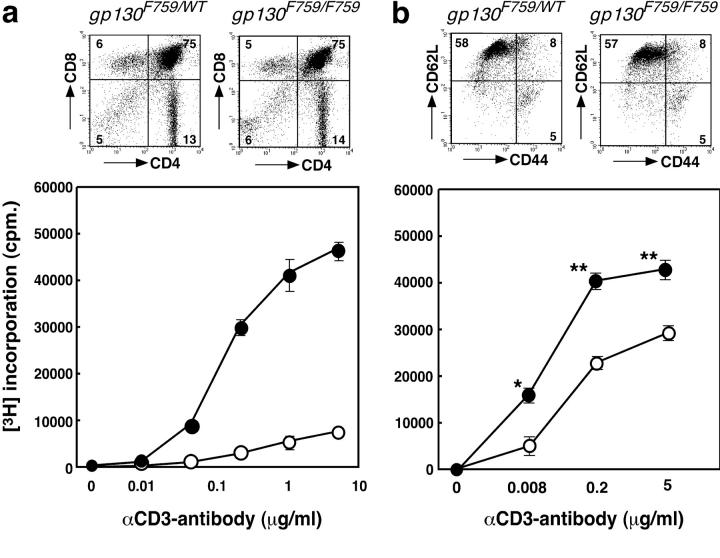
“7 d, the IL-6–induced tyrosine-phosphorylation of JAK-1 and STAT-3 was prolonged, compared with wild-type T cells, consistent with the previous results observed in gp130F759/F759 fibroblasts (33).”
BackgroundMethodResultInfluentialSelf-citationIL-6 rescues resting mouse T cells from apoptosis.
Teague, T., Marrack, P., Kappler, J., & Vella, A. (1997) · Journal of Immunology · doi:10.4049/jimmunol.158.12.5791 · Cited by 280
Teh, H., Kishi, H., Scott, B., & von Boehmer, H. (1989) · Journal of Experimental Medicine · doi:10.1084/jem.169.3.795 · Cited by 249 · cited 1×
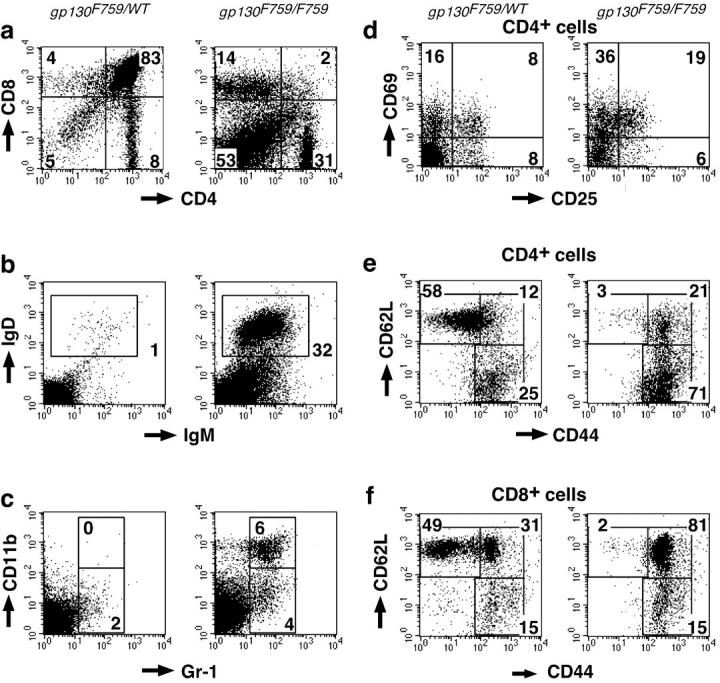
“5 b), which are thought to be the thymocytes that have escaped negative selection (40), was higher in gp130F759/F759 mice, indicating that the negative selection in gp130F759/F759 mice was impaired to some exFigure 3.”
BackgroundErnst, M., Inglese, M., Waring, P., Campbell, I. K., Bao, S., Clay, F. J., Alexander, W. S., Wicks, I. P., Tarlinton, D. M., Novak, U., et al. (2001) · The Journal of Experimental Medicine · doi:10.1084/jem.194.2.189 · Cited by 227 · cited 1×
“reported that the knock-in mouse gp130 STAT/ STAT displays impaired acute phase and immune responses and develops severe gastrointestinal ulceration and joint disease (42).”
BackgroundSengupta, T. K., Talbot, E. S., Scherle, P., & Ivashkiv, L. B. (1998) · Proceedings of the National Academy of Sciences · doi:10.1073/pnas.95.19.11107 · Cited by 226 · cited 1×
“SHP-2–mediated ERK mitogen-activated protein (MAP) kinase activation has been suggested to play negative roles in STAT-3–mediated biological responses (29, 30).”
BackgroundRepression of Stat3 activity by activation of mitogen-activated protein kinase (MAPK)
Jain, N., Zhang, T., Fong, S., Lim, C. P., & Cao, X. (1998) · Oncogene · doi:10.1038/sj.onc.1202238 · Cited by 213 · cited 1×
“SHP-2–mediated ERK mitogen-activated protein (MAP) kinase activation has been suggested to play negative roles in STAT-3–mediated biological responses (29, 30).”
BackgroundRichards, H., Satoh, M., Shaw, M., Libert, C., Poli, V., & Reeves, W. (1998) · Journal of Experimental Medicine · doi:10.1084/jem.188.5.985 · Cited by 213 · cited 1×
“Furthermore, IL-6 is required for experimentally induced autoimmune diseases or autoimmunity, including type II collagen- and antigen-induced arthritis (18– 20), myelin oligodendrocyte protein-induced experimental autoimmune encephalomyelitis (21, 22), and pristaneinduced autoantibody production (23).”
BackgroundNarimatsu, M., Maeda, H., Itoh, S., Atsumi, T., Ohtani, T., Nishida, K., Itoh, M., Kamimura, D., Park, S., Mizuno, K., et al. (2001) · Molecular and Cellular Biology · doi:10.1128/mcb.21.19.6615-6625.2001 · Cited by 145
Self-citationTeranishi, T., Hirano, T., Arima, N., & Onoue, K. (1982) · Journal of Immunology · doi:10.4049/jimmunol.128.4.1903 · Cited by 110 · cited 1×
“IL-6, which was originally identified as a B cell differentiation factor (13, 14), is now known to be a multifunctional cytokine that regulates the immune response, hematopoiesis, the acute phase response, and inflammation (4, 15).”
BackgroundSelf-citationMacrophage- and neutrophil- dominant arthritis in human IL-1α transgenic mice
Niki, Y., Yamada, H., Seki, S., Kikuchi, T., Takaishi, H., Toyama, Y., Fujikawa, K., & Tada, N. (2001) · Journal of Clinical Investigation · doi:10.1172/jci11530 · Cited by 100 · cited 1×
“IL-1 transgenic mice (11) and gene targeting of an IL-1 receptor antagonist (12) indicated that the increased T.”
BackgroundHibi, M., & Hirano, T. (2000) · Leukemia and Lymphoma · doi:10.3109/10428190009089430 · Cited by 94 · cited 1×
“The src homology 2 domain–bearing protein tyrosine phosphatase (SHP)-2, is recruited to the phosphorylated tyrosine residue Y759 in gp130, where it becomes activated and forms a complex with the adaptor docking proteins, Gab1 and Gab2, leading to activation of the Ras–MAP kinase pathway (26).”
BackgroundSelf-citationAyroldi, E., Zollo, O., Cannarile, L., Adamio, F. D., Grohmann, U., Delfino, D., & Riccardi, C. (1998) · Blood · doi:10.1182/blood.v92.11.4212 · Cited by 87 · cited 1×
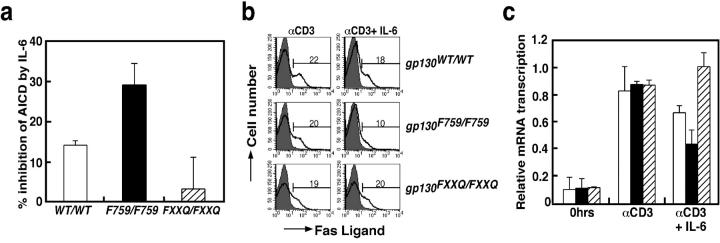
“Several reports indicated that IL-6 has antiapoptotic effects on naive but not activated T cells (45–47), and the inhibition of AICD and downregulation of FasL by IL-6 has been reported previously (48).”
BackgroundRegulation of activation-induced cell death of mature T-lymphocyte populations
Janßen, O., Sanzenbacher, R., & Kabelitz, D. (2000) · Cell and Tissue Research · doi:10.1007/s004419900155 · Cited by 82 · cited 1×
“In addition to thymic selection, the clonal deletion of activated T cells in the periphery is important to maintain selftolerance (37, 44).”
BackgroundItoh, M., Ishihara, K., Hiroi, T., Lee, B. O., Maeda, H., Iijima, H., Yanagita, M., Kiyono, H., & Hirano, T. (1998) · Journal of Immunology · doi:10.4049/jimmunol.161.8.3974 · Cited by 71 · cited 1×
“Serum levels of total Igs were determined by an isotype-specific ELISA as described previously (34).”
MethodSelf-citationDelayed onset and reduced severity of collagen-induced arthritis in interleukin-6-deficient mice
梅下, 光. (2000) · doi:10.11501/3169227 · Cited by 55
Ishihara, K., Kobune, Y., Okuyama, Y., Itoh, M., Lee, B. O., Muraoka, O., & Hirano, T. (1996) · International Immunology · doi:10.1093/intimm/8.9.1395 · Cited by 34 · cited 1×
“Flow cytometry analysis was performed as described previously (36), and analyzed using a FACSCaliburTM flow cytometer (Becton Dickinson).”
MethodSelf-citationRevival of the autoantibody model in rheumatoid arthritis
Hirano, T. (2002) · Nature Immunology · doi:10.1038/ni0402-342 · Cited by 29 · cited 4×
“digits of the forelimb; (2) swelling of the footpad; (3) swelling of”
BackgroundInfluentialSelf-citationLong-term remission with allogenic bone marrow transplantation in systemic lupus erythematosus
Gur-Lavi, M. (1999) · Arthritis & Rheumatism · doi:10.1002/1529-0131(199908)42:8 · Cited by 25
Self-citationThe TNF receptor family member CD27 signals to Jun N-terminal kinase via Traf-2
Eugster (1998) · Pure Amsterdam UMC · doi:10.1002/(sici)1521-4141(199807)28:07 · Cited by 2
Cited by
Sorted by citations
IL-6 as a keystone cytokine in health and disease
Hunter, C. A., & Jones, S. A. (2015) · Nature Immunology · doi:10.1038/ni.3153 · Cited by 2,511
Revisiting STAT3 signalling in cancer: new and unexpected biological functions
Yu, H., Lee, H., Herrmann, A., Buettner, R., & Jove, R. (2014) · Nature Reviews Cancer · doi:10.1038/nrc3818 · Cited by 2,137
IL-6 in inflammation, autoimmunity and cancer
Hirano, T. (2021) · International Immunology · doi:10.1093/intimm/dxaa078 · Cited by 1,453
“Similarly, defective STAT3 activation enhances SHP-2–ERK–MAPK activation pathways, most likely through an impaired STAT3-mediated induction of suppressor of cytokine signaling 3 (SOCS3) (111, 112).”
BackgroundInfluentialSelf-citationRecent insights into targeting the IL-6 cytokine family in inflammatory diseases and cancer
Jones, S. A., & Jenkins, B. J. (2018) · Nature Reviews Immunology · doi:10.1038/s41577-018-0066-7 · Cited by 1,102
Sakaguchi, N., Takahashi, T., Hata, H., Nomura, T., Tagami, T., Yamazaki, S., Sakihama, T., Matsutani, T., Negishi, I., Nakatsuru, S., et al. (2003) · Nature · doi:10.1038/nature02119 · Cited by 881
Metadata
- Authors
- Atsumi, T., Ishihara, K., Kamimura, D., Ikushima, H., Ohtani, T., Hirota, S., Kobayashi, H., Park, S.-J., Saeki, Y., Kitamura, Y., & Hirano, T.
- Affiliations
- RIKEN (JP)
- The University of Osaka (JP)
- 1Department of Molecular Oncology (C7), Graduate School of Medicine
- 2Department of Pathology (C2), Graduate School of Medicine
- Kowa (Japan) (JP)
- 3Department of Molecular Medicine (C4), Graduate School of Medicine
- ORCID
- Venue
- The Journal of Experimental Medicine
- Publisher
- Rockefeller University Press
- Published
- 2002-09-30
- Volume
- 196
- Issue
- 7
- Pages
- 979-990
- ISSN
- 0022-1007 (ISSN-L)
- 1540-9538
- PMC
- PMC2194024
- OpenAlex
- W2145478309
- Cited by
- 225
- References
- 49
- Citations by year
- 2026: 2 · 2025: 3 · 2024: 4 · 2023: 4 · 2022: 4 · 2021: 4 · 2020: 3 · 2019: 13 · 2018: 7 · 2017: 7 · 2016: 4 · 2015: 12 · 2014: 10 · 2013: 11 · 2012: 13
- FWCI
- 6.53
- Type
- journal article
- Language
- en
- Open access
- green
- www.ncbi.nlm.nih.gov
- Licence
- cc-by-nc-sa
- Locations
- The Journal of Experimental Medicine (publishedVersion)
- PubMed Central (publishedVersion, cc-by-nc-sa)
- PubMed (publishedVersion)
- Topics
- Life Sciences › Immunology and Microbiology › Immunology › Cytokine Signaling Pathways and Interactions
- Health Sciences › Medicine › Rheumatology › Rheumatoid Arthritis Research and Therapies
- Life Sciences › Immunology and Microbiology › Immunology › T-cell and B-cell Immunology
- Keywords
- gp130, rheumatoid arthritis, autoimmune arthritis, autoantibodies, thymic selection, Fas ligand, activation-induced cell death, STAT3 signaling
- MeSH terms
- Animals, Antibody Formation, Arthritis, Experimental, Base Sequence, Binding Sites, Bone and Bones, Enterotoxins, Lymph Nodes, Mice, Inbred C57BL, Mice, Transgenic, Staphylococcus aureus, T-Lymphocytes, Tyrosine, CD4-Positive T-Lymphocytes, Polymerase Chain Reaction, Apoptosis, Point Mutation, DNA Primers, Superantigens, Amino Acid Substitution, Receptors, Interleukin-6, Protein Subunits, Mice
About these checks
Registry, retraction, Cites and statistics results are computed, not judged, with one exception: a printed reference that no index lists is read once by a model before it counts as a citation error. Claims are extracted by a model and kept only when their quote appears verbatim in the text; each cited source is then checked, with a model’s help, for whether it says what the claim relies on. Those verdicts can be wrong — read the claim’s quote and the cited source before relying on one.
Statistics and arithmetic are recomputed, not judged.
Confidence bands are shown only for fields calibrated on our annotated test set. None is calibrated yet, so no band is shown.
What counts as a claim ›How we measure confidence ›How we check this ›
Are you an author, or do you see a problem with this page? Request a review
