

The DOI matches its Crossref record; 91 of the 92 references it cites were found in a registry or an index.
Identification of cell cycle-regulated genes periodically expressed in U2OS cells and their regulation by FOXM1 and E2F transcription factors
Open accessAbstract
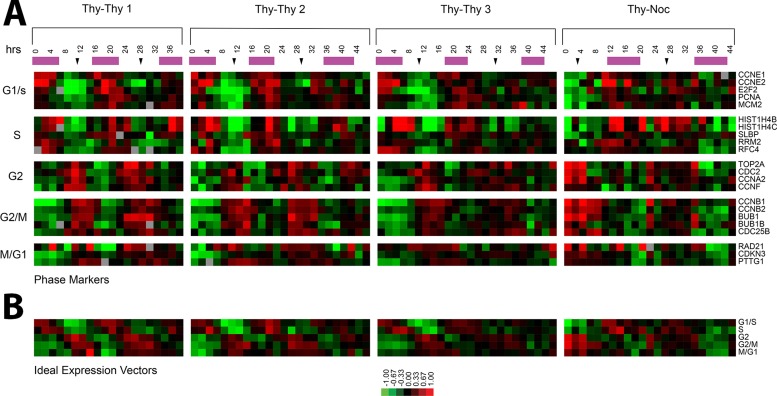
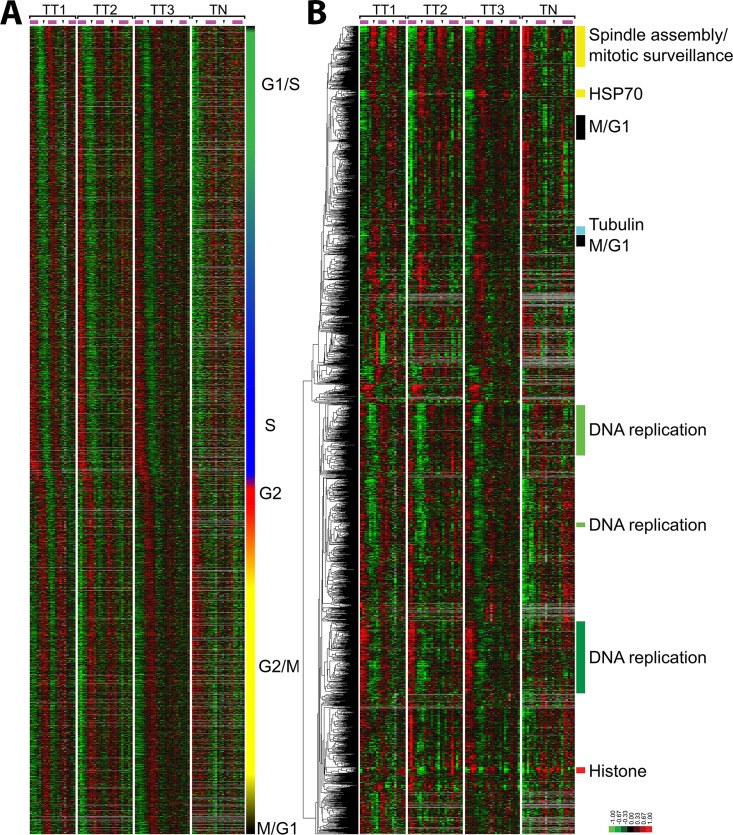
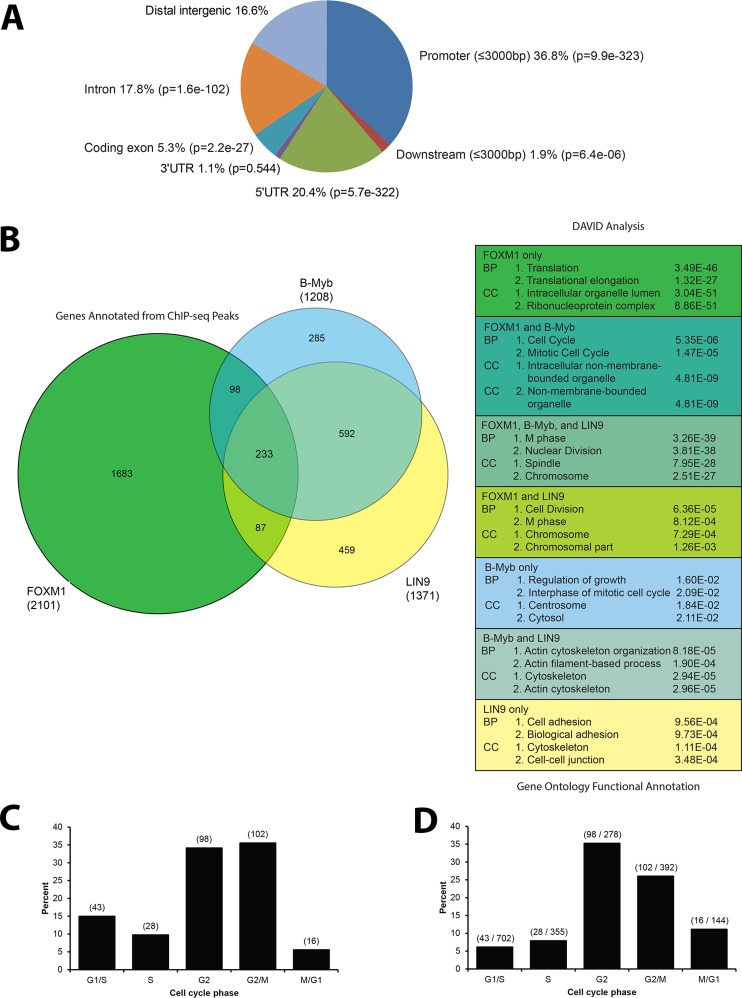
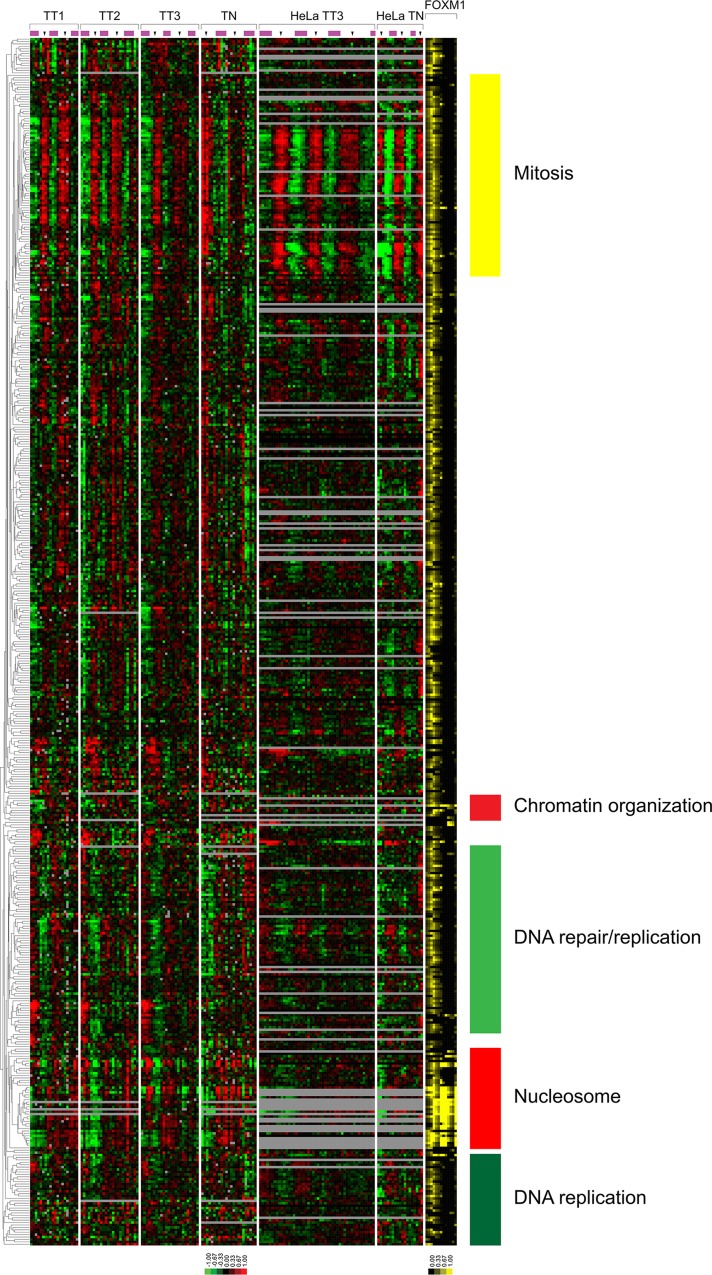
We identify the cell cycle-regulated mRNA transcripts genome-wide in the osteosarcoma-derived U2OS cell line. This results in 2140 transcripts mapping to 1871 unique cell cycle-regulated genes that show periodic oscillations across multiple synchronous cell cycles. We identify genomic loci bound by the G2/M transcription factor FOXM1 by chromatin immunoprecipitation followed by high-throughput sequencing (ChIP-seq) and associate these with cell cycle-regulated genes. FOXM1 is bound to cell cycle-regulated genes with peak expression in both S phase and G2/M phases. We show that ChIP-seq genomic loci are responsive to FOXM1 using a real-time luciferase assay in live cells, showing that FOXM1 strongly activates promoters of G2/M phase genes and weakly activates those induced in S phase. Analysis of ChIP-seq data from a panel of cell cycle transcription factors (E2F1, E2F4, E2F6, and GABPA) from the Encyclopedia of DNA Elements and ChIP-seq data for the DREAM complex finds that a set of core cell cycle genes regulated in both U2OS and HeLa cells are bound by multiple cell cycle transcription factors. These data identify the cell cycle-regulated genes in a second cancer-derived cell line and provide a comprehensive picture of the transcriptional regulatory systems controlling periodic gene expression in the human cell division cycle.
Overview
The claims and statistics of this paper haven’t been checked yet.
Run the check — free, no account needed. It reads the open-access text and checks the sources it cites.
Integrity signals
Registry
Cites
Statistics
Figures
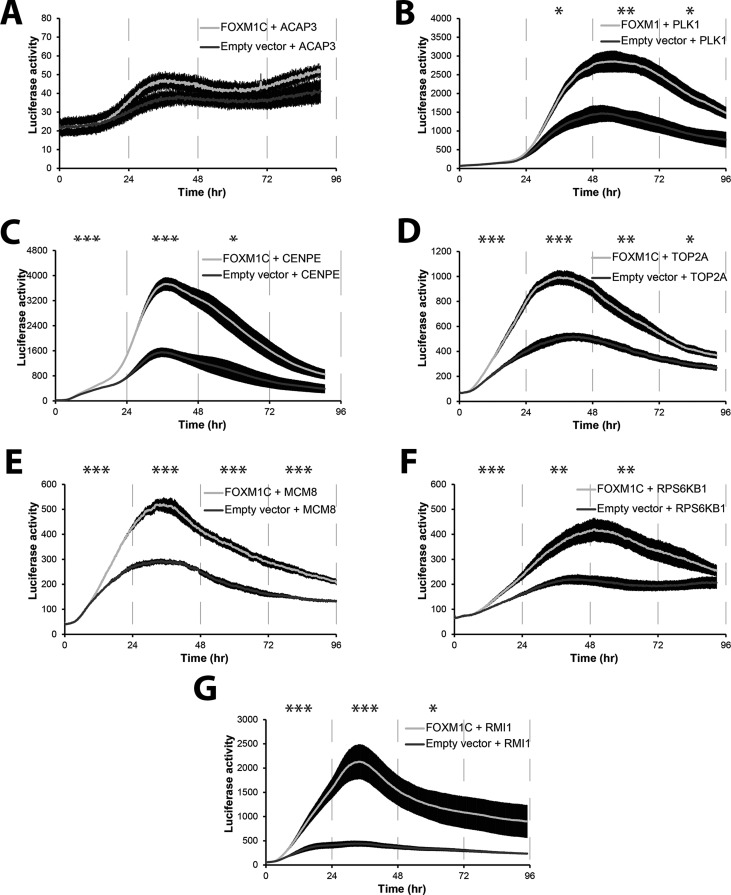
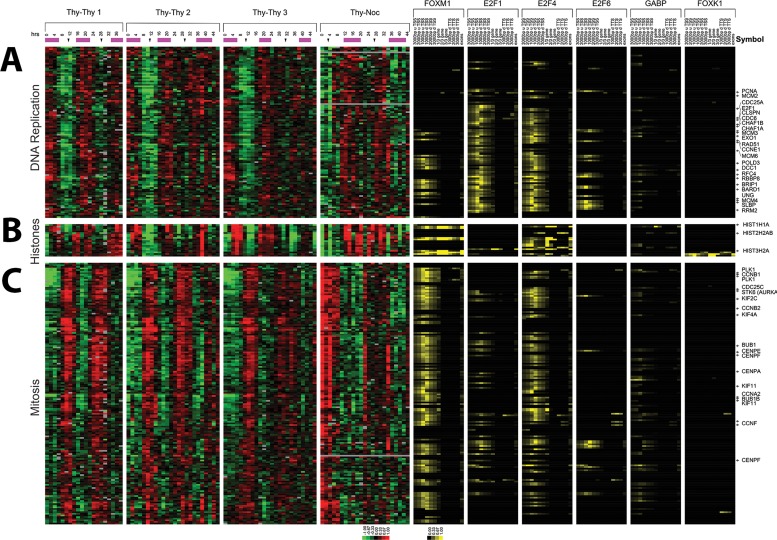
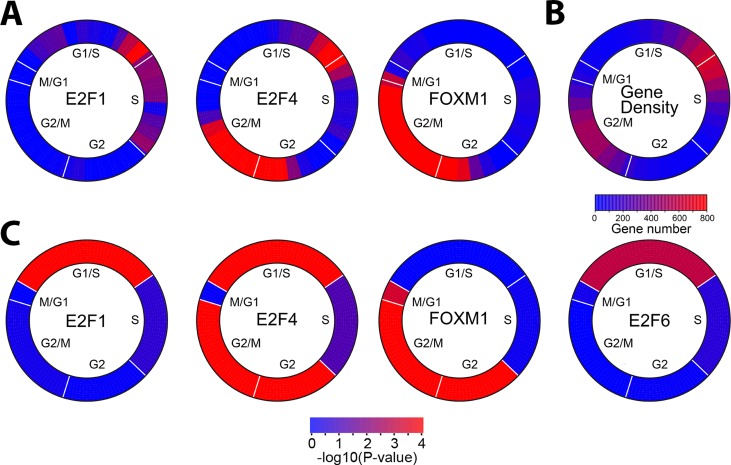
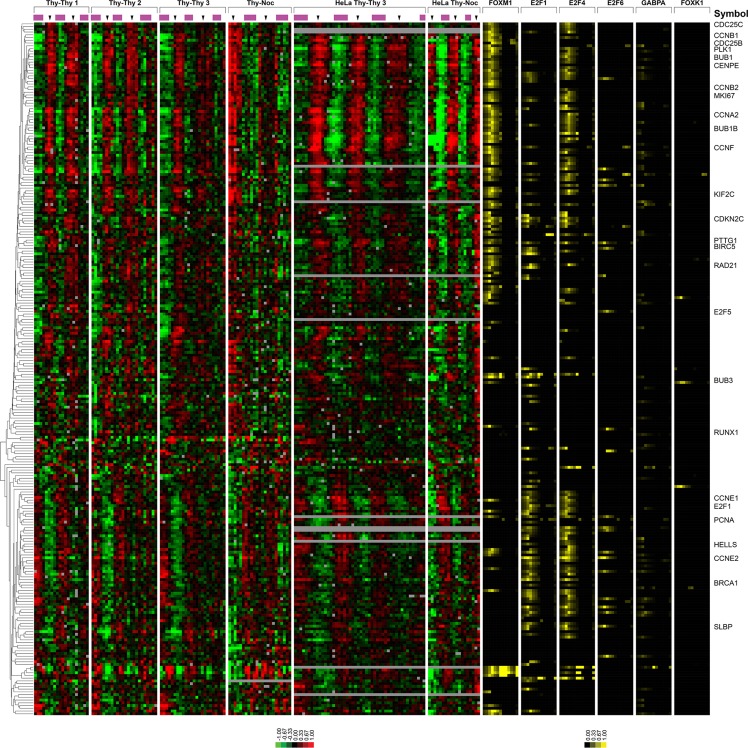
Verification
Claims the paper makes
The claims and statistics of this paper haven’t been checked yet.
Run the check — free, no account needed. It reads the open-access text and checks the sources it cites.
Claims other papers make about this one
Each is checked against this paper’s own text: does it say what the citing paper says it does?
In the citing paper
“We compared these machine-reported gene lists with four published datasets for experimentally characterized cell cycle genes (including the HeLa data we used as seeds) (Grant et al., 2013)”
From Developmental Heterogeneity of Microglia and Brain Myeloid Cells Revealed by Deep Single-Cell RNA Sequencing (2019) · cites this paper as Grant et al., 2013
Self-check
Percentages, sums and reported differences re-computed from the paper’s own numbers.
The self-check needs the paper’s full text.
Citations
Cites
2 retracted
Wang, Z. P., Banerjee, S., Kong, D., Li, Y., & Sarkar, F. H. (2007) · Cancer Research · doi:10.1158/0008-5472.can-07-1265 · Cited by 245
RetractedAhmad, A., Wang, Z. P., Kong, D., Ali, S. S., Li, Y., Banerjee, S., Raza, A., & Sarkar, F. H. (2009) · Breast Cancer Research and Treatment · doi:10.1007/s10549-009-0572-1 · Cited by 135
RetractedSystematic and integrative analysis of large gene lists using DAVID bioinformatics resources
Huang, D. W., Sherman, B. T., & Lempicki, R. A. (2009) · Nature Protocols · doi:10.1038/nprot.2008.211 · Cited by 35,890
Model-based Analysis of ChIP-Seq (MACS)
Zhang, Y., Liu, T., Meyer, C. A., Eeckhoute, J., Johnson, D. S., Bernstein, B. E., Nusbaum, C., Myers, R. M., Brown, M., Li, W., et al. (2008) · Genome Biology · doi:10.1186/gb-2008-9-9-r137 · Cited by 18,386
Cluster analysis and display of genome-wide expression patterns
Eisen, M. B., Spellman, P. T., Brown, P. O., & Botstein, D. (1998) · Proceedings of the National Academy of Sciences · doi:10.1073/pnas.95.25.14863 · Cited by 16,184
Primer3 on the WWW for General Users and for Biologist Programmers
Rozen, S., & Skaletsky, H. (2003) · Humana Press eBooks · doi:10.1385/1-59259-192-2:365 · Cited by 15,068
DAVID: Database for Annotation, Visualization, and Integrated Discovery
Dennis, G., Sherman, B. T., Hosack, D. A., Yang, J., Gao, W., Lane, H. C., & Lempicki, R. A. (2003) · Genome Biology · doi:10.1186/gb-2003-4-5-p3 · Cited by 9,327
Spellman, P. T., Sherlock, G. J., Zhang, M. Q., Iyer, V. R., Anders, K. R., Eisen, M. B., Brown, P. O., Botstein, D., & Futcher, B. (1998) · Molecular Biology of the Cell · doi:10.1091/mbc.9.12.3273 · Cited by 4,724
Self-citationMissing Value Estimation Methods for DNA Microarrays
Troyanskaya, O., Cantor, M., Sherlock, G., Brown, P., Hastie, T., Tibshirani, R., Botstein, D., & Altman, R. B. (2001) · Bioinformatics · doi:10.1093/bioinformatics/17.6.520 · Cited by 4,230
Self-citationA Genome-Wide Transcriptional Analysis of the Mitotic Cell Cycle
Cho, R. J., Campbell, M. J., Winzeler, E. A., Steinmetz, L. M., Conway, A. R., Wodicka, L. M., Wolfsberg, T. G., Gabrielian, A. E., Landsman, D., Lockhart, D. J., et al. (1998) · Molecular Cell · doi:10.1016/s1097-2765(00)80114-8 · Cited by 2,024
Research works printed but not linked: 6
- Chen W, 2011, Asian Pac J Cancer Prev, 12, 1785
- Cho RJ, 2001, Nat Genet, 27, 48
- Rozen S, 2000, Methods Mol Biol, 132, 365
- Slansky JE, 1996, Curr Top Microbiol Immunol, 208, 1
- Teh MT, 2013, Int J Cancer 132, 2095–210
- Wierstra I, 2006, Biol Chem, 387, 949
Cited by
Sorted by citations
Li, Q., Cheng, Z., Zhou, L., Darmanis, S., Neff, N. F., Okamoto, J., Gulati, G., Bennett, M. L., Sun, L. O., Clarke, L. E., et al. (2019) · Neuron · doi:10.1016/j.neuron.2018.12.006 · Cited by 1,129
Vitamin B 12 , folate, and the methionine remethylation cycle—biochemistry, pathways, and regulation
Froese, D. S., Fowler, B., & Baumgartner, M. R. (2019) · Journal of Inherited Metabolic Disease · doi:10.1002/jimd.12009 · Cited by 479
Fischer, M., Grossmann, P., Padi, M., & DeCaprio, J. A. (2016) · Nucleic Acids Research · doi:10.1093/nar/gkw523 · Cited by 330
Cell cycle transcription control: DREAM/MuvB and RB-E2F complexes.
Fischer, M., & Müller, G. A. (2017) · Critical Reviews in Biochemistry and Molecular Biology · doi:10.1080/10409238.2017.1360836 · Cited by 255
FOXM1: An emerging master regulator of DNA damage response and genotoxic agent resistance
Zona, S., Bella, L., Burton, M. J., de Moraes, G. N., & Lam, E. W. ‐. (2014) · Biochimica et Biophysica Acta (BBA) - Gene Regulatory Mechanisms · doi:10.1016/j.bbagrm.2014.09.016 · Cited by 224
Dolatabadi, S., Candia, J., Akrap, N., Vannas, C., Tomić, T. T., Losert, W., Landberg, G., Åman, P., & Ståhlberg, A. (2017) · Frontiers in Genetics · doi:10.3389/fgene.2017.00001 · Cited by 206
Cell cycle regulation of human DNA repair and chromatin remodeling genes
Mjelle, R., Hegre, S. A., Aas, P. A., Slupphaug, G., Drabløs, F., Sætrom, P., & Krokan, H. E. (2015) · DNA repair · doi:10.1016/j.dnarep.2015.03.007 · Cited by 216
Regulation of Poly(A) Tail and Translation during the Somatic Cell Cycle
Park, J.-E., Yi, H., Kim, Y., Chang, H., & Kim, V. N. (2016) · Molecular Cell · doi:10.1016/j.molcel.2016.04.007 · Cited by 202
Regulation of mRNA translation during mitosis
Tanenbaum, M. E., Stern‐Ginossar, N., Weissman, J. S., & Vale, R. D. (2015) · eLife · doi:10.7554/elife.07957 · Cited by 197
Spatiotemporal dissection of the cell cycle with single-cell proteogenomics
Mahdessian, D., Cesnik, A. J., Gnann, C., Danielsson, F., Stenström, L., Arif, M., Zhang, C., Le, T. H., Johansson, F., Schutten, R., et al. (2021) · Nature · doi:10.1038/s41586-021-03232-9 · Cited by 204
Proteomic analyses reveal distinct chromatin‐associated and soluble transcription factor complexes
Li, X., Wang, W., Wang, J., Malovannaya, A., Xi, Y., Li, W., Guerra, R., Hawke, D. H., Qin, J., & Chen, J. (2015) · Molecular Systems Biology · doi:10.15252/msb.20145504 · Cited by 160
Transcriptional landscape of the human cell cycle
Liu, Y., Chen, S., Wang, S., Soares, F., Fischer, M., Meng, F., Du, Z., Lin, C. Y., Meyer, C. A., DeCaprio, J. A., et al. (2017) · Proceedings of the National Academy of Sciences · doi:10.1073/pnas.1617636114 · Cited by 155
Lu, R. J., Taylor, S., Contrepois, K., Kim, M., Bravo, J. I., Ellenberger, M., Sampathkumar, N. K., & Benayoun, B. A. (2021) · Nature Aging · doi:10.1038/s43587-021-00086-8 · Cited by 132
FOXM1: A small fox that makes more tracks for cancer progression and metastasis
Khan, M. A., Κhan, P., Ahmad, A., Fatima, M., & Nasser, M. W. (2023) · Seminars in Cancer Biology · doi:10.1016/j.semcancer.2023.03.007 · Cited by 131
Sun, X., Clermont, P., Jiao, W., Helgason, C. D., Gout, P. W., Wang, Y. Z., & Qu, S. (2016) · International Journal of Cancer · doi:10.1002/ijc.30133 · Cited by 125
Shostak, A., Ruppert, B., Ha, N., Bruns, P., Toprak, U. H., ICGC MMML-Seq Project, Lawerenz, C., Lichter, P., Radlwimmer, B., Eils, J., et al. (2016) · Nature Communications · doi:10.1038/ncomms11807 · Cited by 120
Cell cycle regulation of folate‐mediated one‐carbon metabolism
Lan, X., Field, M. S., & Stover, P. J. (2018) · WIREs Systems Biology and Medicine · doi:10.1002/wsbm.1426 · Cited by 113
Dominguez, D., Tsai, Y., Gomez, N. C., Jha, D. K., Davis, I. J., & Wang, Z. (2016) · Cell Research · doi:10.1038/cr.2016.84 · Cited by 104
A map of protein dynamics during cell-cycle progression and cell-cycle exit
Gookin, S. E., Min, M., Phadke, H., Chung, M., Moser, J. C., Miller, I., Carter, D., & Spencer, S. L. (2017) · PLoS Biology · doi:10.1371/journal.pbio.2003268 · Cited by 103
Arceci, A., Bonacci, T., Wang, X., Stewart, K. G., Damrauer, J. S., Hoadley, K. A., & Emanuele, M. J. (2019) · Cell Reports · doi:10.1016/j.celrep.2019.02.054 · Cited by 102
The CHR site: definition and genome-wide identification of a cell cycle transcriptional element
Müller, G. A., Wintsche, A., Stangner, K., Prohaska, S. J., Stadler, P. F., & Engeland, K. (2014) · Nucleic Acids Research · doi:10.1093/nar/gku696 · Cited by 97
Michael Margaliot, A., Sontag, E. D., & Tuller, T. (2014) · PLoS ONE · doi:10.1371/journal.pone.0096039 · Cited by 80
Bonacci, T., Suzuki, A., Grant, G. D., Stanley, N., Cook, J. G., Brown, N. G., & Emanuele, M. J. (2018) · The EMBO Journal · doi:10.15252/embj.201798701 · Cited by 91
Self-citationPreparation for DNA replication: the key to a successful S phase
Limas, J. C., & Cook, J. G. (2019) · FEBS Letters · doi:10.1002/1873-3468.13619 · Cited by 88
Katzenellenbogen, B. S., Guillen, V. S., & Katzenellenbogen, J. A. (2023) · Breast Cancer Research · doi:10.1186/s13058-023-01675-8 · Cited by 88
Assembly of a parts list of the human mitotic cell cycle machinery
Giotti, B., Chen, S.-H., Barnett, M. W., Regan, T. W., Ly, T., Wiemann, S., Hume, D. A., & Freeman, T. C. (2018) · Journal of Molecular Cell Biology · doi:10.1093/jmcb/mjy063 · Cited by 85
APC/C and SCF cyclin F Constitute a Reciprocal Feedback Circuit Controlling S-Phase Entry
Choudhury, R., Bonacci, T., Arceci, A., Lahiri, D., Mills, C. A., Kernan, J. L., Branigan, T. B., DeCaprio, J. A., Burke, D. J., & Emanuele, M. J. (2016) · Cell Reports · doi:10.1016/j.celrep.2016.08.058 · Cited by 81
Discovering Biology in Periodic Data through Phase Set Enrichment Analysis (PSEA)
Zhang, R., Podtelezhnikov, A. A., Hogenesch, J. B., & Anafi, R. C. (2016) · Journal of Biological Rhythms · doi:10.1177/0748730416631895 · Cited by 77
de Moraes, G. N., Bella, L., Zona, S., Burton, M. J., & Lam, E. W. ‐. (2016) · Current Drug Targets · doi:10.2174/1389450115666141122211549 · Cited by 77
Essential role for centromeric factors following p53 loss and oncogenic transformationPreprint
Filipescu, D., Naughtin, M., Podsypanina, K., Lejour, V., Wilson, L., Gurard‐Levin, Z. A., Orsi, G. A., Simeonova, I., Toufektchan, E., Attardi, L. D., et al. (2017) · Genes & Development · doi:10.1101/gad.290924.116 · Cited by 81
Complex Cartography: Regulation of E2F Transcription Factors by Cyclin F and Ubiquitin
Emanuele, M. J., Enrico, T. P., Mouery, R. D., Wasserman, D., Nachum, S., & Tzur, A. (2020) · Trends in Cell Biology · doi:10.1016/j.tcb.2020.05.002 · Cited by 72
GABPA inhibits invasion/metastasis in papillary thyroid carcinoma by regulating DICER1 expression
Yuan, X., Mu, N., Wang, N., Strååt, K., Sofiadis, A., Guo, Y., Stenman, A., Li, K., Cheng, G., Zhang, L., et al. (2018) · Oncogene · doi:10.1038/s41388-018-0483-x · Cited by 72
E2F Transcription Factors Control the Roller Coaster Ride of Cell Cycle Gene Expression
Thurlings, I., & de Bruin, A. (2015) · Methods in molecular biology · doi:10.1007/978-1-4939-2957-3_4 · Cited by 68
Pardo, I., Lillemoe, H. A., Blosser, R. J., Choi, M.-R., Sauder, C. A. M., Doxey, D. K., Mathieson, T., Hancock, B. A., Baptiste, D. F., Atale, R. V., et al. (2014) · Breast Cancer Research · doi:10.1186/bcr3627 · Cited by 61
Identification of Drivers of Aneuploidy in Breast Tumors
Pfister, K. E., Pipka, J. L., Chiang, C., Liu, Y., Clark, R. A., Keller, R. E., Skoglund, P., Guertin, M. J., Hall, I. M., & Stukenberg, P. T. (2018) · Cell Reports · doi:10.1016/j.celrep.2018.04.102 · Cited by 65
Pham, T. H., Page, Y. L., Percevault, F., Ferrière, F., Flouriot, G., & Pakdel, F. (2021) · International Journal of Molecular Sciences · doi:10.3390/ijms22010470 · Cited by 62
Who guards the guardian? Mechanisms that restrain APC/C during the cell cycle
Kernan, J. L., Bonacci, T., & Emanuele, M. J. (2018) · Biochimica et Biophysica Acta (BBA) - Molecular Cell Research · doi:10.1016/j.bbamcr.2018.09.011 · Cited by 67
Thiru, P., Kern, D. M., McKinley, K. L., Monda, J. K., Rago, F., Su, K.-C., Tsinman, T. K., Yarar, D., Bell, G. W., & Cheeseman, I. M. (2014) · Molecular Biology of the Cell · doi:10.1091/mbc.e14-03-0837 · Cited by 55
The Emerging Roles of Forkhead Box (FOX) Proteins in Osteosarcoma
Zhang, W., Duan, N., Song, T., Li, Z., Zhang, C., & Chen, X. (2017) · Journal of Cancer · doi:10.7150/jca.18778 · Cited by 52
Kelliher, C., Leman, A. R., Sierra, C. S., & Haase, S. B. (2016) · PLoS Genetics · doi:10.1371/journal.pgen.1006453 · Cited by 49
Inhibition of CDK4/6 as a novel therapeutic option for neuroblastoma
Rihani, A., Vandesompele, J., Speleman, F., & Maerken, T. V. (2015) · Cancer Cell International · doi:10.1186/s12935-015-0224-y · Cited by 52
CINSARC signature as a prognostic marker for clinical outcome in sarcomas and beyond
Chibon, F., Lesluyes, T., Valentin, T., & Guellec, S. L. (2018) · Genes Chromosomes and Cancer · doi:10.1002/gcc.22703 · Cited by 55
Temporal separation of replication and transcription during S-phase progression
Meryet‐Figuière, M., Alaei-Mahabadi, B., Ali, M. M., Mitra, S., Subhash, S., Pandey, G. K., Larsson, E., & Kanduri, C. (2014) · Cell Cycle · doi:10.4161/15384101.2014.953876 · Cited by 48
Single cell transcriptomics reveals unanticipated features of early hematopoietic precursors
Yang, J., Tanaka, Y., Seay, M., Li, Z., Jin, J., Garmire, L. X., Zhu, X., Taylor, A., Li, W., Euskirchen, G. M., et al. (2016) · Nucleic Acids Research · doi:10.1093/nar/gkw1214 · Cited by 42
Filho, R. A. E.-A., Nicolas, A., Castro, T. L. D. P., Deplanche, M., Azevedo, V., Goossens, P. L., Taieb, F. E., Lina, G., Loir, Y. L., & Berkova, N. (2017) · Frontiers in Cellular and Infection Microbiology · doi:10.3389/fcimb.2017.00208 · Cited by 55
Retinoic acid regulates cell cycle genes and accelerates normal mouse liver regeneration
Liu, H., Ly, I., Hu, Y. C., & Wan, Y. Y. (2014) · Biochemical Pharmacology · doi:10.1016/j.bcp.2014.07.003 · Cited by 46
Expression of HSF2 decreases in mitosis to enable stress-inducible transcription and cell survival
Elsing, A. N., Aspelin, C., Björk, J., Bergman, H., Himanen, S. V., Kallio, M. J., Roos‐Mattjus, P., & Sistonen, L. (2014) · The Journal of Cell Biology · doi:10.1083/jcb.201402002 · Cited by 46
Krenning, L., Sonneveld, S., & Tanenbaum, M. E. (2022) · eLife · doi:10.7554/elife.71356 · Cited by 41
Roçi, I., Watrous, J. D., Lagerborg, K. A., Lafranchi, L., Lindqvist, A., Jain, M., & Nilsson, R. (2019) · Cell Reports · doi:10.1016/j.celrep.2019.01.059 · Cited by 44
Chen, F., Bai, G., Li, Y., Feng, Y., & Wang, L. (2017) · PubMed Central · Cited by 43
Tyrosine Threonine Kinase Inhibition Eliminates Lung Cancers by Augmenting Apoptosis and Polyploidy
Zheng, L., Chen, Z., Kawakami, M., Chen, Y., Roszik, J., Mustachio, L. M., Kurie, J. M., Villalobos, P. A., Lü, W., Behrens, C., et al. (2019) · Molecular Cancer Therapeutics · doi:10.1158/1535-7163.mct-18-0864 · Cited by 42
Wang, X., Arceci, A., Bird, K. E., Mills, C. A., Choudhury, R., Kernan, J. L., Zhou, C., Bae-Jump, V. L., Bowers, A. A., & Emanuele, M. J. (2017) · Molecular and Cellular Biology · doi:10.1128/mcb.00609-16 · Cited by 42
Enigmatic MELK: The controversy surrounding its complex role in cancer
McDonald, I. M., & Graves, L. M. (2020) · Journal of Biological Chemistry · doi:10.1074/jbc.rev120.013433 · Cited by 44
Proteome-scale movements and compartment connectivity during the eukaryotic cell cycle
Litsios, A., Grys, B., Kraus, O. Z., Friesen, H., Ross, C., Masinas, M. P. D., Forster, D. T., Couvillion, M., Timmermann, S., Billmann, M., et al. (2024) · Cell · doi:10.1016/j.cell.2024.02.014 · Cited by 45
Regulation of human genome expression and RNA splicing by human papillomavirus 16 E2 protein
Gauson, E. J., Windle, B., Donaldson, M., Caffarel, M. M., Dornan, E. S., Coleman, N., Herzyk, P., Henderson, S. C., Wang, X., & Morgan, I. M. (2014) · Virology · doi:10.1016/j.virol.2014.07.022 · Cited by 39
Aswad, L., Yenamandra, S. P., Ow, G. S., Grinchuk, O. V., Ivshina, A. V., & Kuznetsov, V. A. (2015) · Oncotarget · doi:10.18632/oncotarget.5543 · Cited by 35
Meta-analysis reveals conserved cell cycle transcriptional network across multiple human cell types
Giotti, B., Joshi, A., & Freeman, T. C. (2017) · BMC Genomics · doi:10.1186/s12864-016-3435-2 · Cited by 35
Chromosome Missegregation as a Modulator of Radiation Sensitivity
Cosper, P. F., Copeland, S. E., Tucker, J. B., & Weaver, B. A. A. (2021) · Seminars in Radiation Oncology · doi:10.1016/j.semradonc.2021.09.002 · Cited by 34
Rizzardi, L. F., Coleman, K. E., Varma, D., Matson, J. P., Oh, S., & Cook, J. G. (2014) · Journal of Biological Chemistry · doi:10.1074/jbc.m114.614701 · Cited by 34
Garg, A., Futcher, B., & Leatherwood, J. (2015) · Nucleic Acids Research · doi:10.1093/nar/gkv274 · Cited by 34
Sokolova, M., Turunen, M. M., Mortusewicz, O., Kivioja, T., Herr, P., Vähärautio, A., Björklund, M., Taipale, M., Helleday, T., & Taipale, J. (2016) · Cell Cycle · doi:10.1080/15384101.2016.1261765 · Cited by 32
Wiseman, E. F., Chen, X. X., Han, N., Webber, A., Ji, Z., Sharrocks, A. D., & Ang, Y. S. (2015) · Molecular Cancer · doi:10.1186/s12943-015-0339-8 · Cited by 32
Unbiased Boolean analysis of public gene expression data for cell cycle gene identification
Dabydeen, S. A., Desai, A. B., & Sahoo, D. (2019) · Molecular Biology of the Cell · doi:10.1091/mbc.e19-01-0013 · Cited by 28
Higareda‐Almaraz, J. C., Ruiz-Moreno, J. S., Klimentová, J., Barbieri, D., Salvador-Gallego, R., Ly, R., Valtierra-Gutiérrez, I. A., Dinsart, C., Rabinovich, G. A., Stulík, J., et al. (2016) · BMC Cancer · doi:10.1186/s12885-016-2700-8 · Cited by 31
Studying Cell Cycle-regulated Gene Expression by Two Complementary Cell Synchronization Protocols
Apraiz, A., Mitxelena, J., & Zubiaga, A. M. (2017) · Journal of Visualized Experiments · doi:10.3791/55745 · Cited by 31
Otto, J., Verwaayen, A., Penners, C., Hundertmark, J., Lin, C., Kallen, C., Paffen, D., Otto, T., Berger, H., Tacke, F., et al. (2023) · Cell Death and Disease · doi:10.1038/s41419-023-06077-4 · Cited by 29
Benanti, J. A. (2015) · Current Genetics · doi:10.1007/s00294-015-0535-5 · Cited by 30
Intuyod, K., Saavedra-García, P., Zona, S., Lai, C., Jiramongkol, Y., Vaeteewoottacharn, K., Pairojkul, C., Yao, S. J., Yong, J.-S., Trakansuebkul, S., et al. (2018) · Cell Death and Disease · doi:10.1038/s41419-018-1235-0 · Cited by 29
RetractedThe p21CIP1-CDK4-DREAM axis is a master regulator of genotoxic stress-induced cellular senescence
Schmidt, A., Allmann, S., Schwarzenbach, C., Snyder, P., Chen, J., Nagel, G., Schöneis, A., Rasenberger, B., Beli, P., Loewer, A., et al. (2024) · Nucleic Acids Research · doi:10.1093/nar/gkae426 · Cited by 29
RNA sequencing identifies crucial genes in papillary thyroid carcinoma (PTC) progression
Qiu, J., Zhang, W., Xia, Q., Liu, F., Li, L., Zhao, S., Gao, X., Zang, C., Ge, R., & Sun, Y. (2015) · Experimental and Molecular Pathology · doi:10.1016/j.yexmp.2015.12.011 · Cited by 28
Layers of regulation of cell-cycle gene expression in the budding yeastSaccharomyces cerevisiae
Kelliher, C., Foster, M. W., Motta, F. C., Deckard, A., Soderblom, E. J., Moseley, M. A., & Haase, S. B. (2018) · Molecular Biology of the Cell · doi:10.1091/mbc.e18-04-0255 · Cited by 24
McDonald, I. M., Grant, G. D., East, M. P., Gilbert, T. S. K., Wilkerson, E., Goldfarb, D., Beri, J., Herring, L. E., Vaziri, C., Cook, J. G., et al. (2020) · Journal of Biological Chemistry · doi:10.1074/jbc.ra119.011083 · Cited by 29
Self-citationYadav, A. K., & Polášek-Sedláčková, H. (2024) · Communications Biology · doi:10.1038/s42003-024-05855-w · Cited by 28
The Temporal Regulation of S Phase Proteins During G1
Grant, G. D., & Cook, J. G. (2017) · Advances in experimental medicine and biology · doi:10.1007/978-981-10-6955-0_16 · Cited by 26
Self-citationBodrug, T., Welsh, K. A., Hinkle, M., Emanuele, M. J., & Brown, N. G. (2021) · Frontiers in Cell and Developmental Biology · doi:10.3389/fcell.2021.687515 · Cited by 27
Martín, E., Vivori, C., Rogalska, M. E., Herrero-Vicente, J., & Valcárcel, J. (2021) · RNA · doi:10.1261/rna.078935.121 · Cited by 27
Asthana, A., Ramanan, P., Hirschi, A., Guiley, K. Z., Wijeratne, T. U., Shelansky, R. I., Doody, M. J., Narasimhan, H., Boeger, H., Tripathi, S. M., et al. (2022) · Nature Communications · doi:10.1038/s41467-022-28094-1 · Cited by 25
Chávez, S. S., Eastman, G., Smircich, P., Becco, L., Oliveira‐Rizzo, C., Fort, R. S., Potenza, M., Garat, B., Sotelo-Silveira, J. R., & Duhagon, M. A. (2017) · PLoS ONE · doi:10.1371/journal.pone.0188441 · Cited by 24
Rega, C., Tsitsa, I., Roumeliotis, T. I., Krystkowiak, I., Portillo, M. G., Yu, L., Vorhauser, J., Pines, J., Mansfeld, J., Choudhary, J. S., et al. (2025) · Nature Communications · doi:10.1038/s41467-025-57537-8 · Cited by 22
Vashisth, M., Cho, S., Irianto, J., Xia, Y., Wang, M., Hayes, B. H., Wieland, D. R., Wells, R. G., Jafarpour, F., Liu, A. J., et al. (2021) · Proceedings of the National Academy of Sciences · doi:10.1073/pnas.2112940118 · Cited by 25
Franks, J. L., Martinez‐Chacin, R. C., Wang, X., Tiedemann, R. L., Bonacci, T., Choudhury, R., Bolhuis, D. L., Enrico, T. P., Mouery, R. D., Damrauer, J. S., et al. (2020) · PLoS Biology · doi:10.1371/journal.pbio.3000975 · Cited by 22
FOXM1 expression in rhabdomyosarcoma: a novel prognostic factor and therapeutic target
Kuda, M., Kohashi, K., Yamada, Y., Maekawa, A., Kinoshita, Y., Nakatsura, T., Iwamoto, Y., Taguchi, T., & Oda, Y. (2015) · Tumor Biology · doi:10.1007/s13277-015-4351-9 · Cited by 22
Roubtsova, A., Garçon, D., Lacoste, S., Chamberland, A., Marcinkiewicz, J., Métivier, R., Sotin, T., Paquette, M., Bernard, S., Cariou, B., et al. (2022) · Biochimica et Biophysica Acta (BBA) - Molecular and Cell Biology of Lipids · doi:10.1016/j.bbalip.2022.159217 · Cited by 22
Schwarzenbach, C., Rinke, J., Vilar, J. B., Sallbach, J., Tatsch, L., Schmidt, A., Schöneis, A., Rasenberger, B., Kaina, B., Tomicic, M. T., et al. (2025) · Cell Death and Disease · doi:10.1038/s41419-025-07651-8 · Cited by 24
Maekawa, A., Kohashi, K., Kuda, M., Iura, K., Ishii, T., Endo, M., Nakatsura, T., Iwamoto, Y., & Oda, Y. (2016) · BMC Cancer · doi:10.1186/s12885-016-2542-4 · Cited by 21
Pease, L. I., Clegg, P., Proctor, C. J., Shanley, D. P., Cockell, S., & Peffers, M. J. (2017) · Scientific Reports · doi:10.1038/s41598-017-14650-z · Cited by 22
Aristizábal-Corrales, D., Yang, J., & Li, F. (2019) · Genetics · doi:10.1534/genetics.118.301745 · Cited by 20
S-phase Enriched Non-coding RNAs Regulate Gene Expression and Cell Cycle Progression
Yıldırım, Ö., Izgü, E. Ç., Damle, M., Chalei, V., Ji, F., Sadreyev, R. I., Szostak, J. W., & Kingston, R. E. (2020) · Cell Reports · doi:10.1016/j.celrep.2020.107629 · Cited by 22
Transcriptomic Characterization of the Human Cell Cycle in Individual Unsynchronized Cells
Karlsson, J. W., Kroneis, T., Jonasson, E., Larsson, E., & Ståhlberg, A. (2017) · Journal of Molecular Biology · doi:10.1016/j.jmb.2017.10.011 · Cited by 18
Separase Inhibitor Sepin-1 Inhibits Foxm1 Expression and Breast Cancer Cell Growth
Zhang, N., & Pati, D. (2018) · Journal of Cancer Science & Therapy · doi:10.4172/1948-5956.1000517 · Cited by 19
Cell Type Specific Alterations in Interchromosomal Networks across the Cell Cycle
Fritz, A. J., Stojkovic, B., Ding, H., Xu, J., Bhattacharya, S., & Berezney, R. (2014) · PLoS Computational Biology · doi:10.1371/journal.pcbi.1003857 · Cited by 18
Personalized Network Modeling of the Pan-Cancer Patient and Cell Line Interactome
Bhattacharyya, R., Ha, M. J., Liu, Q., Akbani, R., Liang, H., & Baladandayuthapani, V. (2020) · JCO Clinical Cancer Informatics · doi:10.1200/cci.19.00140 · Cited by 18
Zheng, Y., Dubois, W., Benham, C. J., Batchelor, E., & Levens, D. (2020) · Communications Biology · doi:10.1038/s42003-020-01264-x · Cited by 17
The human ion channel TRPM2 modulates cell survival in neuroblastoma through E2F1 and FOXM1
Hirschler‐Laszkiewicz, I., Festa, F., Huang, S., Moldovan, G., Nicolae, C. M., Dhoonmoon, A., Bao, L., Keefer, K. A., Chen, S., Wang, H., et al. (2022) · Scientific Reports · doi:10.1038/s41598-022-10385-8 · Cited by 17
Qu, S., Ci, X., Xue, H., Dong, X., Hao, J., Lin, D., Clermont, P., Wu, R. C., Collins, C. C., Gout, P. W., et al. (2018) · British Journal of Cancer · doi:10.1038/bjc.2017.474 · Cited by 18
Li, Y., Liu, M., Zhai, Z., Deng, L., Lv, X., Liu, H., Wang, Y., Zhang, C., Xiong, J., & Shi, C. (2021) · Frontiers in Cell and Developmental Biology · doi:10.3389/fcell.2021.688798 · Cited by 16
Structure and function of MuvB complexes
Müller, G. A., Asthana, A., & Rubin, S. M. (2022) · Oncogene · doi:10.1038/s41388-022-02321-x · Cited by 17
Context-dependent CpG methylation directs cell-specific binding of transcription factor ZBTB38
Marchal, C., Defossez, P., & Miotto, B. (2022) · Epigenetics · doi:10.1080/15592294.2022.2111135 · Cited by 17
Zhang, L., Cervantes, M. D., Pan, S., Lindsley, J., Dabney, A. R., & Kapler, G. M. (2022) · Molecular Biology of the Cell · doi:10.1091/mbc.e22-08-0326 · Cited by 13
Abundance of d ‐2‐hydroxyglutarate in G2/M is determined by FOXM1 in mutant IDH1‐expressing cells
Kancharana, B., Katragunta, K., Sarma, U. M., & Jain, N. (2019) · FEBS Letters · doi:10.1002/1873-3468.13500 · Cited by 16
Metadata
- Authors
- Grant, G. D., Brooks, L., Zhang, X., Mahoney, J. M., Martyanov, V., Wood, T. A., Sherlock, G., Cheng, C., & Whitfield, M. L.
- Affiliations
- Dartmouth College (US)
- Stanford Medicine (US)
- Corresponding author
- Whitfield, Michael L.
- ORCID
- Venue
- Molecular Biology of the Cell
- Published
- 2013-12
- Volume
- 24
- Issue
- 23
- Pages
- 3634-3650
- ISSN
- 1059-1524 (ISSN-L)
- 1939-4586
- PMC
- PMC3842991
- OpenAlex
- W2102123859
- Cited by
- 179
- References
- 92
- Citations by year
- 2026: 5 · 2025: 11 · 2024: 13 · 2023: 6 · 2022: 10 · 2021: 21 · 2020: 19 · 2019: 17 · 2018: 14 · 2017: 20 · 2016: 17 · 2015: 14 · 2014: 12
- FWCI
- 6.42
- Type
- journal article
- Language
- en
- Open access
- green
- www.ncbi.nlm.nih.gov
- Licence
- cc-by-nc-sa
- Locations
- Molecular Biology of the Cell (publishedVersion)
- Europe PMC (PubMed Central) (publishedVersion, cc-by-nc-sa)
- PubMed Central (publishedVersion, cc-by-nc-sa)
- PubMed (publishedVersion)
- Funders
- Foundation for the National Institutes of Health
- V Foundation for Cancer Research
- National Human Genome Research Institute (R01HG004499)
- National Cancer Institute (R25CA134286, R01CA130795)
- Topics
- Life Sciences › Biochemistry, Genetics and Molecular Biology › Molecular Biology › Genomics and Chromatin Dynamics
- Health Sciences › Medicine › Oncology › Cancer-related Molecular Pathways
- Life Sciences › Biochemistry, Genetics and Molecular Biology › Molecular Biology › Gene Regulatory Network Analysis
- Keywords
- cell cycle-regulated genes, periodic gene expression, FOXM1, E2F transcription factors, G2/M phase, S phase, osteosarcoma, U2OS cells, transcriptional regulation, DREAM complex, GABPA, E2F1, E2F4, E2F6, promoter activation
- MeSH terms
- Forkhead Box Protein M1, Cell Cycle, Multigene Family, HeLa Cells, Humans, Protein Binding, RNA, Messenger, Time Factors, Transcription, Genetic, Protein Biosynthesis, Gene Expression Regulation, Neoplastic, Genes, cdc, Gene Expression Profiling, Chromatin Immunoprecipitation, E2F Transcription Factors, Forkhead Transcription Factors
About these checks
Registry, retraction, Cites and statistics results are computed, not judged, with one exception: a printed reference that no index lists is read once by a model before it counts as a citation error. Claims are extracted by a model and kept only when their quote appears verbatim in the text; each cited source is then checked, with a model’s help, for whether it says what the claim relies on. Those verdicts can be wrong — read the claim’s quote and the cited source before relying on one.
Statistics and arithmetic are recomputed, not judged.
Confidence bands are shown only for fields calibrated on our annotated test set. None is calibrated yet, so no band is shown.
What counts as a claim ›How we measure confidence ›How we check this ›
Are you an author, or do you see a problem with this page? Request a review
