

SPRING: a kinetic interface for visualizing high dimensional single-cell expression data
Open accessPublished version of a preprint
The DOI matches its Crossref record; 11 of the 11 references it cites were found in a registry or an index.
Abstract
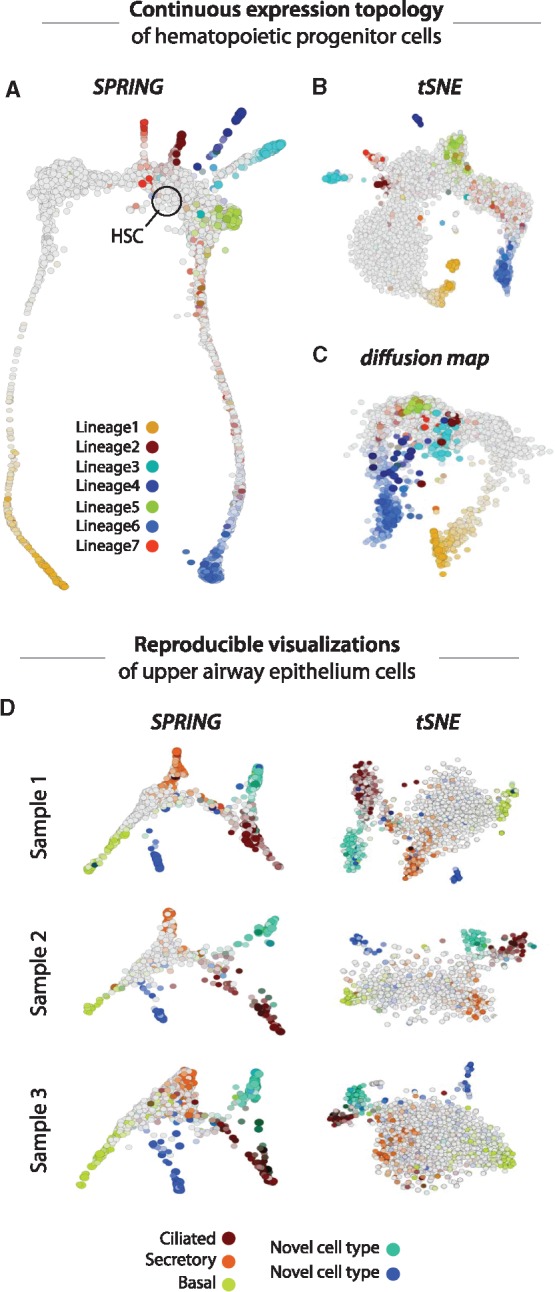
Motivation: Single-cell gene expression profiling technologies can map the cell states in a tissue or organism. As these technologies become more common, there is a need for computational tools to explore the data they produce. In particular, visualizing continuous gene expression topologies can be improved, since current tools tend to fragment gene expression continua or capture only limited features of complex population topologies. Results: Force-directed layouts of k-nearest-neighbor graphs can visualize continuous gene expression topologies in a manner that preserves high-dimensional relationships and captures complex population topologies. We describe SPRING, a pipeline for data filtering, normalization and visualization using force-directed layouts and show that it reveals more detailed biological relationships than existing approaches when applied to branching gene expression trajectories from hematopoietic progenitor cells and cells of the upper airway epithelium. Visualizations from SPRING are also more reproducible than those of stochastic visualization methods such as tSNE, a state-of-the-art tool. We provide SPRING as an interactive web-tool with an easy to use GUI. Availability and implementation: https://kleintools.hms.harvard.edu/tools/spring.html, https://github.com/AllonKleinLab/SPRING/. Supplementary information: Supplementary data are available at Bioinformatics online.
Overview
The claims and statistics of this paper haven’t been checked yet.
Free: it reads the open-access text and checks the first 5 claims that cite a source we can check. Create a free account to check every claim.
Integrity signals
Registry
Cites
Statistics
Figures
Verification
Claims the paper makes
The claims and statistics of this paper haven’t been checked yet.
Free: it reads the open-access text and checks the first 5 claims that cite a source we can check. Create a free account to check every claim.
Claims other papers make about this one
Each is checked against this paper’s own text: does it say what the citing paper says it does?
The source backs part of the claim, not all of it — or backs it for a different population, condition or comparison.
In the citing paper
“We begin by modeling the cellular transcriptomic state space as a smooth, low-dimensional manifold or set of manifolds.”
From Quantifying the effect of experimental perturbations at single-cell resolution (2021) · cites this paper as [2]
Experimental — accuracy not yet measuredIn the citing paper
“Force-directed graph-based methods have previously been used to examine lineage relationships in single cell data (Weinreb et al., 2018).”
From Single-Cell Analysis of Regional Differences in Adult V-SVZ Neural Stem Cell Lineages (2019) · cites this paper as Weinreb et al., 2018
In the citing paper
“For example, Weinreb et al (2018) used a simple extension of CPM that excludes genes that account for at least 5% of the total counts in any cell, when calculating their size factors.”
From Current best practices in single-cell RNA-seq analysis: a tutorial (2019) · cites this paper as Weinreb et al, 2018
Self-check
Percentages, sums and reported differences re-computed from the paper’s own numbers.
The self-check needs the paper’s full text.
Citations
Cites
Droplet barcoding for single-cell transcriptomics applied to embryonic stem cells
Klein, A. M., Mazutis, L., Akartuna, I., Tallapragada, N., Veres, A., Li, V., Peshkin, L., Weitz, D. A., & Kirschner, M. W. (2015) · Cell · doi:10.1016/j.cell.2015.04.044 · Cited by 3,356
Self-citationJacomy, M., Venturini, T., Heymann, S., & Bastian, M. (2014) · PLoS ONE · doi:10.1371/journal.pone.0098679 · Cited by 2,909
Data-Driven Phenotypic Dissection of AML Reveals Progenitor-like Cells that Correlate with Prognosis
Levine, J. H., Simonds, E. F., Bendall, S. C., Davis, K. L., Amir, E.-A. D., Tadmor, M. D., Litvin, O., Fienberg, H. G., Jager, A., Zunder, E. R., et al. (2015) · Cell · doi:10.1016/j.cell.2015.05.047 · Cited by 2,303
Amir, E.-A. D., Davis, K. L., Tadmor, M. D., Simonds, E. F., Levine, J. H., Bendall, S. C., Shenfeld, D. K., Krishnaswamy, S., Nolan, G. P., & Pe'er, D. (2013) · Nature Biotechnology · doi:10.1038/nbt.2594 · Cited by 1,550
Characterization of the single-cell transcriptional landscape by highly multiplex RNA-seq
Islam, S., Kjällquist, U., Moliner, A., Zajac, P., Fan, J.-B., Lönnerberg, P., & Linnarsson, S. (2011) · Genome Research · doi:10.1101/gr.110882.110 · Cited by 949
Bendall, S. C., Davis, K. L., Amir, E.-A. D., Tadmor, M. D., Simonds, E. F., Chen, T. J., Shenfeld, D. K., Nolan, G. P., & Pe’er, D. (2014) · Cell · doi:10.1016/j.cell.2014.04.005 · Cited by 906
Defining cell types and states with single-cell genomics
Trapnell, C. (2015) · Genome Research · doi:10.1101/gr.190595.115 · Cited by 813
Diffusion maps for high-dimensional single-cell analysis of differentiation data
Haghverdi, L., Buettner, F., & Theis, F. J. (2015) · Bioinformatics · doi:10.1093/bioinformatics/btv325 · Cited by 649
Identification of cell types from single-cell transcriptomes using a novel clustering method
Xu, C., & Su, Z. (2015) · Bioinformatics · doi:10.1093/bioinformatics/btv088 · Cited by 559
Wishbone identifies bifurcating developmental trajectories from single-cell data
Setty, M., Tadmor, M. D., Reich-Zeliger, S., Angel, O., Salame, T. M., Kathail, P., Choi, K., Bendall, S., Friedman, N., & Pe'er, D. (2016) · Nature Biotechnology · doi:10.1038/nbt.3569 · Cited by 558
Cited by
Items 201–300 of 325
Gafranek, J. T., D’Aniello, E., Ravisankar, P., Thakkar, K., Vagnozzi, R. J., Lim, H., Salomonis, N., & Waxman, J. S. (2023) · Nature Communications · doi:10.1038/s41467-023-41184-y · Cited by 10
Thorsson, H., Henningsson, R., Puente‐Moncada, N., Peña‐Martínez, P., Sjöström, L., Ågerstam, H., Sandén, C., Rissler, M., Castor, A., Marquart, H. V., et al. (2024) · Blood · doi:10.1182/blood.2023021705 · Cited by 10
An, S., Ma, L., & Wan, L. (2019) · BMC Genomics · doi:10.1186/s12864-019-5477-8 · Cited by 10
Mondal, A. K., Asnani, H., Singla, P., & Prathosh, A. P. (2021) · IEEE Transactions on Computational Biology and Bioinformatics · doi:10.1109/tcbb.2021.3098394 · Cited by 10
Palo: spatially aware color palette optimization for single-cell and spatial data
Hou, W., & Ji, Z. (2022) · Bioinformatics · doi:10.1093/bioinformatics/btac368 · Cited by 10
Visualizing High-Dimensional Single-Cell RNA-seq Data via Random Projections and Geodesic Distances
Vrahatis, A. G., Tasoulis, S. K., Dimitrakopoulos, G. Ν., & Plagianakos, V. P. (2019) · IEEE Conference on Computational Intelligence in Bioinformatics and Computational Biology (CIBCB) · doi:10.1109/cibcb.2019.8791482 · Cited by 10
Robust And Scalable Learning Of Complex Dataset Topologies Via ElpigraphPreprint
Albergante, L., Mirkes, E. M., Chen, H., Martin, A., Faure, L., Barillot, E., Pinello, L., Gorban, A. N., & Zinovyev, A. Y. (2018) · arXiv (Cornell University) · doi:10.48550/arxiv.1804.07580 · Cited by 10
Multiscale Organization of Neural Networks in a 3D Bioprinted Matrix
Yang, H., Zhang, J., Li, Y., Zhong, Z., Li, W., Luo, H., Liu, Y., Ouyang, L., Jiang, Z., Sun, Y., et al. (2025) · Advanced Science · doi:10.1002/advs.202504455 · Cited by 9
The AML cellular state space unveils NPM1 immune evasion subtypes with distinct clinical outcomes
Lilljebjörn, H., Peña‐Martínez, P., Thorsson, H., Henningsson, R., Rissler, M., Landberg, N., Puente‐Moncada, N., von Palffy, S., Rissler, V., Staněk, P., et al. (2025) · Nature Communications · doi:10.1038/s41467-025-66546-6 · Cited by 9
Activation of NLRP3 Inflammasome by Virus-Like Particles of Human Polyomaviruses in Macrophages
Lučiūnaitė, A., Dalgėdienė, I., Žilionis, R., Mašalaitė, K., Norkienė, M., Šinkūnas, A., Gedvilaitė, A., Kučinskaitė-Kodzė, I., & Žvirblienė, A. (2022) · Frontiers in Immunology · doi:10.3389/fimmu.2022.831815 · Cited by 9
Mathematics of neural stem cells: Linking data and processes
Danciu, D.-P., Hooli, J., Martín-Villalba, A., & Marciniak-Czochra, A. K. (2023) · Cells and Development · doi:10.1016/j.cdev.2023.203849 · Cited by 9
Du, Y., Gao, X., Chen, J., Chen, X., Liu, H., He, W.-G., Liu, L., Jiang, Y., He, B., Deng, Z., et al. (2024) · Journal of Orthopaedic Translation · doi:10.1016/j.jot.2024.10.004 · Cited by 8
Hu, H., Ng, T. S. C., Kang, M., Scott, E., Li, R., Quintana, J. M., Matvey, D., Vantaku, V. R., Weissleder, R., Parangi, S., et al. (2023) · Clinical Cancer Research · doi:10.1158/1078-0432.ccr-22-2976 · Cited by 8
Dong, Z., Chen, X., Li, Y., Zhuo, R., Lai, X., & Liu, M. (2021) · Frontiers in Cell and Developmental Biology · doi:10.3389/fcell.2020.593234 · Cited by 8
Grubman, A., Choo, X. Y., Chew, G., Ouyang, J. F., Sun, G., Croft, N. P., Rossello, F. J., Simmons, R., Buckberry, S., Landin, D. V., et al. (2019) · doi:10.1101/639054 · Cited by 7
Single-cell and spatial transcriptomics in endocrine research
Matsumoto, R., & Yamamoto, T. (2024) · Endocrine Journal · doi:10.1507/endocrj.ej23-0457 · Cited by 7
Single-cell transcriptome defines cell-type repertoire of adult Daphnia magna
Krishnan, I., Yampolsky, L. Y., Petrova, K., & Peshkin, L. (2025) · Genetics · doi:10.1093/genetics/iyaf234 · Cited by 7
Klein, S. L., Tavares, A. L. P., Peterson, M. C., Sullivan, C. H., & Moody, S. A. (2022) · Frontiers in Cell and Developmental Biology · doi:10.3389/fcell.2022.786052 · Cited by 7
Ngn2 induces diverse neuronal lineages from human pluripotencyPreprint
Lin, H., He, Z., Ebert, S., Schörnig, M., Santel, M., Weigert, A., Hevers, W., Kasri, N. N., Taverna, E., Camp, J. G., et al. (2020) · bioRxiv (Cold Spring Harbor Laboratory) · doi:10.1101/2020.11.19.389445 · Cited by 7
Hanson-Drury, S., Patni, A. P., Lee, D. L., Alghadeer, A., Zhao, Y. T., Ehnes, D. D., Vo, V. N., Kim, S. Y., Jithendra, D., Phal, A., et al. (2023) · Frontiers in Dental Medicine · doi:10.3389/fdmed.2023.1209503 · Cited by 6
Transcriptomic responses of lung mesenchymal cells during pneumonia
Soucy, A. M., Brune, J. E., Jayaraman, A., Shenoy, A. T., Korkmaz, F. T., Etesami, N. S., Hiller, B. E., Martin, I. M. C., Goltry, W. N., Ha, C. T., et al. (2025) · JCI Insight · doi:10.1172/jci.insight.177084 · Cited by 6
CytoAnalyst web platform facilitates comprehensive single cell RNA sequencing analysis
Bya, P., Tran, D., Nguyen, K., Drăghici, S., & Nguyen, T. (2025) · Scientific Reports · doi:10.1038/s41598-025-14398-x · Cited by 6
Shetty, A. V., Steer, C. J., & Low, W. C. (2025) · Communications Biology · doi:10.1038/s42003-025-08694-5 · Cited by 6
GRACE: a comprehensive web-based platform for integrative single-cell transcriptome analysis
Yu, H., Wang, Y., Zhang, X., & Wang, Z. (2022) · NAR Genomics and Bioinformatics · doi:10.1093/nargab/lqad050 · Cited by 6
Gene regulatory network inference during cell fate decisions by perturbation strategies
Hu, Q., Lu, X., Xue, Z., & Wang, R. (2025) · npj Systems Biology and Applications · doi:10.1038/s41540-025-00504-2 · Cited by 6
Attributed Graph Force Learning
Sun, K., Xia, F., Liu, J., Xu, B., Saikrishna, V., & Aggarwal, C. C. (2022) · IEEE Transactions on Neural Networks and Learning Systems · doi:10.1109/tnnls.2022.3221100 · Cited by 6
Enabling single-cell trajectory network enrichment
Grønning, A. G. B., Oubounyt, M., Kanev, K., Lund, J., Kacprowski, T., Zehn, D., Röttger, R., & Baumbach, J. (2021) · Nature Computational Science · doi:10.1038/s43588-021-00025-y · Cited by 6
Mikami, T., Kato, I., Nishimura, A., Eguchi‐Ishimae, M., Kamitori, T., Tasaka, K., Kubota, H., Isobe, T., Uchihara, Y., Namikawa, Y., et al. (2025) · Nature Communications · doi:10.1038/s41467-025-63271-y · Cited by 5
Myeloid/natural killer (NK) cell precursor acute leukemia as a distinct leukemia type
Nishimura, A., Yokoyama, K., Naruto, T., Yamagishi, C., Imamura, T., Nakazono, H., Kimura, S., Ito, M., Sagisaka, M., Tanaka, Y., et al. (2023) · Science Advances · doi:10.1126/sciadv.adj4407 · Cited by 5
A cell type annotation Jamboree—Revival of а communal science forum
Peshkin, L., & Kirschner, M. W. (2020) · genesis · doi:10.1002/dvg.23383 · Cited by 5
Díaz, I., Enguita, J. M., González, A., García, D., Cuadrado, A. A., Chiara, M., & Valdés, N. (2020) · Bioinformatics · doi:10.1093/bioinformatics/btaa989 · Cited by 5
Differential contribution of P73+ Cajal-Retzius cells and Reelin to cortical morphogenesis
Elorriaga, V., Bouloudi, B., Saillour, Y., Morel, J. S., Delberghe, E., Azzam, P., Moreau, M. X., Stottmann, R. W., Bahi‐Buisson, N., Pierani, A., et al. (2025) · Development · doi:10.1242/dev.204451 · Cited by 4
CellRank: consistent and data view agnostic fate mapping for single-cell genomics
Weiler, P., & Theis, F. J. (2026) · Nature Protocols · doi:10.1038/s41596-025-01314-w · Cited by 4
Hill-Terán, G., Petrich, J., Ferreyra, M. L. F., Aybar, M. J., & Coux, G. (2024) · Journal of Molecular Evolution · doi:10.1007/s00239-024-10200-0 · Cited by 4
Malepathirana, T., Senanayake, D., Gautam, V., & Halgamuge, S. K. (2021) · IEEE Conference on Computational Intelligence in Bioinformatics and Computational Biology (CIBCB) · doi:10.1109/cibcb49929.2021.9562805 · Cited by 4
Single-cell RNA sequencing data analysis based on non-uniformε−neighborhood network
Jia, J., & Chen, L. (2022) · Bioinformatics · doi:10.1093/bioinformatics/btac114 · Cited by 4
Mapping Human Hematopoietic Hierarchy at Single Cell Resolution by Microwell-seqPreprint
Lai, S., Xu, Y., Huang, W., Jiang, M., Chen, H., Ye, F., Wang, R., Qiu, Y., Jiang, X., Huang, D., et al. (2017) · bioRxiv (Cold Spring Harbor Laboratory) · doi:10.1101/127217 · Cited by 4
Savova, V., Chamberlain, M., Hanamsagar, R., Nestle, F. O., & de Rinaldis, E. (2021) · Research Square · doi:10.21203/rs.3.rs-199733/v1 · Cited by 4
Growth Hormone Accelerates Recovery From Acetaminophen-Induced Murine Liver InjuryPreprint
Everton, E., del Río-Moreno, M., Villacorta-Martín, C., Bawa, P., Lindstrom-Vautrin, J., Muramatsu, H., Rizvi, F., Smith, A. R., Tam, Y. K., Pardi, N., et al. (2023) · bioRxiv (Cold Spring Harbor Laboratory) · doi:10.1101/2023.04.17.537197 · Cited by 4
The chromatin remodeling complex PRC2 safeguards cell fate in alveolar epithelial type 2 cellsPreprint
Warheit-Niemi, H. I., Huang, J., Cook, K. C. S., Alysandratos, K., Fernandes, S., Basak, P., Zhao, B., Vilker, E., Villacorta-Martín, C., Elitz, A., et al. (2026) · bioRxiv (Cold Spring Harbor Laboratory) · doi:10.64898/2026.03.03.708777 · Cited by 4
Dubnov, S., Piran, Z., Alper, A., Yefroimsky, A., Soreq, H., & Nitzan, M. (2026) · Cell Systems · doi:10.1016/j.cels.2026.101571 · Cited by 3
Cwetsch, A. W., Ferreira, S., Delberghe, E., Gilabert‐Juan, J., Moreau, M. X., Saillour, Y., García-Bolufer, P., Calvo-Parra, S., González‐Martínez, J., Massoukou, D., et al. (2026) · Development · doi:10.1242/dev.205011 · Cited by 3
MLG: multilayer graph clustering for multi-condition scRNA-seq data
Lu, S., Conn, D. J., Chen, S., Johnson, K. D., Bresnick, E. H., & Keleş, S. (2021) · Nucleic Acids Research · doi:10.1093/nar/gkab823 · Cited by 3
Fibroblastic reticular cells predict response to immune checkpoint inhibitorsPreprint
Biasci, D., Thaventhiran, J. E. D., & Tavaré, S. (2020) · bioRxiv (Cold Spring Harbor Laboratory) · doi:10.1101/2020.02.19.955666 · Cited by 3
LotOfCells: data visualization and statistics of single cell metadataPreprint
González-Velasco, Ó. (2024) · bioRxiv (Cold Spring Harbor Laboratory) · doi:10.1101/2024.05.23.595582 · Cited by 3
Winter, P. S., Ramseier, M. L., Navia, A. W., Saksena, S. D., Strouf, H., Senhaji, N., DenAdel, A., Mirza, M., An, H. H., Bilal, L. L., et al. (2024) · bioRxiv (Cold Spring Harbor Laboratory) · doi:10.1101/2024.06.06.597767 · Cited by 3
Network based simultaneous embedding of cells and marker genes from scRNA-seq studies
Bhattacharya, N., Chakraborti, S., Kumari, S., Mathew, B., Halder, A., Gujral, S., Gupta, K., Mittal, A., Sinha, D., Nelson, C. C., et al. (2025) · Briefings in Bioinformatics · doi:10.1093/bib/bbaf537 · Cited by 2
Vats, P., Baweja, B., Saini, C., Soni, S., Tungariya, T., Singh, A. P., Kumar, A., & Nema, R. (2025) · Cell Division · doi:10.1186/s13008-025-00166-w · Cited by 2
Xenbase: A Guide to the Xenopus Genetics and Genomics Knowledgebase
James‐Zorn, C., Ponferrada, V. G., & Zorn, A. M. (2026) · Methods in molecular biology · doi:10.1007/978-1-0716-5360-9_3 · Cited by 2
Bentzur, A., Alon, S., & Shohat-Ophir, G. (2022) · International Journal of Molecular Sciences · doi:10.3390/ijms23073811 · Cited by 2
Dubaissi, E., Hilton, E. N., Lilley, S. J., Collins, R. F., Holt, C., March, P., Danahay, H. L., Gosling, M., Grencis, R. K., Roberts, I. S., et al. (2024) · Scientific Reports · doi:10.1038/s41598-024-76482-y · Cited by 2
Quantifying Grain Boundary Atomic Structures Using the Smooth Overlap of Atomic Positions
Priedeman, J. L. (2018) · ScholarsArchive (Brigham Young University) · Cited by 2
Emergence of the erythroid lineage from multipotent hematopoiesisPreprint
Tusi, B. K., Wolock, S. L., Weinreb, C., Hwang, Y., Hidalgo, D., Žilionis, R., Waisman, A., Huh, J. R., Klein, A. M., & Socolovsky, M. (2018) · bioRxiv (Cold Spring Harbor Laboratory) · doi:10.1101/261941 · Cited by 2
Self-citationCortal, A. (2020) · theses.fr (ABES) · doi:10.70675/4fdd96f5z20bbz4412za122z172e9faa9dba · Cited by 2
A primer on single-cell genomics in myeloid biology
Ferchen, K., Song, B., & Grimes, H. L. (2020) · Current Opinion in Hematology · doi:10.1097/moh.0000000000000623 · Cited by 1
Ikonomou, L., Yampolskaya, M., & Mehta, P. (2023) · Advances in experimental medicine and biology · doi:10.1007/978-3-031-26625-6_4 · Cited by 1
Functional analysis of novel protein, PIERCE1, in motile ciliogenesis
Anujan, P. (2019) · White Rose eTheses Online (University of Leeds, The University of Sheffield, University of York) · Cited by 1
Kiner, E. (2019) · Digital Access to Scholarship at Harvard (DASH) (Harvard University) · Cited by 1
Big data analytics in bioinformatics
Bjørnholt), G. A. (. (2020) · Research Publications (Maastricht University) · doi:10.26481/dis.20200828ag · Cited by 1
Juliano, C. E. (2019) · Faculty Opinions – Post-Publication Peer Review of the Biomedical Literature · doi:10.3410/f.734081587.793562651 · Cited by 1
ASXL1 truncating mutations drive leukemic resistance to T cell attackPreprint
McCurry, D., Ge, Z., Lee, J., Pasumarthi, R., Leng, X., Köhnke, T., Pasvolsky, O., Raparla, P., Nguyen, V. N., Maurer, K., et al. (2025) · bioRxiv (Cold Spring Harbor Laboratory) · doi:10.1101/2025.05.29.656798 · Cited by 1
Sozzi, E., Garrote, M. G., Mudannayake, J. M., Passarello, G. R., Bruzelius, A., Corsi, S., Galeotti, G., Habekost, M., Scaramuzza, L., Kajtez, J., et al. (2025) · bioRxiv (Cold Spring Harbor Laboratory) · doi:10.64898/2025.12.19.695615 · Cited by 1
Zhao, H., & Choi, K. (2018) · bioRxiv (Cold Spring Harbor Laboratory) · doi:10.1101/374629
Liu, X., Chen, W., Li, W., Priest, J. R., Wang, J., & Zhou, Z. (2019) · SSRN Electronic Journal · doi:10.2139/ssrn.3322368
Development of novel therapeutic approaches for treatment of Alzheimer's disease
Choo, X. Y. (2018) · Minerva Access (University of Melbourne)
Sensorimotor Organoids for Neuromuscular DiseasePreprint
Pereira, J. D., Devlin, A., DuBreuil, D. M., Sapir, Y., Berezovski, E., Chander, V., & Waigner, B. (2019) · SSRN Electronic Journal · doi:10.2139/ssrn.3335779
Clonal analysis of native and malignant hematopoiesis using color barcoding in zebrafish
Henninger, J. E. (2018) · Digital Access to Scholarship at Harvard (DASH) (Harvard University)
Macrophage-mediated resistance mechanisms against MAPK inhibitory by cancer therapeutics
Wang, S. J. (2019) · DSpace@MIT (Massachusetts Institute of Technology)
Deciphering pre-leukaemic dysregulation caused by mutant C/EBPα at the level of the single cell
Qureshi, M. (2019) · Apollo (University of Cambridge) · doi:10.17863/cam.53215
Savova, V., Hanamsagar, R., Chamberlain, M., Shankara, S., Marcus, R., Baker, D. P., Klinger, K. W., Havari, E., Nestle, F. O., & de Rinaldis, E. (2021) · Research Square · doi:10.21203/rs.3.rs-199747/v2
Efeito da interleucina 17 na regulação hipotalâmica da homeostase energética
Nogueira, G. A. S. (2019) · doi:10.47749/t/unicamp.2019.1157283
Maden, M. (2018) · Faculty Opinions – Post-Publication Peer Review of the Biomedical Literature · doi:10.3410/f.734081587.793553983
Roy, S. (2021) · Faculty Opinions – Post-Publication Peer Review of the Biomedical Literature · doi:10.3410/f.739508592.793584255
Hanamsagar, R., Chamberlain, M., Shankara, S., Marcus, R. E., Baker, D. P., Havari, E., Klinger, K. W., Nestle, F. O., de Rinaldis, E., & Savova, V. (2021) · medRxiv · doi:10.1101/2021.06.21.21258814
Sosa‐Pineda, B. (2019) · Faculty Opinions – Post-Publication Peer Review of the Biomedical Literature · doi:10.3410/f.734083416.793569026
Faculty Opinions recommendation of Clonal analysis of lineage fate in native haematopoiesis.
Muñoz‐Cánoves, P. (2018) · Faculty Opinions – Post-Publication Peer Review of the Biomedical Literature · doi:10.3410/f.732417967.793549513
Savova, V., Hanamsagar, R., Chamberlain, M., Shankara, S., Marcus, R., Baker, D. P., Klinger, K. W., Havari, E., Nestle, F. O., & de Rinaldis, E. (2021) · Research Square · doi:10.21203/rs.3.rs-199747/v1
Artinger, K. (2021) · Faculty Opinions – Post-Publication Peer Review of the Biomedical Literature · doi:10.3410/f.733108089.793583884
Brain corticogenesis and cholesterol homeostasis promotes SARS-CoV-2 infection and replicationPreprint
Moon, B.-S., Ahn, D., Park, J., Nhu, T. Q., Batjargal, U., Hong, H., Yoon, S., Lee, S.-H., Yoon, G. Y., Kim, C., et al. (2023) · Research Square · doi:10.21203/rs.3.rs-2481841/v1
Pfirschke, C., Žilionis, R., Engblom, C., Messemaker, M., Zou, A. E., Rickelt, S., Gort-Freitas, N. A., Lin, Y., Bill, R., Siwicki, M. R., et al. (2023) · doi:10.1158/2326-6066.c.6550572
Self-citationAdditional file 4 of APEC: an accesson-based method for single-cell chromatin accessibility analysis
Li, B., Li, Y., Li, K., Zhu, L., Yu, Q., Cai, P., Fang, J., Zhang, W., Du, P., Chen, J., et al. (2020) · Figshare · doi:10.6084/m9.figshare.12291623
Additional file 2 of APEC: an accesson-based method for single-cell chromatin accessibility analysis
Li, B., Li, Y., Li, K., Zhu, L., Yu, Q., Cai, P., Fang, J., Zhang, W., Du, P., Chen, J., et al. (2020) · Figshare · doi:10.6084/m9.figshare.12291611
Additional file 3 of APEC: an accesson-based method for single-cell chromatin accessibility analysis
Li, B., Li, Y., Li, K., Zhu, L., Yu, Q., Cai, P., Fang, J., Zhang, W., Du, P., Jiang, C., et al. (2020) · Figshare · doi:10.6084/m9.figshare.12291614
Multiple Cell Lineages Give Rise to a Cell Type
Kondoh, H. (2024) · Results and problems in cell differentiation · doi:10.1007/978-3-031-39027-2_5
Identités et spécification des neurones de Cajal-Retzius dans le cortex murin
Moreau, M. X. (2022) · theses.fr (ABES) · doi:10.70675/bae08c46ze53bz4d26za547z0c7e6fe9d5e2
New insights into fate specification and impact of Cajal-Retzius cells on cortical development
Elorriaga, V. (2024) · theses.fr (ABES) · doi:10.70675/de756d18z5dacz40fdz81d6zf32c06eefd64
Alternative approaches to single-cell trajectory inference using a commute time matrixPreprint
Houston, D. W. (2025) · bioRxiv (Cold Spring Harbor Laboratory) · doi:10.1101/2025.02.12.635984
Repele, A., Handzlik, J. E., Samarawickrama, N., Long, T., Nooti, S. K., Potluri, V., Loh, Y. L., & Manu (2026) · PLoS Computational Biology · doi:10.1371/journal.pcbi.1014276
The molecular landscape of polycystic kidneys is marked by common alterations in purine metabolismPreprint
Decuypere, J.-P., Borràs, D., Koshy, P. J., Missiaen, L., Fieuws, S., Corthout, N., SMEDT, H. D., Monbaliu, D. R. L., Pirenne, J., Roskams, T., et al. (2025) · bioRxiv (Cold Spring Harbor Laboratory) · doi:10.1101/2025.08.07.668867
Computational methods to infer lineage decision-making in cancer using single-cell data
Setty, M. N. (2025) · Oxford University Press eBooks · doi:10.1093/med/9780192867636.003.0012
Halperin, Y., Nachmani, D., & Rabani, M. (2026) · Genome Research · doi:10.1101/gr.281411.125
Baweja, B., Vats, P., Saini, C., Kumar, A., & Nema, R. (2025) · Cell Division · doi:10.1186/s13008-025-00173-x
Additional file 5 of APEC: an accesson-based method for single-cell chromatin accessibility analysis
Li, B., Li, Y., Li, K., Zhu, L., Yu, Q., Cai, P., Fang, J., Zhang, W., Du, P., Jiang, C., et al. (2020) · Figshare · doi:10.6084/m9.figshare.12291632
Additional file 1 of Metacells untangle large and complex single-cell transcriptome networks
Bilous, M., Tran, L., Cianciaruso, C., Gabriel, A. A., Michel, H., Carmona, S. J., Pittet, M. J., & Gfeller, D. (2022) · Figshare · doi:10.6084/m9.figshare.20486722
Wolf, F., Hamey, F., Plass, M., Solana, J., Dahlin, J. S., Göttgens, B., Rajewsky, N., Simon, L., & Theis, F. (2019) · Figshare · doi:10.6084/m9.figshare.7867448
Functional analysis of human orofacial clefting genes in Xenopus laevis
Arlis, S. (2026) · Iowa Research Online (The University of Iowa) · doi:10.25820/etd.007862
Metadata
- Authors
- Weinreb, C., Wolock, S., & Klein, A. M.
- Affiliations
- Harvard University (US)
- Corresponding author
- Weinreb, Caleb
- Klein, Allon M
- Venue
- Bioinformatics
- Publisher
- Oxford University Press (OUP)
- Published
- 2017-12-07
- Volume
- 34
- Issue
- 7
- Pages
- 1246-1248
- ISSN
- 1367-4803 (ISSN-L)
- 1367-4811
- PMC
- PMC6030950
- OpenAlex
- W2952650776
- Cited by
- 298
- References
- 11
- Citations by year
- 2026: 17 · 2025: 24 · 2024: 19 · 2023: 27 · 2022: 26 · 2021: 46 · 2020: 63 · 2019: 45 · 2018: 26 · 2017: 5
- FWCI
- 15.85
- Type
- journal article
- Language
- en
- Open access
- hybrid
- doi.org
- Licence
- Locations
- Bioinformatics (publishedVersion, cc-by-nc)
- bioRxiv (Cold Spring Harbor Laboratory) (acceptedVersion)
- Europe PMC (PubMed Central) (publishedVersion, cc-by-nc)
- PubMed Central (publishedVersion, cc-by-nc)
- PubMed (publishedVersion)
- Funders
- NIH (5T32GM080177-07, 1R33CA212697)
- Topics
- Life Sciences › Biochemistry, Genetics and Molecular Biology › Molecular Biology › Single-cell and spatial transcriptomics
- Life Sciences › Biochemistry, Genetics and Molecular Biology › Molecular Biology › Gene expression and cancer classification
- Life Sciences › Biochemistry, Genetics and Molecular Biology › Molecular Biology › Gene Regulatory Network Analysis
- Keywords
- springs, single-cell gene expression, high-dimensional data visualization, force-directed layout, k-nearest neighbor graph, gene expression trajectories, hematopoietic progenitor cells, upper airway epithelium, interactive web tool
- MeSH terms
- Hematopoietic Stem Cells, Humans, Software, Cluster Analysis, Sequence Analysis, RNA, Computational Biology, Respiratory Mucosa, Gene Expression Profiling, Single-Cell Analysis
About these checks
Registry, retraction, Cites and statistics results are computed, not judged, with one exception: a printed reference that no index lists is read once by a model before it counts as a citation error. Claims are extracted by a model and kept only when their quote appears verbatim in the text; each cited source is then checked, with a model’s help, for whether it says what the claim relies on. Those verdicts can be wrong — read the claim’s quote and the cited source before relying on one.
Statistics and arithmetic are recomputed, not judged.
Confidence bands are shown only for fields calibrated on our annotated test set. None is calibrated yet, so no band is shown.
What counts as a claim ›How we measure confidence ›How we check this ›
Are you an author, or do you see a problem with this page? Request a review
Data sources
Bibliographic data: Semantic Scholar, OpenAlex, Crossref.
Contains information from the Semantic Scholar Academic Graph Datasets, made available under the ODC Attribution License (ODC-BY 1.0).
Semantic Scholar’s data is described in: Kinney, R., et al. (2023). The Semantic Scholar Open Data Platform. arXiv:2301.10140.
