

SPRING: a kinetic interface for visualizing high dimensional single-cell expression data
Open accessPublished version of a preprint
The DOI matches its Crossref record; 11 of the 11 references it cites were found in a registry or an index.
Abstract
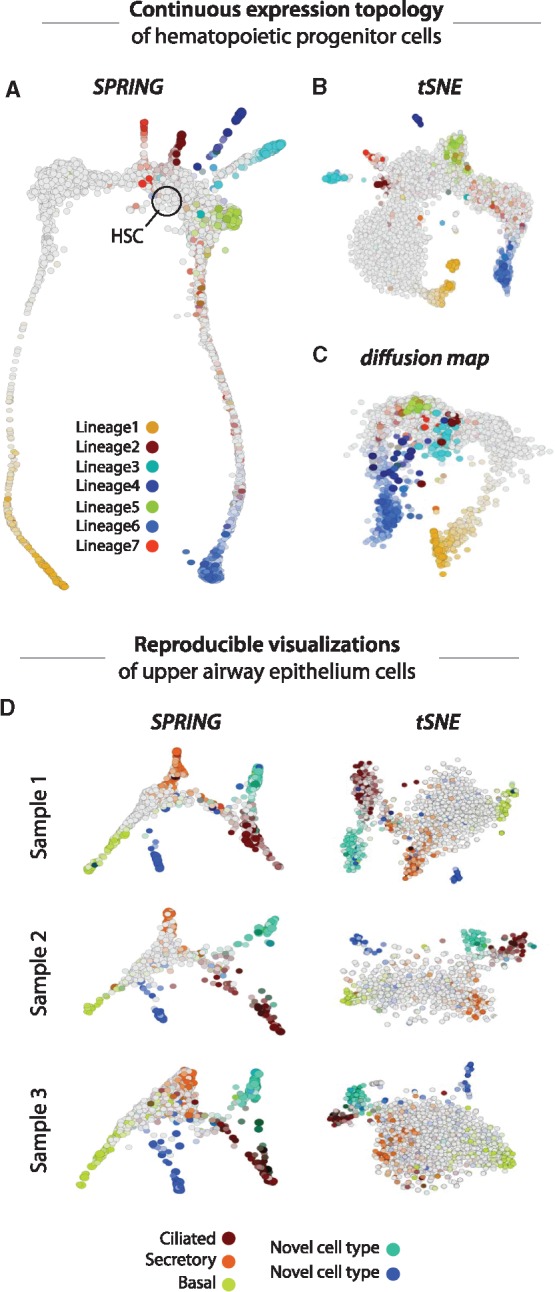
Motivation: Single-cell gene expression profiling technologies can map the cell states in a tissue or organism. As these technologies become more common, there is a need for computational tools to explore the data they produce. In particular, visualizing continuous gene expression topologies can be improved, since current tools tend to fragment gene expression continua or capture only limited features of complex population topologies. Results: Force-directed layouts of k-nearest-neighbor graphs can visualize continuous gene expression topologies in a manner that preserves high-dimensional relationships and captures complex population topologies. We describe SPRING, a pipeline for data filtering, normalization and visualization using force-directed layouts and show that it reveals more detailed biological relationships than existing approaches when applied to branching gene expression trajectories from hematopoietic progenitor cells and cells of the upper airway epithelium. Visualizations from SPRING are also more reproducible than those of stochastic visualization methods such as tSNE, a state-of-the-art tool. We provide SPRING as an interactive web-tool with an easy to use GUI. Availability and implementation: https://kleintools.hms.harvard.edu/tools/spring.html, https://github.com/AllonKleinLab/SPRING/. Supplementary information: Supplementary data are available at Bioinformatics online.
Overview
The claims and statistics of this paper haven’t been checked yet.
Free: it reads the open-access text and checks the first 5 claims that cite a source we can check. Create a free account to check every claim.
Integrity signals
Registry
Cites
Statistics
Figures
Verification
Claims the paper makes
The claims and statistics of this paper haven’t been checked yet.
Free: it reads the open-access text and checks the first 5 claims that cite a source we can check. Create a free account to check every claim.
Claims other papers make about this one
Each is checked against this paper’s own text: does it say what the citing paper says it does?
The source backs part of the claim, not all of it — or backs it for a different population, condition or comparison.
In the citing paper
“We begin by modeling the cellular transcriptomic state space as a smooth, low-dimensional manifold or set of manifolds.”
From Quantifying the effect of experimental perturbations at single-cell resolution (2021) · cites this paper as [2]
Experimental — accuracy not yet measuredIn the citing paper
“Force-directed graph-based methods have previously been used to examine lineage relationships in single cell data (Weinreb et al., 2018).”
From Single-Cell Analysis of Regional Differences in Adult V-SVZ Neural Stem Cell Lineages (2019) · cites this paper as Weinreb et al., 2018
In the citing paper
“For example, Weinreb et al (2018) used a simple extension of CPM that excludes genes that account for at least 5% of the total counts in any cell, when calculating their size factors.”
From Current best practices in single-cell RNA-seq analysis: a tutorial (2019) · cites this paper as Weinreb et al, 2018
Self-check
Percentages, sums and reported differences re-computed from the paper’s own numbers.
The self-check needs the paper’s full text.
Citations
Cites
Droplet barcoding for single-cell transcriptomics applied to embryonic stem cells
Klein, A. M., Mazutis, L., Akartuna, I., Tallapragada, N., Veres, A., Li, V., Peshkin, L., Weitz, D. A., & Kirschner, M. W. (2015) · Cell · doi:10.1016/j.cell.2015.04.044 · Cited by 3,356
Self-citationJacomy, M., Venturini, T., Heymann, S., & Bastian, M. (2014) · PLoS ONE · doi:10.1371/journal.pone.0098679 · Cited by 2,909
Data-Driven Phenotypic Dissection of AML Reveals Progenitor-like Cells that Correlate with Prognosis
Levine, J. H., Simonds, E. F., Bendall, S. C., Davis, K. L., Amir, E.-A. D., Tadmor, M. D., Litvin, O., Fienberg, H. G., Jager, A., Zunder, E. R., et al. (2015) · Cell · doi:10.1016/j.cell.2015.05.047 · Cited by 2,303
Amir, E.-A. D., Davis, K. L., Tadmor, M. D., Simonds, E. F., Levine, J. H., Bendall, S. C., Shenfeld, D. K., Krishnaswamy, S., Nolan, G. P., & Pe'er, D. (2013) · Nature Biotechnology · doi:10.1038/nbt.2594 · Cited by 1,550
Characterization of the single-cell transcriptional landscape by highly multiplex RNA-seq
Islam, S., Kjällquist, U., Moliner, A., Zajac, P., Fan, J.-B., Lönnerberg, P., & Linnarsson, S. (2011) · Genome Research · doi:10.1101/gr.110882.110 · Cited by 949
Bendall, S. C., Davis, K. L., Amir, E.-A. D., Tadmor, M. D., Simonds, E. F., Chen, T. J., Shenfeld, D. K., Nolan, G. P., & Pe’er, D. (2014) · Cell · doi:10.1016/j.cell.2014.04.005 · Cited by 906
Defining cell types and states with single-cell genomics
Trapnell, C. (2015) · Genome Research · doi:10.1101/gr.190595.115 · Cited by 813
Diffusion maps for high-dimensional single-cell analysis of differentiation data
Haghverdi, L., Buettner, F., & Theis, F. J. (2015) · Bioinformatics · doi:10.1093/bioinformatics/btv325 · Cited by 649
Identification of cell types from single-cell transcriptomes using a novel clustering method
Xu, C., & Su, Z. (2015) · Bioinformatics · doi:10.1093/bioinformatics/btv088 · Cited by 559
Wishbone identifies bifurcating developmental trajectories from single-cell data
Setty, M., Tadmor, M. D., Reich-Zeliger, S., Angel, O., Salame, T. M., Kathail, P., Choi, K., Bendall, S., Friedman, N., & Pe'er, D. (2016) · Nature Biotechnology · doi:10.1038/nbt.3569 · Cited by 558
Automated mapping of phenotype space with single-cell data
Samusik, N., Good, Z., Spitzer, M. H., Davis, K. L., & Nolan, G. P. (2016) · Nature Methods · doi:10.1038/nmeth.3863 · Cited by 419
Cited by
SCANPY: large-scale single-cell gene expression data analysis
Wolf, F. A., Angerer, P., & Theis, F. J. (2018) · Genome Biology · doi:10.1186/s13059-017-1382-0 · Cited by 8,881
Scrublet: computational identification of cell doublets in single-cell transcriptomic data
Wolock, S. L., Lopez, R., & Klein, A. M. (2019) · Cell Systems · doi:10.1016/j.cels.2018.11.005 · Cited by 2,758
Self-citationCurrent best practices in single-cell RNA-seq analysis: a tutorial
Luecken, M. D., & Theis, F. J. (2019) · Molecular Systems Biology · doi:10.15252/msb.20188746 · Cited by 2,231
Wolf, F. A., Hamey, F. K., Plass, M., Solana, J., Dahlin, J. S., Göttgens, B., Rajewsky, N., Simon, L., & Theis, F. J. (2019) · Genome Biology · doi:10.1186/s13059-019-1663-x · Cited by 1,698
Zilionis, R., Engblom, C., Pfirschke, C., Savova, V., Zemmour, D., Saatcioglu, H. D., Krishnan, I., Maroni, G., Meyerovitz, C. V., Kerwin, C. M., et al. (2019) · Immunity · doi:10.1016/j.immuni.2019.03.009 · Cited by 1,475
Self-citation
Metadata
- Authors
- Weinreb, C., Wolock, S., & Klein, A. M.
- Affiliations
- Harvard University (US)
- Corresponding author
- Weinreb, Caleb
- Klein, Allon M
- Venue
- Bioinformatics
- Publisher
- Oxford University Press (OUP)
- Published
- 2017-12-07
- Volume
- 34
- Issue
- 7
- Pages
- 1246-1248
- ISSN
- 1367-4803 (ISSN-L)
- 1367-4811
- PMC
- PMC6030950
- OpenAlex
- W2952650776
- Cited by
- 298
- References
- 11
- Citations by year
- 2026: 17 · 2025: 24 · 2024: 19 · 2023: 27 · 2022: 26 · 2021: 46 · 2020: 63 · 2019: 45 · 2018: 26 · 2017: 5
- FWCI
- 15.85
- Type
- journal article
- Language
- en
- Open access
- hybrid
- doi.org
- Licence
- Locations
- Bioinformatics (publishedVersion, cc-by-nc)
- bioRxiv (Cold Spring Harbor Laboratory) (acceptedVersion)
- Europe PMC (PubMed Central) (publishedVersion, cc-by-nc)
- PubMed Central (publishedVersion, cc-by-nc)
- PubMed (publishedVersion)
- Funders
- NIH (5T32GM080177-07, 1R33CA212697)
- Topics
- Life Sciences › Biochemistry, Genetics and Molecular Biology › Molecular Biology › Single-cell and spatial transcriptomics
- Life Sciences › Biochemistry, Genetics and Molecular Biology › Molecular Biology › Gene expression and cancer classification
- Life Sciences › Biochemistry, Genetics and Molecular Biology › Molecular Biology › Gene Regulatory Network Analysis
- Keywords
- springs, single-cell gene expression, high-dimensional data visualization, force-directed layout, k-nearest neighbor graph, gene expression trajectories, hematopoietic progenitor cells, upper airway epithelium, interactive web tool
- MeSH terms
- Hematopoietic Stem Cells, Humans, Software, Cluster Analysis, Sequence Analysis, RNA, Computational Biology, Respiratory Mucosa, Gene Expression Profiling, Single-Cell Analysis
About these checks
Registry, retraction, Cites and statistics results are computed, not judged, with one exception: a printed reference that no index lists is read once by a model before it counts as a citation error. Claims are extracted by a model and kept only when their quote appears verbatim in the text; each cited source is then checked, with a model’s help, for whether it says what the claim relies on. Those verdicts can be wrong — read the claim’s quote and the cited source before relying on one.
Statistics and arithmetic are recomputed, not judged.
Confidence bands are shown only for fields calibrated on our annotated test set. None is calibrated yet, so no band is shown.
What counts as a claim ›How we measure confidence ›How we check this ›
Are you an author, or do you see a problem with this page? Request a review
Data sources
Bibliographic data: Semantic Scholar, OpenAlex, Crossref.
Contains information from the Semantic Scholar Academic Graph Datasets, made available under the ODC Attribution License (ODC-BY 1.0).
Semantic Scholar’s data is described in: Kinney, R., et al. (2023). The Semantic Scholar Open Data Platform. arXiv:2301.10140.
