

The DOI matches its Crossref record; 52 of the 52 references it cites were found in a registry or an index.
Deep learning with multimodal representation for pancancer prognosis prediction
Open accessPublished version of a preprint
Abstract
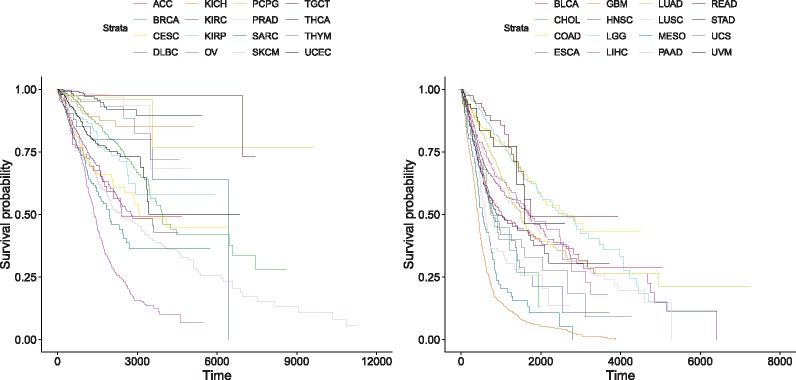
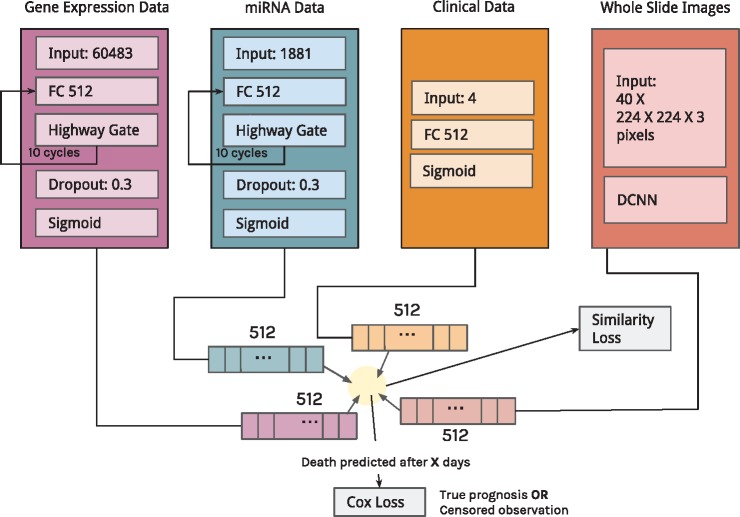
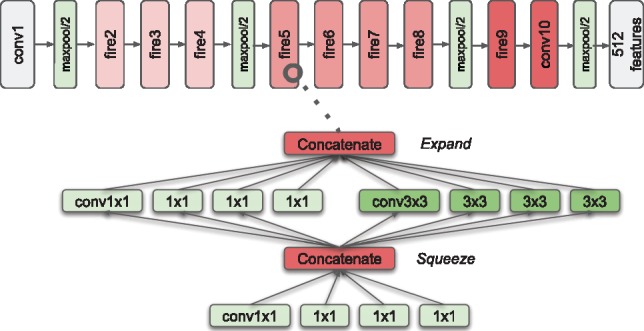
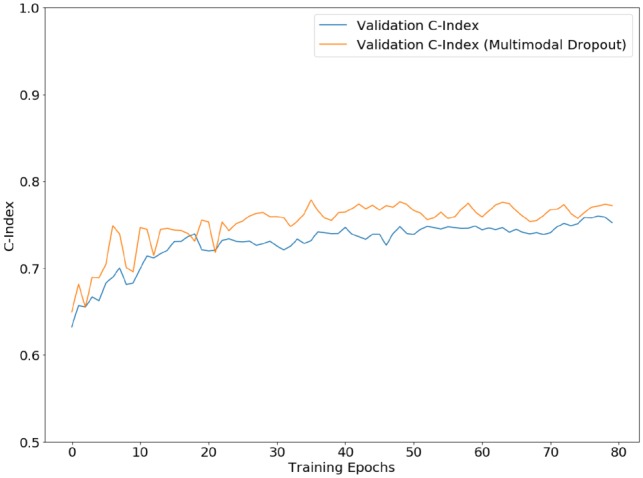
Motivation: Estimating the future course of patients with cancer lesions is invaluable to physicians; however, current clinical methods fail to effectively use the vast amount of multimodal data that is available for cancer patients. To tackle this problem, we constructed a multimodal neural network-based model to predict the survival of patients for 20 different cancer types using clinical data, mRNA expression data, microRNA expression data and histopathology whole slide images (WSIs). We developed an unsupervised encoder to compress these four data modalities into a single feature vector for each patient, handling missing data through a resilient, multimodal dropout method. Encoding methods were tailored to each data type—using deep highway networks to extract features from clinical and genomic data, and convolutional neural networks to extract features from WSIs. Results: We used pancancer data to train these feature encodings and predict single cancer and pancancer overall survival, achieving a C-index of 0.78 overall. This work shows that it is possible to build a pancancer model for prognosis that also predicts prognosis in single cancer sites. Furthermore, our model handles multiple data modalities, efficiently analyzes WSIs and represents patient multimodal data flexibly into an unsupervised, informative representation. We thus present a powerful automated tool to accurately determine prognosis, a key step towards personalized treatment for cancer patients. Availability and implementation: https://github.com/gevaertlab/MultimodalPrognosis
Overview
The claims and statistics of this paper haven’t been checked yet.
Run the check — free, no account needed. It reads the open-access text and checks the sources it cites.
Integrity signals
Registry
Cites
Statistics
Figures
Verification
Claims the paper makes
The claims and statistics of this paper haven’t been checked yet.
Run the check — free, no account needed. It reads the open-access text and checks the sources it cites.
Claims other papers make about this one
Each is checked against this paper’s own text: does it say what the citing paper says it does?
The cited source says what the claim attributes to it.
In the citing paper
“Different approaches have been proposed, such as multi-task learning [70], generative models [63] and multimodal dropout [78, 101].”
From Multimodal deep learning for biomedical data fusion: a review (2022) · cites this paper as [78]
The cited source says what the claim attributes to it.
In the citing paper
“Cheerla and Gevaert (2019) constructed a multimodal neural network-based model to predict the survival of patients for 20 different cancer types using clinical data, mRNA expression data, microRNA expression data, and histopathology whole slide images (WSIs).”
From Navigating the landscape of multimodal AI in medicine: A scoping review on technical challenges and clinical applications (2025) · cites this paper as Cheerla and Gevaert, 2019
In the citing paper
“Indeed, it has been shown that training a model on multiple tissues or cancer variants can improve detection performance for each cancer53, as many morphological features are observed across cancers from different topographies54.”
From A foundation model for clinical-grade computational pathology and rare cancers detection (2024) · cites this paper as [53]
In the citing paper
“although we posit that increased diversity helps to learn robust and rare features. Indeed, it has been shown that training a model on multiple tissues or cancer variants can improve detection performance for each cancer53, as many morphological features are observed across cancers from different topographies54.”
From A foundation model for clinical-grade computational pathology and rare cancers detection (2024) · cites this paper as [53]
Self-check
Percentages, sums and reported differences re-computed from the paper’s own numbers.
The self-check needs the paper’s full text.
Citations
Cites
LeCun, Y., Bengio, Y., & Hinton, G. (2015) · Nature · doi:10.1038/nature14539 · Cited by 84,126
ImageNet Large Scale Visual Recognition Challenge
Russakovsky, O., Deng, J., Su, H., Krause, J., Satheesh, S., Ma, S., Huang, Z., Karpathy, A., Khosla, A., Bernstein, M., et al. (2015) · International Journal of Computer Vision · doi:10.1007/s11263-015-0816-y · Cited by 39,380
(2014) · Cited by 33,419
(2008) · Journal of Machine Learning Research · Cited by 33,051
The cancer genome atlas pan-cancer analysis project
The Cancer Genome Atlas Research Network, Weinstein, J. N., Collisson, E. A., Mills, G. B., Shaw, K. R. M., Ozenberger, B. A., Ellrott, K., Shmulevich, I., Sander, C., & Stuart, J. M. (2013) · Nature Genetics · doi:10.1038/ng.2764 · Cited by 9,092
MicroRNA signatures in human cancers
Calin, G. A., & Croce, C. M. (2006) · Nature reviews. Cancer · doi:10.1038/nrc1997 · Cited by 7,668
Cox, D. R., & Oakes, D. (2018) · Chapman & Hall/CRC eBooks · doi:10.1201/9781315137438 · Cited by 6,269
SqueezeNet: AlexNet-level accuracy with 50x fewer parameters and <0.5MB model size
Iandola, F. N., Han, S., Moskewicz, M. W., Ashraf, K., Dally, W. J., & Keutzer, K. (2016) · arXiv · doi:10.48550/arxiv.1602.07360 · Cited by 6,201
Oncomirs—MicroRNAs with a role in cancer
Esquela-Kerscher, A., & Slack, F. J. (2006) · Nature Reviews Cancer · doi:10.1038/nrc1840 · Cited by 5,884
Learning a Similarity Metric Discriminatively, with Application to Face Verification
Chopra, S., Hadsell, R., & LeCun, Y. (2005) · 2005 IEEE Computer Society Conference on Computer Vision and Pattern Recognition (CVPR'05) · doi:10.1109/cvpr.2005.202 · Cited by 4,036
Research works printed but not linked: 4
- Gevaert, 2013, Pacific Symposium on Biocomputing 2013, 123
- Gevaert, 2008, Pacific Symposium on Biocomputing 2008, 279
- Momeni, 2018, International MICCAI Brainlesion Workshop, 407
- Yao, 2016, International Conference on Medical Image Computing and Computer-Assisted Intervention, 649
Cited by
Sorted by citations
Deep learning in cancer diagnosis, prognosis and treatment selection
Tran, K. A., Kondrashova, O., Bradley, A., Williams, E. D., Pearson, J. V., & Waddell, N. (2021) · Genome Medicine · doi:10.1186/s13073-021-00968-x · Cited by 932
Artificial Intelligence in Cancer Research and Precision Medicine
Bhinder, B., Gilvary, C., Madhukar, N. S., & Elemento, O. (2021) · Cancer Discovery · doi:10.1158/2159-8290.cd-21-0090 · Cited by 781
Multimodal deep learning for biomedical data fusion: a review
Stahlschmidt, S. R., Ulfenborg, B., & Synnergren, J. (2022) · Briefings in Bioinformatics · doi:10.1093/bib/bbab569 · Cited by 766
“Different approaches have been proposed, such as multi-task learning [70], generative models [63] and multimodal dropout [78, 101].”
BackgroundMethodYang, G., Ye, Q., & Xia, J. (2022) · Information Fusion · doi:10.1016/j.inffus.2021.07.016 · Cited by 717
Harnessing multimodal data integration to advance precision oncology
Boehm, K. M., Khosravi, P., Vanguri, R., Gao, J., & Shah, S. P. (2022) · Nature Reviews Cancer · doi:10.1038/s41568-021-00408-3 · Cited by 662
Pan-cancer integrative histology-genomic analysis via multimodal deep learning
Chen, R. J., Lu, M. Y., Williamson, D. F. K., Chen, T. Y., Lipkova, J., Noor, Z., Shaban, M., Shady, M., Williams, M., Joo, B., et al. (2022) · Cancer Cell · doi:10.1016/j.ccell.2022.07.004 · Cited by 660
Chen, R. J., Lu, M. Y., Wang, J., Williamson, D. F. K., Rodig, S. J., Lindeman, N. I., & Mahmood, F. (2022) · IEEE Transactions on Medical Imaging · doi:10.1109/tmi.2020.3021387 · Cited by 729
A foundation model for clinical-grade computational pathology and rare cancers detection
Vorontsov, E., Bozkurt, A., Casson, A., Shaikovski, G., Zelechowski, M., Severson, K., Zimmermann, E., Hall, J., Tenenholtz, N., Fusi, N., et al. (2024) · Nature Medicine · doi:10.1038/s41591-024-03141-0 · Cited by 572
Multimodal data fusion for cancer biomarker discovery with deep learning
Steyaert, S., Pizurica, M., Nagaraj, D., Khandelwal, P., Hernandez-Boussard, T., Gentles, A. J., & Gevaert, O. (2023) · Nature Machine Intelligence · doi:10.1038/s42256-023-00633-5 · Cited by 402
Self-citationArtificial intelligence for digital and computational pathology
Song, A. H., Jaume, G., Williamson, D. F. K., Lu, M. Y., Vaidya, A., Miller, T. R., & Mahmood, F. (2023) · Nature Reviews Bioengineering · doi:10.1038/s44222-023-00096-8 · Cited by 356
Long-term cancer survival prediction using multimodal deep learning
Vale-Silva, L. A., & Rohr, K. (2021) · Scientific Reports · doi:10.1038/s41598-021-92799-4 · Cited by 268
Applications of artificial intelligence in dentistry: A comprehensive review
Carrillo‐Pérez, F., Pecho, Ó. E., Morales, J. C., Paravina, R. D., Bona, Á. D., Ghinea, R. I., Pulgar, R., Gómez, M. D. M. P., & Herrera, L. J. (2021) · Journal of Esthetic and Restorative Dentistry · doi:10.1111/jerd.12844 · Cited by 277
Si, Y., Du, J., Li, Z., Jiang, X., Miller, T., Wang, F., Jim Zheng, W., & Roberts, K. (2021) · Journal of Biomedical Informatics · doi:10.1016/j.jbi.2020.103671 · Cited by 235
Baião, A. R., Cai, Z., Poulos, R. C., Robinson, P. J., Reddel, R. R., Zhong, Q., Vinga, S., & Gonçalves, E. (2025) · Briefings in Bioinformatics · doi:10.1093/bib/bbaf355 · Cited by 274
Deep multimodal fusion of image and non-image data in disease diagnosis and prognosis: a review
Cui, C., Yang, H., Wang, Y., Zhao, S., Asad, Z., Coburn, L. A., Wilson, K. T., Landman, B. A., & Huo, Y. (2023) · Progress in Biomedical Engineering · doi:10.1088/2516-1091/acc2fe · Cited by 256
Review of multimodal machine learning approaches in healthcare
Krones, F., Marikkar, U., Parsons, G., Szmul, A., & Mahdi, A. (2025) · Information Fusion · doi:10.1016/j.inffus.2024.102690 · Cited by 235
Integrating multi-omics data through deep learning for accurate cancer prognosis prediction
Chai, H., Zhou, X., Zhang, Z., Rao, J., Zhao, H., & Yang, Y. (2021) · Computers in Biology and Medicine · doi:10.1016/j.compbiomed.2021.104481 · Cited by 194
Applications of single-cell and bulk RNA sequencing in onco-immunology
Kuksin, M., Morel, D., Aglave, M., Danlos, F., Marabelle, A., Zinovyev, A. Y., Gautheret, D., & Verlingue, L. (2021) · European Journal of Cancer · doi:10.1016/j.ejca.2021.03.005 · Cited by 172
Jaume, G., Vaidya, A. J., Chen, R. J., Williamson, D. F. K., Liang, P. P., & Mahmood, F. (2024) · IEEE Computer Society Conference on Computer Vision and Pattern Recognition/Proceedings - IEEE Computer Society Conference on Computer Vision and Pattern Recognition/Proceedings · doi:10.1109/cvpr52733.2024.01100 · Cited by 184
An overview of deep learning methods for multimodal medical data mining
Behrad, F., & Abadeh, M. S. (2022) · Expert Systems with Applications · doi:10.1016/j.eswa.2022.117006 · Cited by 177
Wang, Z., Rui-qing, L., Wang, M., & Li, A. (2021) · Bioinformatics · doi:10.1093/bioinformatics/btab185 · Cited by 140
Cross-Modal Translation and Alignment for Survival Analysis
Zhou, F., & Chen, H. (2023) · IEEE/CVF International Conference on Computer Vision (ICCV) · doi:10.1109/iccv51070.2023.01964 · Cited by 140
Deep learning in cancer genomics and histopathology
Unger, M., & Kather, J. N. (2024) · Genome Medicine · doi:10.1186/s13073-024-01315-6 · Cited by 135
Rui-qing, L., Wu, X., Li, A., & Wang, M. (2022) · Bioinformatics · doi:10.1093/bioinformatics/btac113 · Cited by 128
Qu, H. Y., Zhou, M., Yan, Z., Wang, H., Rustgi, V. K., Zhang, S., Gevaert, O., & Metaxas, D. (2021) · npj Precision Oncology · doi:10.1038/s41698-021-00225-9 · Cited by 119
Self-citationStahlberg, E. A., Abdel‐Rahman, M. H., Aguilar, B. H., Asadpoure, A., Beckman, R. A., Borkon, L. L., Bryan, J. N., Cebulla, C. M., Chang, Y. H., Chatterjee, S., et al. (2022) · Frontiers in Digital Health · doi:10.3389/fdgth.2022.1007784 · Cited by 122
Self-citationOmiEmbed: A Unified Multi-Task Deep Learning Framework for Multi-Omics Data
Zhang, X., Xing, Y., Sun, K., & Guo, Y. (2021) · Cancers · doi:10.3390/cancers13123047 · Cited by 119
Multimodal Deep Learning Approaches for Precision Oncology: A Comprehensive Review
Yang, H., Yang, M., Chen, J., Yao, G., Zou, Q., & Jia, L. (2024) · Briefings in Bioinformatics · doi:10.1093/bib/bbae699 · Cited by 115
Schouten, D., Nicoletti, G., Dille, B., Chia, C., Vendittelli, P., Schuurmans, M., Litjens, G., & Khalili, N. (2025) · Medical Image Analysis · doi:10.1016/j.media.2025.103621 · Cited by 162
Braman, N., Gordon, J. W. H., Goossens, E. T., Willis, C., Stumpe, M. C., & Venkataraman, J. (2021) · Lecture Notes in Computer Science · doi:10.1007/978-3-030-87240-3_64 · Cited by 107
A Survey of Machine Learning Approaches Applied to Gene Expression Analysis for Cancer Prediction
Khalsan, M., Machado, L. R., Al-Shamery, E. S., Ajit, S., Anthony, K., Mu, M., & Agyeman, M. O. (2022) · IEEE Access · doi:10.1109/access.2022.3146312 · Cited by 108
Schneider, L., Laiouar-Pedari, S., Kuntz, S., Krieghoff‐Henning, E., Hekler, A., Kather, J. N., Gaiser, T., Fröhling, S., & Brinker, T. J. (2021) · European Journal of Cancer · doi:10.1016/j.ejca.2021.10.007 · Cited by 97
A meta-learning approach for genomic survival analysis
Qiu, Y. L., Zheng, H., Devos, A., Selby, H., & Gevaert, O. (2020) · Nature Communications · doi:10.1038/s41467-020-20167-3 · Cited by 96
Self-citationLi, Z., Jiang, Y., Lu, M., Li, R., & Xia, Y. (2023) · IEEE Transactions on Medical Imaging · doi:10.1109/tmi.2023.3263010 · Cited by 93
Jiang, L., Xu, C., Bai, Y., Liu, A., Gong, Y., Wang, Y., & Deng, H. (2024) · npj Precision Oncology · doi:10.1038/s41698-023-00494-6 · Cited by 89
Artificial intelligence applications in histopathology
Bahadir, C. D., Omar, M., Rosenthal, J., Marchionni, L., Liechty, B., Pisapia, D. J., & Sabuncu, M. R. (2024) · Nature Reviews Electrical Engineering · doi:10.1038/s44287-023-00012-7 · Cited by 93
Machine learning in computational histopathology: Challenges and opportunities
Cooper, M. C., Ji, Z., & Krishnan, R. G. (2023) · Genes Chromosomes and Cancer · doi:10.1002/gcc.23177 · Cited by 87
Pei, X., Zuo, K., Li, Y., & Pang, Z. (2023) · International Journal of Computational Intelligence Systems · doi:10.1007/s44196-023-00225-6 · Cited by 77
Shao, J., Ma, J., Zhang, Q., Li, W., & Wang, C. (2023) · Seminars in Cancer Biology · doi:10.1016/j.semcancer.2023.02.006 · Cited by 85
MGNN: A Multimodal Graph Neural Network for Predicting the Survival of Cancer Patients
Gao, J., Lyu, T., Xiong, F., Wang, J., Ke, W., & Li, Z. (2020) · International ACM SIGIR Conference on Research and Development in Information Retrieval (SIGIR) · doi:10.1145/3397271.3401214 · Cited by 74
Tan, K., Huang, W., Liu, X., Hu, J., & Dong, S. (2022) · Artificial Intelligence in Medicine · doi:10.1016/j.artmed.2022.102260 · Cited by 75
Hou, W., Lin, C., Yu, L., Qin, J., Yu, R., & Wang, L. (2023) · IEEE Transactions on Medical Imaging · doi:10.1109/tmi.2023.3253760 · Cited by 74
Jiang, S., Zanazzi, G. J., & Hassanpour, S. (2021) · Scientific Reports · doi:10.1038/s41598-021-95948-x · Cited by 72
Molecular Pathology of Lung CancerPreprint
Saller, J. J., & Boyle, T. A. (2021) · Cold Spring Harbor Perspectives in Medicine · doi:10.1101/cshperspect.a037812 · Cited by 83
Integrating pathomics with radiomics and genomics for cancer prognosis: A brief review
Lu, C. Y., Shiradkar, R., & Liu, Z. (2021) · Chinese Journal of Cancer Research · doi:10.21147/j.issn.1000-9604.2021.05.03 · Cited by 71
Data-Driven Modeling of Pregnancy-Related Complications
Espinosa, C. A., Becker, M., Marić, I., Wong, R. J., Shaw, G. M., Gaudilliere, B. L., Aghaeepour, N., Stevenson, D. K., Stelzer, I. A., Peterson, L. S., et al. (2021) · Trends in Molecular Medicine · doi:10.1016/j.molmed.2021.01.007 · Cited by 74
Carrillo‐Pérez, F., Morales, J. C., Castillo-Secilla, D., Gevaert, O., Rojas, I., & Herrera, L. J. (2022) · Journal of Personalized Medicine · doi:10.3390/jpm12040601 · Cited by 69
Self-citationKeyl, J., Keyl, P., Montavon, G., Hosch, R., Brehmer, A., Mochmann, L. H., Jurmeister, P. S., Dernbach, G., Kim, M., Koitka, S., et al. (2025) · Nature Cancer · doi:10.1038/s43018-024-00891-1 · Cited by 79
Combining Molecular, Imaging, and Clinical Data Analysis for Predicting Cancer Prognosis
Lobato-Delgado, B., Priego, B., & Morillo, D. (2022) · Cancers · doi:10.3390/cancers14133215 · Cited by 74
Slideflow: deep learning for digital histopathology with real-time whole-slide visualization
Dolezal, J. M., Kochanny, S. E., Dyer, E., Ramesh, S., Srisuwananukorn, A., Sacco, M., Howard, F. M., Li, A., Mohan, P., & Pearson, A. T. (2024) · BMC Bioinformatics · doi:10.1186/s12859-024-05758-x · Cited by 86
A Comprehensive Review of Deep Learning Applications with Multi-Omics Data in Cancer Research
Sartori, F., Codicè, F., Caranzano, I., Rollo, C., Birolo, G., Fariselli, P., & Pancotti, C. (2025) · Genes · doi:10.3390/genes16060648 · Cited by 78
Holste, G., Partridge, S. C., Rahbar, H., Biswas, D., Lee, C. I., & Alessio, A. M. (2021) · IEEE International Conference on Computer Vision Workshops · doi:10.1109/iccvw54120.2021.00368 · Cited by 64
Artificial intelligence in clinical research of cancers
Shao, D., Dai, Y., Li, N., Cao, X., Zhao, W., Li, C., Rong, Z., Huang, L., Wang, Y., & Zhao, J. (2021) · Briefings in Bioinformatics · doi:10.1093/bib/bbab523 · Cited by 66
From Machine Learning to Patient Outcomes: A Comprehensive Review of AI in Pancreatic Cancer
Tripathi, S., Tabari, A., Mansur, A., Dabbara, H., Bridge, C. P., & Daye, D. (2024) · Diagnostics · doi:10.3390/diagnostics14020174 · Cited by 70
Deep learning‐based microarray cancer classification and ensemble gene selection approach
Rezaee, K., Jeon, G., Khosravi, M. R., Attar, H. H., & Sabzevari, A. (2022) · IET Systems Biology · doi:10.1049/syb2.12044 · Cited by 59
Chest X-ray in Emergency Radiology: What Artificial Intelligence Applications Are Available?
Irmici, G., Cè, M., Caloro, E., Khenkina, N., Pepa, G. D., Ascenti, V., Martinenghi, C. M. A., Papa, S., Oliva, G., & Cellina, M. I. (2023) · Diagnostics · doi:10.3390/diagnostics13020216 · Cited by 63
Machine learning analysis of TCGA cancer data
Liñares-Blanco, J., Pazos, A., & Fernandez-Lozano, C. (2021) · PeerJ Computer Science · doi:10.7717/peerj-cs.584 · Cited by 63
Lv, Z., Lin, Y., Yan, R., Wang, Y., & Zhang, F. (2022) · IEEE Transactions on Computational Biology and Bioinformatics · doi:10.1109/tcbb.2022.3199244 · Cited by 57
Using mathematical modelling and AI to improve delivery and efficacy of therapies in cancer
Harkos, C., Hadjigeorgiou, A. G., Voutouri, C., Kumar, A. S., Stylianopoulos, T., & Jain, R. K. (2025) · Nature reviews. Cancer · doi:10.1038/s41568-025-00796-w · Cited by 62
A systematic analysis of deep learning in genomics and histopathology for precision oncology
Unger, M., & Kather, J. N. (2024) · BMC Medical Genomics · doi:10.1186/s12920-024-01796-9 · Cited by 62
Predicting the Survival of Cancer Patients With Multimodal Graph Neural Network
Gao, J., Lyu, T., Xiong, F., Wang, J., Ke, W., & Li, Z. (2021) · IEEE Transactions on Computational Biology and Bioinformatics · doi:10.1109/tcbb.2021.3083566 · Cited by 55
Heterogeneous Graph Learning for Multi-Modal Medical Data Analysis
Kim, S., Lee, N., Lee, J., Hyun, D., & Park, C. (2023) · Proceedings of the AAAI Conference on Artificial Intelligence · doi:10.1609/aaai.v37i4.25643 · Cited by 56
Ning, Z., Pan, W., Chen, Y., Xiao, Q., Zhang, X., Luo, J., Wang, J., & Zhang, Y. (2020) · Bioinformatics · doi:10.1093/bioinformatics/btaa056 · Cited by 53
MHAttnSurv: Multi-head attention for survival prediction using whole-slide pathology images
Jiang, S., Suriawinata, A. A., & Hassanpour, S. (2023) · Computers in Biology and Medicine · doi:10.1016/j.compbiomed.2023.106883 · Cited by 53
Mukund, A., Afridi, M. A., Karolak, A. M., Park, M. A., Permuth, J. B., & Rasool, G. (2024) · Cancers · doi:10.3390/cancers16122240 · Cited by 59
CAMR: cross-aligned multimodal representation learning for cancer survival prediction
Wu, X., Shi, Y., Wang, M., & Li, A. (2023) · Bioinformatics · doi:10.1093/bioinformatics/btad025 · Cited by 51
Fan, L., Sowmya, A., Meijering, E. H. W., & Song, Y. (2022) · IEEE Transactions on Medical Imaging · doi:10.1109/tmi.2022.3228275 · Cited by 51
Pathology-and-Genomics Multimodal Transformer for Survival Outcome Prediction
Ding, K., Zhou, M., Metaxas, D., & Zhang, S. (2023) · Lecture notes in computer science · doi:10.1007/978-3-031-43987-2_60 · Cited by 48
Kazmierski, M., Welch, M. L., Kim, S., McIntosh, C., Rey‐McIntyre, K., Huang, S. H., Patel, T., Tadic, T., Milosevic, M., Liu, F., et al. (2023) · Cancer Research Communications · doi:10.1158/2767-9764.crc-22-0152 · Cited by 46
Murthy, N. S., & Bethala, C. (2021) · Journal of Ambient Intelligence and Humanized Computing · doi:10.1007/s12652-021-03147-3 · Cited by 47
Recent Advancements in Deep Learning Using Whole Slide Imaging for Cancer Prognosis
Lee, M. (2023) · Bioengineering · doi:10.3390/bioengineering10080897 · Cited by 46
Redlich, J.-P., Feuerhake, F., Weis, J., Schaadt, N. S., Teuber‐Hanselmann, S., Buck, C., Luttmann, S., Eberle, A., Nikolin, S., Appenzeller, A., et al. (2024) · npj Imaging · doi:10.1038/s44303-024-00020-8 · Cited by 49
Addressing the Challenge of Biomedical Data Inequality: An Artificial Intelligence Perspective
Gao, Y., Sharma, T., & Cui, Y. (2023) · Annual Review of Biomedical Data Science · doi:10.1146/annurev-biodatasci-020722-020704 · Cited by 45
Breast Cancer Dataset, Classification and Detection Using Deep Learning
Iqbal, M. S., Ahmad, W., Alizadehsani, R., Hussain, S., & Rehman, R. (2022) · Healthcare · doi:10.3390/healthcare10122395 · Cited by 50
Clinically-Inspired Multi-Agent Transformers for Disease Trajectory Forecasting From Multimodal Data
Nguyen, H. H., Blaschko, M. B., Saarakkala, S. S., & Tiulpin, A. (2023) · IEEE Transactions on Medical Imaging · doi:10.1109/tmi.2023.3312524 · Cited by 43
Sato, M., Kobayashi, T., Soroida, Y., Tanaka, T., Nakatsuka, T., Nakagawa, H., Nakamura, A., Kurihara, M., Endo, M., Hikita, H., et al. (2021) · Journal of Gastroenterology and Hepatology · doi:10.1111/jgh.15763 · Cited by 40
Cui, C., Liu, H., Liu, Q., Deng, R., Asad, Z., Wang, Y., Zhao, S., Yang, H., Landman, B. A., & Huo, Y. (2022) · Lecture notes in computer science · doi:10.1007/978-3-031-16443-9_60 · Cited by 42
Multimodal Integration in Health Care: Development With Applications in Disease Management
Hao, Y., Cheng, C., Li, J., Li, H., Di, X., Zeng, X., Jin, S., Han, X., Liu, C., Wang, Q., et al. (2025) · Journal of Medical Internet Research · doi:10.2196/76557 · Cited by 44
Artificial intelligence and digital pathology: Opportunities and implications for immuno-oncology
Sobhani, F., Robinson, R., Hamidinekoo, A., Roxanis, I., Somaiah, N., & Yuan, Y. (2021) · Biochimica et Biophysica Acta (BBA) - Reviews on Cancer · doi:10.1016/j.bbcan.2021.188520 · Cited by 41
He, B., Wang, L., Zhou, W., Liu, H., Wang, Y., Lv, K., & He, K. (2025) · Scientific Reports · doi:10.1038/s41598-025-91420-2 · Cited by 42
Whole slide images reflect DNA methylation patterns of human tumors
Zheng, H., Momeni, A., Cedoz, P.-L., Vogel, H. S., & Gevaert, O. (2020) · npj Genomic Medicine · doi:10.1038/s41525-020-0120-9 · Cited by 41
Self-citationDeep learning-based advances and applications for single-cell RNA-sequencing data analysis
Bao, S., Li, K., Yan, C., Zhang, Z., Qu, J., & Zhou, M. (2021) · Briefings in Bioinformatics · doi:10.1093/bib/bbab473 · Cited by 40
Carrillo-Perez, F., Pizurica, M., Zheng, Y., Nandi, T. N., Madduri, R., Shen, J., & Gevaert, O. (2024) · Nature Biomedical Engineering · doi:10.1038/s41551-024-01193-8 · Cited by 37
Self-citationKumar, A., Nashte, A., Amit, R. P., & Choudhary, C. (2023) · International Conference on Image Information Processing (ICIIP) · doi:10.1109/iciip61524.2023.10537751 · Cited by 37
A machine learning approach for multimodal data fusion for survival prediction in cancer patients
Νικολάου, Ν., Salazar, D., RaviPrakash, H., Gonçalves, M., Mulla, R., Burlutskiy, N., Markuzon, N., & Jacob, E. (2025) · npj Precision Oncology · doi:10.1038/s41698-025-00917-6 · Cited by 49
A Review of Fusion Methods for Omics and Imaging Data
Huang, W., Tan, K., Zhang, Z., Hu, J., & Dong, S. (2022) · IEEE Transactions on Computational Biology and Bioinformatics · doi:10.1109/tcbb.2022.3143900 · Cited by 38
D’Souza, N. S., Wang, H., Giovannini, A. A., Foncubierta–Rodríguez, A., Beck, K. L., Boyko, O. B., & Syeda-Mahmood, T. F. (2023) · Medical Image Analysis · doi:10.1016/j.media.2023.103064 · Cited by 36
Pancancer outcome prediction via a unified weakly supervised deep learning model
Yuan, W. Q., Chen, Y. M., Zhu, B., Yang, S., Zhang, J., Mao, N., Xiang, J., Ji, Y., Ji, Y., Luo, X., et al. (2025) · Signal Transduction and Targeted Therapy · doi:10.1038/s41392-025-02374-w · Cited by 42
Zhan, X., Humbert‐Droz, M., Mukherjee, P., & Gevaert, O. (2021) · Patterns · doi:10.1016/j.patter.2021.100289 · Cited by 37
Self-citationWang, Z., Lin, R., Li, Y., Zeng, J., Chen, Y., Ouyang, W., Li, H., Jia, X., Lai, Z., Yu, Y., et al. (2024) · Precision Clinical Medicine · doi:10.1093/pcmedi/pbae012 · Cited by 44
Pan-Cancer Prognosis Prediction Using Multimodal Deep Learning
Silva, L. A. V., & Rohr, K. (2020) · IEEE International Symposium on Biomedical Imaging (ISBI) · doi:10.1109/isbi45749.2020.9098665 · Cited by 35
Bhattacharya, M., Jain, S., & Prasanna, P. (2022) · Lecture notes in computer science · doi:10.1007/978-3-031-19803-8_40 · Cited by 35
Qiu, L., Zhao, L., Hou, R., Zhao, W., Zhang, S., Lin, Z., Teng, H., & Zhao, J. (2023) · Computerized Medical Imaging and Graphics · doi:10.1016/j.compmedimag.2022.102176 · Cited by 35
A novel liver cancer diagnosis method based on patient similarity network and DenseGCN
Zhang, G., Peng, Z., Yan, C., Wang, J., Luo, J., & Luo, H. (2022) · Scientific Reports · doi:10.1038/s41598-022-10441-3 · Cited by 34
Liu, H., Shi, Y., Li, A., & Wang, M. (2023) · Computers in Biology and Medicine · doi:10.1016/j.compbiomed.2023.107796 · Cited by 37
Application of artificial intelligence in cancer diagnosis and tumor nanomedicine
Wang, J., Liu, G., Zhou, C. P., Cui, X., Wang, W., Wang, J., Huang, Y., Jiang, J., Wang, Z., Tang, Z., et al. (2024) · Nanoscale · doi:10.1039/d4nr01832j · Cited by 35
Liu, H., Fan, Y., Li, H., Wang, J., Hu, D., Cui, C., Lee, H. H., Zhang, H., & Oğuz, İ. (2022) · Lecture notes in computer science · doi:10.1007/978-3-031-16443-9_43 · Cited by 32
Liu, Y., Zhu, K., Peng, W., Liu, Z., & Mao, X. (2026) · Signal Transduction and Targeted Therapy · doi:10.1038/s41392-026-02631-6 · Cited by 36
Kim, Y., Park, J. Y., Hwang, E. J., Lee, S. M., & Park, C. M. (2021) · Journal of Thoracic Disease · doi:10.21037/jtd-21-1342 · Cited by 31
Progress on deep learning in digital pathology of breast cancer: a narrative review
Zhu, J., Liu, M., & Li, X. (2022) · Gland Surgery · doi:10.21037/gs-22-11 · Cited by 33
Metadata
- Authors
- Cheerla, A., & Gevaert, O.
- Affiliations
- Monta Vista High School, Cupertino, CA, USA
- Stanford University (US)
- Corresponding author
- Gevaert, Olivier
- ORCID
- Gevaert, Olivier
- Venue
- Bioinformatics
- Publisher
- Oxford University Press (OUP)
- Published
- 2019-07
- Volume
- 35
- Issue
- 14
- Pages
- i446-i454
- ISSN
- 1367-4803 (ISSN-L)
- 1367-4811
- PMC
- PMC6612862
- OpenAlex
- W2954499361
- Cited by
- 421
- References
- 52
- Citations by year
- 2026: 69 · 2025: 74 · 2024: 68 · 2023: 64 · 2022: 59 · 2021: 69 · 2020: 17 · 2019: 1
- FWCI
- 16.65
- Type
- journal article
- Language
- en
- Open access
- hybrid
- doi.org
- Licence
- Locations
- Bioinformatics (publishedVersion, cc-by-nc)
- bioRxiv (Cold Spring Harbor Laboratory) (acceptedVersion, cc-by-nc-nd)
- Europe PMC (PubMed Central) (publishedVersion, cc-by-nc)
- PubMed Central (publishedVersion, cc-by-nc)
- PubMed (publishedVersion)
- Funders
- National Institutes of Health (R01EB020527)
- National Institute of Dental and Craniofacial Research (U01DE025188)
- National Cancer Institute (U01CA199241, U01CA217851)
- Topics
- Physical Sciences › Computer Science › Artificial Intelligence › AI in cancer detection
- Health Sciences › Medicine › Radiology, Nuclear Medicine and Imaging › Radiomics and Machine Learning in Medical Imaging
- Physical Sciences › Computer Science › Artificial Intelligence › Machine Learning in Healthcare
- Keywords
- cancer prognosis prediction, pan-cancer analysis, multimodal data integration, overall survival prediction, clinical data, mRNA expression, microRNA expression, convolutional neural networks, missing data handling, precision oncology
- MeSH terms
- Deep Learning, Humans, Neoplasms, Neural Networks, Computer, Genome
About these checks
Registry, retraction, Cites and statistics results are computed, not judged, with one exception: a printed reference that no index lists is read once by a model before it counts as a citation error. Claims are extracted by a model and kept only when their quote appears verbatim in the text; each cited source is then checked, with a model’s help, for whether it says what the claim relies on. Those verdicts can be wrong — read the claim’s quote and the cited source before relying on one.
Statistics and arithmetic are recomputed, not judged.
Confidence bands are shown only for fields calibrated on our annotated test set. None is calibrated yet, so no band is shown.
What counts as a claim ›How we measure confidence ›How we check this ›
Are you an author, or do you see a problem with this page? Request a review
