

Stimulating at the right time: phase-specific deep brain stimulation
Open accessThe DOI matches its Crossref record; 56 of the 56 references it cites were found in a registry or an index.
Abstract
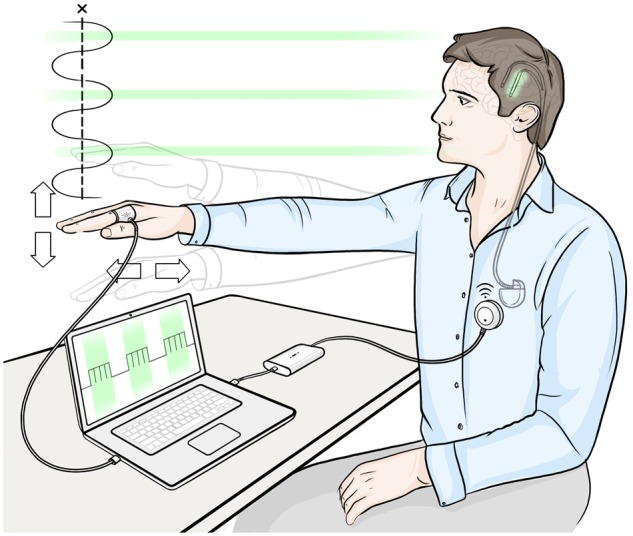
SEE MOLL AND ENGEL DOI101093/AWW308 FOR A SCIENTIFIC COMMENTARY ON THIS ARTICLE: Brain regions dynamically engage and disengage with one another to execute everyday actions from movement to decision making. Pathologies such as Parkinson's disease and tremor emerge when brain regions controlling movement cannot readily decouple, compromising motor function. Here, we propose a novel stimulation strategy that selectively regulates neural synchrony through phase-specific stimulation. We demonstrate for the first time the therapeutic potential of such a stimulation strategy for the treatment of patients with pathological tremor. Symptom suppression is achieved by delivering stimulation to the ventrolateral thalamus, timed according to the patient's tremor rhythm. Sustained locking of deep brain stimulation to a particular phase of tremor afforded clinically significant tremor relief (up to 87% tremor suppression) in selected patients with essential tremor despite delivering less than half the energy of conventional high frequency stimulation. Phase-specific stimulation efficacy depended on the resonant characteristics of the underlying tremor network. Selective regulation of neural synchrony through phase-locked stimulation has the potential to both increase the efficiency of therapy and to minimize stimulation-induced side effects.
Overview
The claims and statistics of this paper haven’t been checked yet.
Free: it reads the open-access text and checks the first 5 claims that cite a source we can check. Create a free account to check every claim.
Integrity signals
Registry
Cites
Statistics
Figures


Verification
Claims the paper makes
The claims and statistics of this paper haven’t been checked yet.
Free: it reads the open-access text and checks the first 5 claims that cite a source we can check. Create a free account to check every claim.
Claims other papers make about this one
Each is checked against this paper’s own text: does it say what the citing paper says it does?
The cited source doesn’t support the claim as written.
In the citing paper
“Some existing studies have used wearable inertial sensors [7], surface electromyography (EMG) [8], or electrocorticography (ECoG) recorded from a Neurosciences strip of intracranial electrodes implanted over the surface of the motor cortex [9] to provide feedback for the control of the stimulator in closed-loop DBS systems.”
From Closed-loop DBS triggered by real-time movement and tremor decoding based on thalamic LFPs for essential tremor (2020) · cites this paper as [7]
Checked by a reasoning model — may be wrong.
Experimental — accuracy not yet measuredThe source backs part of the claim, not all of it — or backs it for a different population, condition or comparison.
In the citing paper
“However, all these solutions require external sensors and/or additional invasive recording, which constrains their clinical application in the treatment of ET.”
From Closed-loop DBS triggered by real-time movement and tremor decoding based on thalamic LFPs for essential tremor (2020) · cites this paper as [7]
Experimental — accuracy not yet measuredThe source backs part of the claim, not all of it — or backs it for a different population, condition or comparison.
In the citing paper
“or by associating the brain stimulation to specific phases of patients’ tremor activity (Cagnan et al., 2017).”
From Toward a personalized closed-loop stimulation of the visual cortex: Advances and challenges (2022) · cites this paper as Cagnan et al., 2017
Experimental — accuracy not yet measured
Self-check
Percentages, sums and reported differences re-computed from the paper’s own numbers.
The self-check needs the paper’s full text.
Citations
Cites
The Organization of Behavior; A Neuropsychological Theory.
Attneave, F., B., M., & Hebb, D. O. (1950) · The American Journal of Psychology · doi:10.2307/1418888 · Cited by 5,146
A mechanism for cognitive dynamics: neuronal communication through neuronal coherence.
Fries, P. (2005) · Trends in Cognitive Sciences · doi:10.1016/j.tics.2005.08.011 · Cited by 4,284 · cited 3×
“Realigning median stimulation phase-amplitude relationships derived from each case such that 0 would correspond to the stimulation phase that gave rise to the greatest tremor suppression, we tested whether different stimulation phases induced the same effect on tremor severity.”
BackgroundMethodLong-term suppression of tremor by chronic stimulation of the ventral intermediate thalamic nucleus
Benabid, A. L., Pollak, P., Hoffmann, D., Gervason, C., Hommel, M., Perret, J. E., de Rougemont, J., & Gao, D. M. (1991) · The Lancet · doi:10.1016/0140-6736(91)91175-t · Cited by 1,787
Adaptive deep brain stimulation in advanced Parkinson disease.
Little, S., Pogosyan, A., Neal, S., Zavala, B., Zrinzo, L., Hariz, M., Foltynie, T., Limousin, P., Ashkan, K., FitzGerald, J., et al. (2013) · Annals of Neurology · doi:10.1002/ana.23951 · Cited by 1,374 · cited 3×
“When a certain tremor phase was detected, a TTL pulse was sent to either an externalized stimulator (for the externalized patients) (Little et al., 2013) or to the Nexus-D (for the chronically implanted patients) (Cagnan et al.”
BackgroundMethodSelf-citationModulation of Neuronal Interactions Through Neuronal Synchronization
Womelsdorf, T., Schoffelen, J.-M., Oostenveld, R., Singer, W., Desimone, R., Engel, A. K., & Fries, P. (2007) · Science · doi:10.1126/science.1139597 · Cited by 1,367
Bilateral deep brain stimulation in Parkinson's disease: a multicentre study with 4 years follow-up
Rodriguez-Oroz, M. C., Obeso, J. A., Lang, A. E., Houeto, J.-L., Pollak, P., Rehncrona, S., Kulisevsky, J., Albanese, A., Volkmann, J., Hariz, M. I., et al. (2005) · Brain · doi:10.1093/brain/awh571 · Cited by 1,057
Self-citationType I membranes, phase resetting curves, and synchrony
Ermentrout, B. (1996) · Neural Computation · doi:10.1162/neco.1996.8.5.979 · Cited by 1,001
Stimulation of the Subthalamic Nucleus Changes the Firing Pattern of Pallidal Neurons
Hashimoto, T., Elder, C. M., Okun, M. S., Patrick, S. K., & Vitek, J. L. (2003) · The Journal of Neuroscience · doi:10.1523/jneurosci.23-05-01916.2003 · Cited by 879
Uncovering the mechanism(s) of action of deep brain stimulation: activation, inhibition, or both
McIntyre, C. C., Savasta, M., Kerkerian-Le Goff, L., & Vitek, J. L. (2004) · Clinical Neurophysiology · doi:10.1016/j.clinph.2003.12.024 · Cited by 741
Deep-Brain Stimulation for Parkinson's Disease
Okun, M. S. (2012) · New England Journal of Medicine · doi:10.1056/nejmct1208070 · Cited by 541
History, Applications, and Mechanisms of Deep Brain Stimulation
Miocinovic, S., Somayajula, S., Chitnis, S., & Vitek, J. L. (2013) · JAMA Neurology · doi:10.1001/2013.jamaneurol.45 · Cited by 496
The olivo-cerebellar system: Functional properties as revealed by harmaline-induced tremor
Llin�s, R., & Volkind, R. A. (1973) · Experimental Brain Research · doi:10.1007/bf00236557 · Cited by 484
Bain, P. G., Findley, L. J., Atchison, P., Behari, M., Vidailhet, M., Gresty, M., Rothwell, J. C., Thompson, P. D., & Marsden, C. D. (1993) · Journal of Neurology, Neurosurgery & Psychiatry · doi:10.1136/jnnp.56.8.868 · Cited by 437
PHYSIOLOGICAL OBSERVATIONS IN STEREOTAXIC OPERATIONS IN EXTRAPYRAMIDAL MOTOR DISTURBANCES
HASSLER, R., RIECHERT, T., MUNDINGER, F., UMBACH, W., & GANGLBERGER, J. A. (1960) · Brain · doi:10.1093/brain/83.2.337 · Cited by 355
Tourette syndrome deep brain stimulation: A review and updated recommendations
Schrock, L. E., Mink, J. W., Woods, D. W., Porta, M., Servello, D., Visser‐Vandewalle, V., Silburn, P. A., Foltynie, T., Walker, H. C., Shahed‐Jimenez, J., et al. (2015) · Movement Disorders · doi:10.1002/mds.26094 · Cited by 282
Self-citationSynchronized brain network associated with essential tremor as revealed by magnetoencephalography
Schnitzler, A., Münks, C., Butz, M., Timmermann, L., & Gross, J. (2009) · Movement Disorders · doi:10.1002/mds.22633 · Cited by 265 · cited 6×
“Excessive synchrony of the brainstem-cerebello-thalamocortical loop is implicated in essential tremor pathophysiology (Llinás and Volkind, 1973; Schnitzler et al., 2009).”
BackgroundInfluentialCoordinated reset has sustained aftereffects in Parkinsonian monkeys
Tass, P. A., Qin, L., Hauptmann, C., Dovero, S., Bezard, E., Boraud, T., & Meissner, W. G. (2012) · Annals of Neurology · doi:10.1002/ana.23663 · Cited by 262
Coordinated reset neuromodulation for Parkinson's disease: Proof‐of‐concept study
Adamchic, I., Hauptmann, C., Barnikol, U. B., Pawelczyk, N., Popovych, O., Barnikol, T. T., Silchenko, A., Volkmann, J., Deuschl, G., Meissner, W. G., et al. (2014) · Movement Disorders · doi:10.1002/mds.25923 · Cited by 213
SUPPRESSION OF INTENTION TREMOR BY CONTINGENT DEEP-BRAIN STIMULATION
Brice, J., & Mclellan, L. (1980) · The Lancet · doi:10.1016/s0140-6736(80)91680-3 · Cited by 198
Phase-response curves and synchronized neural networks
Smeal, R. M., Ermentrout, G. B., & White, J. A. (2010) · Philosophical Transactions of the Royal Society B: Biological Sciences · doi:10.1098/rstb.2009.0292 · Cited by 198 · cited 4×
“instantaneous frequency) of an oscillator (Ermentrout, 1996; Smeal et al., 2010).”
BackgroundInfluentialMultiple oscillators are causing parkinsonian and essential tremor
Raethjen, J., Lindemann, M., Schmaljohann, H., Wenzelburger, R., Pfister, G., & Deuschl, G. (2000) · Movement Disorders · doi:10.1002/1531-8257(200001)15:1<84::aid-mds1014>3.0.co;2-k · Cited by 196
Calculating total electrical energy delivered by deep brain stimulation systems
Koss, A. M., Alterman, R. L., Tagliati, M., & Shils, J. L. (2005) · Annals of Neurology · doi:10.1002/ana.20525 · Cited by 195
Long-term results of thalamic deep brain stimulation for essential tremor: Clinical article
Zhang, K., Bhatia, S., Oh, M. Y., Cohen, D., Angle, C., & Whiting, D. (2010) · Journal of Neurosurgery · doi:10.3171/2009.10.jns09371 · Cited by 190
The safety and efficacy of thalamic deep brain stimulation in essential tremor: 10 years and beyond
Baizabal-Carvallo, J. F., Kagnoff, M. N., Jimenez-Shahed, J., Fekete, R., & Jankovic, J. (2014) · Journal of Neurology, Neurosurgery & Psychiatry · doi:10.1136/jnnp-2013-304943 · Cited by 181 · cited 2×
“However, the disruptive effects of high frequency stimulation are not necessarily specific for the neural signals driving disease symptoms, and associated disruption of physiological activity may explain some stimulation-induced side effects such as dysarthria, reduced verbal fluency, and impairments in balance and ga…”
BackgroundEssential Tremors: A Family of Neurodegenerative Disorders?
Louis, E. D. (2009) · Archives of Neurology · doi:10.1001/archneurol.2009.217 · Cited by 171
Pathophysiology of nonparkinsonian tremors
Deuschl, G., & Bergman, H. (2002) · Movement Disorders · doi:10.1002/mds.10141 · Cited by 171
Lipsman, N., Neimat, J. S., & Lozano, A. M. (2007) · Neurosurgery · doi:10.1227/01.neu.0000279719.75403.f7 · Cited by 151
Hua, S. E., & Lenz, F. A. (2005) · Journal of Neurophysiology · doi:10.1152/jn.00527.2004 · Cited by 134 · cited 4×
“Thus to realize clinically significant tremor suppression in patients with dystonic tremor the amount of energy delivered during phase-specific stimulation may need to be increased by either increasing the number of pulses delivered per tremor cycle or by increasing the stimulation amplitude.”
BackgroundInfluentialDeep brain stimulation for treatment-refractory obsessive compulsive disorder: a systematic review
Kohl, S., Schönherr, D. M., Luigjes, J., Denys, D., Mueller, U. J., Lenartz, D., Visser-Vandewalle, V., & Kuhn, J. (2014) · BMC Psychiatry · doi:10.1186/s12888-014-0214-y · Cited by 110
Improving Targeting in Image-Guided Frame-Based Deep Brain Stimulation
Holl, E. M., Petersen, E. A., Foltynie, T., Martinez-Torres, I., Limousin, P., Hariz, M. I., & Zrinzo, L. (2010) · Operative Neurosurgery · doi:10.1227/neu.0b013e3181f7422a · Cited by 110
Self-citationVonck, K. E. J., Sprengers, M., Carrette, E., Dauwe, I., Miatton, M., Meurs, A., Goossens, L., Herdt, V. D., Achten, R., Thiery, E. W., et al. (2012) · International Journal of Neural Systems · doi:10.1142/s0129065712500347 · Cited by 108
Oscillatory dynamics in the hippocampus support dentate gyrus–CA3 coupling
Akam, T., Oren, I., Mantoan, L., Ferenczi, E., & Kullmann, D. M. (2012) · Nature Neuroscience · doi:10.1038/nn.3081 · Cited by 103
Identification of psychogenic, dystonic, and other organic tremors by a coherence entrainment test
McAuley, J., & Rothwell, J. (2004) · Movement Disorders · doi:10.1002/mds.10707 · Cited by 101
Sharott, A., Grosse, P., Kühn, A. A., Salih, F., Engel, A. K., Kupsch, A. R., Schneider, G., Krauss, J. K., & Brown, P. (2008) · Brain · doi:10.1093/brain/awm324 · Cited by 101
Self-citationBasu, I., Graupe, D., Tuninetti, D., Shukla, P., Slavin, K. V., Metman, L. V., & Corcos, D. M. (2013) · Journal of Neural Engineering · doi:10.1088/1741-2560/10/3/036019 · Cited by 99
The nature of tremor circuits in parkinsonian and essential tremor
Cagnan, H., Little, S., Foltynie, T., Limousin, P., Zrinzo, L., Hariz, M., Cheeran, B., Fitzgerald, J., Green, A. L., Aziz, T., et al. (2014) · Brain · doi:10.1093/brain/awu250 · Cited by 97 · cited 4×
“In systems of coupled oscillators this can effectively modulate how close the system is to its peak resonance and maximum amplitude (Cagnan et al., 2014).”
BackgroundMethodInfluentialSelf-citationPhase dependent modulation of tremor amplitude in essential tremor through thalamic stimulation
Cagnan, H., Brittain, J.-S., Little, S., Foltynie, T., Limousin, P., Zrinzo, L., Hariz, M., Joint, C., Fitzgerald, J., Green, A. L., et al. (2013) · Brain · doi:10.1093/brain/awt239 · Cited by 95 · cited 6×
“Stimulation pulse width was increased to 180–210 ms based on a previous study (Cagnan et al., 2013) (Table 1).”
BackgroundMethodInfluentialSelf-citationPhase-selective entrainment of nonlinear oscillator ensembles
Zlotnik, A. V., Nagao, R., Kiss, I. Z., & Li, J.-S. (2016) · Nature Communications · doi:10.1038/ncomms10788 · Cited by 95
Pedrosa, D. J., Reck, C., Florin, E., Pauls, K. A. M., Maarouf, M., Wojtecki, L., Dafsari, H. S., Sturm, V., Schnitzler, A., Fink, G. R., et al. (2012) · Experimental Neurology · doi:10.1016/j.expneurol.2012.07.002 · Cited by 92
Self-citationOn-Demand Control System for Deep Brain Stimulation for Treatment of Intention Tremor
Yamamoto, T., Katayama, Y., Ushiba, J., Yoshino, H., Obuchi, T., Kobayashi, K., Oshima, H., & Fukaya, C. (2013) · Neuromodulation: Technology at the Neural Interface · doi:10.1111/j.1525-1403.2012.00521.x · Cited by 90 · cited 2×
“An alternative approach to increase the efficacy of DBS is to apply high frequency stimulation when a disease biomarker exceeds a preset threshold (Brice and Mclellan, 1980; Graupe et al., 2010; Basu et al., 2013; Little et al., 2013; Yamamoto et al., 2013; Herron and Chizeck, 2014).”
BackgroundHedera, P., Phibbs, F. T., Dolhun, R., Charles, D. P., Konrad, P. E., Neimat, J. S., & Davis, T. L. (2013) · Parkinsonism & Related Disorders · doi:10.1016/j.parkreldis.2013.03.010 · Cited by 86
Deep Brain Stimulation Imposes Complex Informational Lesions
Agnesi, F., Connolly, A. T., Baker, K. B., Vitek, J. L., & Johnson, M. D. (2013) · PLoS ONE · doi:10.1371/journal.pone.0074462 · Cited by 86
Distinguishing the Central Drive to Tremor in Parkinson’s Disease and Essential Tremor
Brittain, J.-S., Cagnan, H., Mehta, A. R., Saifee, T. A., Edwards, M. J., & Brown, P. (2015) · The Journal of Neuroscience · doi:10.1523/jneurosci.3768-14.2015 · Cited by 77 · cited 2×
“It has been shown previously that tremor amplitude strongly depends on how stable tremor frequency is, reflecting the resonant properties of the underlying tremor oscillators (Cagnan et al., 2014; Brittain et al., 2015).”
BackgroundSelf-citationSynchrony of rest tremor in multiple limbs in Parkinson's disease: evidence for multiple oscillators
Ben‐Pazi, H., Bergman, H., Goldberg, J. A., Giladi, N., Hansel, D., Reches, A., & Simon, E. S. (2001) · Journal of Neural Transmission · doi:10.1007/s007020170074 · Cited by 76
Cagnan, H., Duff, E. P., & Brown, P. (2015) · Brain · doi:10.1093/brain/awv093 · Cited by 73
Self-citationOptimal Chaotic Desynchronization for Neural Populations
Wilson, D. D., & Moehlis, J. (2014) · SIAM Journal on Applied Dynamical Systems · doi:10.1137/120901702 · Cited by 69
Graupe, D., Basu, I., Tuninetti, D., Vannemreddy, P. S. S. V., & Slavin, K. V. (2010) · Neurological Research · doi:10.1179/016164110x12767786356354 · Cited by 63
A Normative Study of Postural Tremor of the Hand
Wade, P., Gresty, M. A., & Findley, L. J. (1982) · Archives of Neurology · doi:10.1001/archneur.1982.00510180036009 · Cited by 62
Elble, R. J. (2013) · Current Neuropharmacology · doi:10.2174/157015913804999478 · Cited by 60
Effect of frequency on subthalamic nucleus deep brain stimulation in primary dystonia
Ostrem, J. L., Markun, L. C., Glass, G. A., Racine, C. A., Volz, M. M., Heath, S., de Hemptinne, C., & Starr, P. A. (2014) · Parkinsonism & Related Disorders · doi:10.1016/j.parkreldis.2013.12.012 · Cited by 51
Verbal Fluency in Essential Tremor Patients: The Effects of Deep Brain Stimulation
Pedrosa, D. J., Auth, M., Pauls, K. A. M., Runge, M. J. R., Maarouf, M., Fink, G. R., & Timmermann, L. (2014) · Brain stimulation · doi:10.1016/j.brs.2014.02.012 · Cited by 48
Self-citationPurkinje cell loss is a characteristic of essential tremor
Louis, E. D., Faust, P. L., & Vonsattel, J.-P. G. (2011) · Parkinsonism & Related Disorders · doi:10.1016/j.parkreldis.2011.05.004 · Cited by 45
Cagnan, H., Meijer, H. G. E., van Gils, S. A., Крупа, М. М., Heida, T., Rudolph, M., Wadman, W. J., & Martens, H. C. F. (2009) · European Journal of Neuroscience · doi:10.1111/j.1460-9568.2009.06922.x · Cited by 44
Self-citationPrototype closed-loop deep brain stimulation systems inspired by Norbert Wiener
Herron, J. A., & Chizeck, H. J. (2014) · IEEE Conference on Norbert Wiener in the 21st Century (21CW) · doi:10.1109/norbert.2014.6893922 · Cited by 22
Tremor induced by thalamic deep brain stimulation in patients with complex regional facial pain
Constantoyannis, C., Kumar, A., Stoessl, A. J., & Honey, C. R. (2004) · Movement Disorders · doi:10.1002/mds.20047 · Cited by 20
Inertial-based control system concepts for the treatment of movement disorders
Cagnan, H., Brown, P., Bourget, D., & Denison, T. (2015) · International Conference on Solid-State Sensors, Actuators and Microsystems · doi:10.1109/transducers.2015.7180863 · Cited by 8
Self-citation
Cited by
Technology of deep brain stimulation: current status and future directions
Krauss, J. K., Lipsman, N., Aziz, T., Boutet, A., Brown, P., Chang, J. W., Davidson, B., Grill, W. M., Hariz, M. I., Horn, A., et al. (2021) · Nature Reviews Neurology · doi:10.1038/s41582-020-00426-z · Cited by 919
Self-citationEmerging technologies for improved deep brain stimulation
Cagnan, H., Denison, T., McIntyre, C., & Brown, P. (2019) · Nature Biotechnology · doi:10.1038/s41587-019-0244-6 · Cited by 272
Self-citationTan, H., Debarros, J., He, S., Pogosyan, A., Aziz, T. Z., Huang, Y., Wang, S., Timmermann, L., Visser-Vandewalle, V., Pedrosa, D. J., et al. (2019) · Brain Stimulation · doi:10.1016/j.brs.2019.02.011 · Cited by 83
“Prior studies of closed-loop DBS for ET have used wearable inertial sensors [12,13] and/or surface electromyography (EMG) [14] to provide feedback for the control of the stimulator.”
Self-citationHell, F., Palleis, C., Mehrkens, J. H., Koeglsperger, T., & Bötzel, K. (2019) · Frontiers in Neurology · doi:10.3389/fneur.2019.00314 · Cited by 75
Improved detection of Parkinsonian resting tremor with feature engineering and Kalman filtering
Yao, L., Brown, P., & Shoaran, M. (2020) · Clinical Neurophysiology · doi:10.1016/j.clinph.2019.09.021 · Cited by 68
Self-citation
Metadata
- Authors
- Cagnan, H., Pedrosa, D., Little, S., Pogosyan, A., Cheeran, B., Aziz, T., Green, A., Fitzgerald, J., Foltynie, T., Limousin, P., Zrinzo, L., Hariz, M., Friston, K. J., Denison, T., & Brown, P.
- Affiliations
- University of Oxford (GB)
- UCL Queen Square Institute of Neurology (GB)
- Medtronic (United States) (US)
- Corresponding author
- Cagnan, Hayriye
- ORCID
- Venue
- Brain
- Publisher
- Oxford University Press (OUP)
- Published
- 2016-12-22
- Volume
- 140
- Issue
- 1
- Pages
- 132-145
- ISSN
- 0006-8950 (ISSN-L)
- 1460-2156
- PMC
- PMC5226063
- OpenAlex
- W2563867255
- Cited by
- 270
- References
- 56
- Citations by year
- 2026: 19 · 2025: 25 · 2024: 31 · 2023: 36 · 2022: 30 · 2021: 29 · 2020: 35 · 2019: 30 · 2018: 22 · 2017: 12 · 2016: 1
- FWCI
- 16.17
- Type
- journal article
- Language
- en
- Open access
- hybrid
- doi.org
- Licence
- cc-by
- Locations
- Brain (publishedVersion, cc-by)
- PubMed Central (publishedVersion, cc-by)
- PubMed (publishedVersion)
- St George's Online Research Archive (St George's University of London) (acceptedVersion)
- UCL Discovery (University College London) (submittedVersion)
- eScholarship (California Digital Library) (submittedVersion, cc-by)
- HighWire Press Open Archive (submittedVersion)
- Funders
- Wellcome Trust (105804/Z/14/Z)
- Rosetrees Trust (M235-CD3, M526-B-CD1, M235-CD1)
- Deutsche Forschungsgemeinschaft
- Medical Research Council (MR/M014762/1, MC_UU_12024, MC_UU_12024/1)
- Topics
- Health Sciences › Medicine › Clinical Neurology › Deep Brain Stimulation and Movement Disorders
- Social Sciences › Psychology › Clinical Psychology › Obsessive-Compulsive Spectrum Disorders
- Life Sciences › Neuroscience › Neurology › Transcranial Magnetic Stimulation Studies
- Keywords
- phase-locked stimulation, essential tremor, pathological tremor, ventrolateral thalamic nucleus, neuronal synchronization, tremor suppression, Parkinson's disease
- MeSH terms
- Dystonia, Humans, Thalamus, Tremor, Essential Tremor, Deep Brain Stimulation, Accelerometry
About these checks
Registry, retraction, Cites and statistics results are computed, not judged, with one exception: a printed reference that no index lists is read once by a model before it counts as a citation error. Claims are extracted by a model and kept only when their quote appears verbatim in the text; each cited source is then checked, with a model’s help, for whether it says what the claim relies on. Those verdicts can be wrong — read the claim’s quote and the cited source before relying on one.
Statistics and arithmetic are recomputed, not judged.
Confidence bands are shown only for fields calibrated on our annotated test set. None is calibrated yet, so no band is shown.
What counts as a claim ›How we measure confidence ›How we check this ›
Are you an author, or do you see a problem with this page? Request a review
Data sources
Bibliographic data: Semantic Scholar, OpenAlex, Crossref.
Contains information from the Semantic Scholar Academic Graph Datasets, made available under the ODC Attribution License (ODC-BY 1.0).
Semantic Scholar’s data is described in: Kinney, R., et al. (2023). The Semantic Scholar Open Data Platform. arXiv:2301.10140.
